Optically Interrogated Unique Object
with Simulation Attack Prevention
Povilas Marcinkevicius
+, Ibrahim Ethem Bagci
+, Nema M. Abdelazim
∗,
Christopher S. Woodhead
∗, Robert J. Young
∗and Utz Roedig
+ +School of Computing and Communications, Lancaster University, UK{p.marcinkevicius, i.bagci, u.roedig}@lancaster.ac.uk
∗Physics Department, Lancaster University, UK
{n.abdelazim, c.woodhead, r.j.young}@lancaster.ac.uk
Abstract—A Unique Object (UNO) is a physical object with unique characteristics that can be measured externally. The usually analogue measurement can be converted into a digital representation - a fingerprint - which uniquely identifies the ob-ject. For practical applications it is necessary that measurements can be performed without the need of specialist equipment or complex measurement setup. Furthermore, a UNO should be able to defeat simulation attacks; an attacker may replace the UNO with a device or system that produces the expected measurement. Recently a novel type of UNOs based on Quantum Dots (QDs) and exhibiting unique photo-luminescence properties has been proposed. The uniqueness of these UNOs is based on quantum effects that can be interrogated using a light source and a camera. The so called Quantum Confinement UNO (QCUNO) responds uniquely to different light excitation levels which is exploited for simulation attack protection, as opposed to focusing on features too small to reproduce and therefore difficult to measure. In this paper we describe methods for extraction of fingerprints from the QCUNO. We evaluate our proposed methods using 46 UNOs in a controlled setup. Focus of the evaluation are entropy, error resilience and the ability to detect simulation attacks.
Index Terms—UNO, entropy, simulation attack
I. INTRODUCTION
Counterfeit products cause financial damage and are also dangerous to our health. Every year, imports of counterfeited and pirated goods around the world cost nearly $0.6 trillion in lost revenue [1]. The World Health Organization reports that ”An estimated 1 in 10 medical products in low- and middle-income countries is substandard or falsified” [2].
Industry has aimed to address this problem using techni-cal solutions. For example, holograms are a widely adopted method for product tagging and verification. By visually inspecting a hologram, a customer should be able to verify if the product is genuine or not. Unfortunately, holograms can be duplicated and sophisticated counterfeits exist.
Unique Objects (UNOs) are an existing concept (see R¨uhrmair et. al. [3]) that can be employed to address the afore-mentioned duplication problem. A UNO is a physical object with unique characteristics that can be measured externally. The usually analogue measurement can be converted into a digital representation - a fingerprint - which uniquely identifies the object. The core property of a UNO is unclonability; it is impossible to construct a duplicate with the same fingerprint. Using UNOs improves product tagging as duplication is
not possible. However, new challenges are introduced. The customer now requires a measurement device to read the digital fingerprint. For a practical scenario the reading device must be inexpensive and the measurement setup must be simple. In addition, the customer must still be able to verify that he is reading data from the UNO and not from a device or system that produces the expected measurement. A simple visual inspection might not be sufficient for detecting such simulation attacks.
A number of devices exploiting unique disorder of physical objects have been proposed [4], [5], [6], [7], [8], [9]. However, these existing solutions have so far not been used for large-scale product tagging as complex measurement setups are required. For example, Pappu et al. [10] propose an optical device which can be interrogated using a laser and camera while the device is accurately aligned.
Recently, novel UNOs based on imperfect quantum mate-rials, exhibiting unique photo-luminescence properties, were proposed [11]. The uniqueness of these Unique Objects (UNOs) is based on quantum effects. These so called QCUNO can be interrogated using a light and a camera. The QCUNO responds non-linearly to different light excitation levels which allows us to implement protection against simulation attacks without without direct analysis of microscopic features.
In this paper we describe methods for extraction of finger-prints from the QCUNO. We evaluate our proposed methods using 46 UNOs in a controlled setup. Focus of the evaluation are entropy, error resilience and the ability to detect simulation attacks. Our results demonstrate that the QCUNO is resistant to simulation attacks and informs us what algorithms and parameters to use in a practical implementation. The specific contributions of this paper are:
• Fingerprint Generation: We describe QCUNO fingerprint generation methods and evaluate these using 46 QCUNO. Entropy and error resilience are investigated.
• Excitation Response Evaluation: We show that the QCUNO has non-linear excitation properties which are required for simulation attack prevention.
The next section describes related work followed by Sec-tion III describing the QCUNO. SecSec-tion IV describes the algorithm used to generate the QCUNO fingerprint. Section V describes the experimental setup and provides the evaluation results of 46 QCUNO. In Section VI and Section VII entropy and error resilience are evaluated. Section VIII provides an analysis of simulation attack detection. Section IX discusses implications for a practical QCUNO based authentication implementation and Section X concludes the paper.
II. RELATEDWORK
Unique disorder properties of physical objects have been utilised to create security primitives over the last decades. These properties are hard to clone and inherent to the objects. The systems based on the disorder properties can be classified as Physical Unclonable Functions (PUFs) and UNOs [3]. The QCUNO is classified as UNO, as its properties are not secret. UNOs based on different materials have been proposed such as paper fibers [4], physical irregularities on CDs [5], patterns appearing on plates of specific plastics [6], and many more [7], [8], [9]. Baiet al. [12] use Quantum Dots (QDs) to create spectral bar-codes. However, this work does not aim to provide UNOs. Cao et al. [11] describe the use of quantum materials for the construction of UNO and PUF. The work does not provide a detailed discussion or analysis of digital fingerprint generation, entropy or error handling as provided in this paper. The QCUNO can be evaluated using a simple light and camera while other solutions often require a complex measure-ment setup. For example, Pappu et al. [10] propose an optical device which can be interrogated using a laser and camera while the device is accurately aligned. Our work studies the impact of environmental factors (scratches, dirt, measurement misalignment) on fingerprint extraction. Existing work mostly does not consider such practical aspects. For example, existing work such as [6], [7], [9] does not discuss device behaviour in presence of errors. The QCUNO also discusses simulation attack detection and resistance which other proposed solutions such as [5], [6], [7], [9] do not discuss.
III. THEQUANTUMCONFINEMENTUNO
The QCUNO consists of Quantum Dots (QDs) placed on a surface. A light source is used to excite the QCUNO which responds with a photo-luminescence effect. The optical response at each position of the surface is unique to the intensity of the light source and the arrangement of QDs.
A. Device Structure
QDs are semiconductor particles of only several nanometers in size. Their optical and electronic properties differ from properties of larger particles. Due to QDs’ small size where the radius is less than the bulk exciton Bohr radius, the electrons are confined and the energy levels become dis-crete. Confinement effects make QDs promising materials with unique optical properties such as size-tunable photo-luminescence, large multi-photon absorption cross section, fast-response, non-linear refractive index, high quantum yield, good stability and easy chemical processability [13]. When
0 10 20 30 40 50 60 70 80 90 100
Light Source Power (%) 0
10 20 30 40 50 60
[image:2.612.337.534.54.139.2]Pixel Brightness
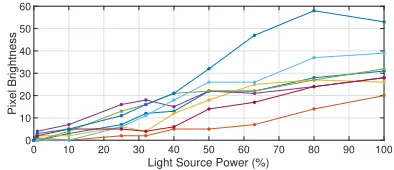
Fig. 1:Power of light emission in dependency of power of excitation
light for a collection of QDs in 8 different areas of a QCUNO. The dependency is non-linear and unique for each QCUNO area.
the QDs are excited, non-linear absorption, luminescence, and coherent phonon vibration [14] can be observed. Semiconduc-tor QDs absorb photons when the excitation energy exceeds the bandgap. Excitation at shorter wavelengths (higher energy) is possible because multiple electronic states are present at higher energy levels [15]. These novel optical properties make QDs ideal fluorophores for multiplexing applications in anti-fake label and security devices [12]. II-VI semiconductor-based QDs offer significantly higher multiple absorption cross sections with respect to the particle volume [16], [17]. The higher the absorption cross section per particle or volume, the lower the excitation intensities needed to obtain a high enough response with the same amount of material for applications [18]. With longer duration excitation, the larger non-linear absorption can be observed. This is mainly caused by the thermal effect and excited state absorption.
Alloyed colloidal (CdSeS/ZnS) QDs used in this study are commercially available from Sigma-Aldrich with an average diameter of 6 nm, corresponding to a photo-luminescence wavelength of around 620 nm. QCUNOs are created by a draw-down bar using QDs encapsulated in a matched stable polymer. The polymer is used to reduce the toxicity and greatly enhance the photostability, ensuring that the material properties do not change with time.
B. Device Interrogation
When excited by a light source the QDs of the QCUNO absorb photons and respond with light emission. The observed light intensity in each area of the QCUNO depends on the structure of the present QDs in this area. Figure 1 shows the response of a QCUNO for 8 example areas. Due to the aforementioned non-linear absorption the response to different excitation powers is non-linear. It is possible to measure differ-ent responses of a QCUNO using differdiffer-ent excitation powers. Light emission in areas of the QCUNO can be measured using a camera. Each pixel corresponds to an area containing a set of QDs. Image information can then be translated into a digital QCUNO fingerprint.
C. Attack Resistance
design a device which creates the required light emissions for the measurement apparatus: a simulation attack.
We assume that the user has confidence in his measurement device (i.e. a device with camera such as a smart phone). We assume the measurement device is not compromised. We assume the only feasible attack is to replace the QCUNO.
The user can inspect the QCUNO before interrogation and will be able to identify an attack using an active component such as a display. Consequently, the only remaining option for the attacker is to use a passive QCUNO replacement.
A simple replacement would be a printout where each position on the surface is coloured such that light reflecting from the surface when interrogated corresponds to the intensity of the QCUNO light emission. Such attack is possible for one excitation level. However, such printed replacement cannot provide the correct response for different excitation levels. This is due to the non-linear QCUNO response to excitation light power levels. A simple printout would have a linear response profile.
To simulate different responses for different excitation light levels specific material is required. For each surface position the material has to respond at each excitation level with the correct light output. This exact behaviour cannot be engineered by placing QDs. We are also not aware of any other material that is capable to produce the required output.
IV. QCUNO DATAEXTRACTION
The optical response of the QCUNO has to be translated into a digital fingerprint. Using a camera, the QCUNO is imaged and then a fingerprint is generated from the image data.
A. Imaging and Pre-Processing
To protect against simulation attacks (see Section III) the QCUNO is interrogated using different light intensities. In this work we decided to use just two intensity levels; however, measurements at additional intensity levels are possible.
A camera with a resolution of I×J pixels is used to take an image of the QCUNO at the two light intensity levels. We use only the red channel of the RGB image as the QDs we used emit light in the red spectrum. We use information from the red channel and treat the image as grey scale image.
Each pixel records the aggregated photo-luminescence re-sponse for the QDs in the area of the QCUNO corresponding to this pixel. An example of two images for high and low intensity levels is shown in Figure 2a and Figure 2b for a camera resolution of 960×800 pixels.
Next, for each pixel the brightness value recorded at high intensity is divided by the brightness measured at low intensity. An example of the resulted combined image is shown in Figure 2c. Division is used as for two images with a non-linear dependency the resulting image contains clear visible features; two images with linear dependency produce an image where all pixels have the same value (with some variation due to measurement noise). This combination method is useful for simulation attack detection as we demonstrate in Section VIII. Other operations such as subtraction are possible as well, however pre-processing is then required to normalise images.
Finally, the combined image is resized to K ×K to fit
the algorithm for fingerprint generation. For example, if a fingerprint of 4096 bit is required, the image is scaled to a
size of 64×64. As the image is scaled down from I ×J
to K ×K each pixel aggregates information from a larger
QCUNO area. However, the grey scale value of each pixel still corresponds to the QDs composition in the corresponding area of the QCUNO. As the image is downsized, the resilience to measuring errors increases; pixels aggregate information from a larger number of QDs and displacement (misalignment of the reading device) has less impact on the overall brightness value. This is important for practical applications where, for example, a smart phone camera is used to read a QCUNO and alignment of reading device and QCUNO is subject to some error. Figure 2d shows an example of the resulting pre-processed image which can now be used for fingerprint generation.
B. Fingerprint Generation
Once the image has been resized, an algorithm is needed to transform the obtained emission pattern into a robust and unique identifier - a fingerprint. Generating robust identifiers from emission pattern has been studied before. Gabor Filters are a popular method of extracting data from emission patterns [19], [20], [10]. However, it has been shown that significantly better alternatives exist when considering entropy of the ex-tracted data [21].
Thus, for our work we decided to use the existing AHB
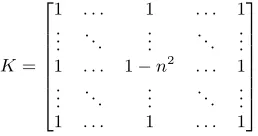
proposed by R¨uhrmair et. al. [21]. AHB uses an n × n
[image:3.612.373.502.501.569.2]convolution kernel (see Equation 1) which is moved pixel by pixel over the input image. In each position the outcome of applying the kernel is recorded and filtered by a threshold which generates the output image - the fingerprint. Figure 2d shows an example input to which the kernel is applied, Figure 2e shows the output. The output image can be read line by line creating a sequence of 0’s (white) and 1’s (black) which is the QCUNO fingerprint.
K=
1 . . . 1 . . . 1 ..
. . .. ... . .. ...
1 . . . 1−n2 . . . 1 ..
. . .. ... . .. ...
1 . . . 1 . . . 1
(1)
All values of the kernel are 1, except for anchor point (anchor pixel) which has the value 1−n2. At each position
of the image the kernel values are multiplied with the corre-sponding pixel brightness levels and the sum of all results is calculated. The resulting value of the convolution is less than 0 if the anchor point is brighter than the surrounding pixels, and more than 0 otherwise. This result being above or below 0 determines whether the fingerprint value is 1 or 0.
experi-(a)High excitation (b)Low excitation (c)High/Low excitation (d) Resized (e)AHB
Fig. 2:Image of a QCUNO at (a) high excitation and (b) low excitation. (c) the combination of both images. (d) The resized image and (e)
the result of applying Adaptive High Boost (AHB) to the combined image.
0 0.1 0.2 0.3 0.4 0.5 0.6
Fractional Hamming Distance 10-8
10-6 10-4 10-2 100
Probability Mass Function
Inter-Device Intra-Device
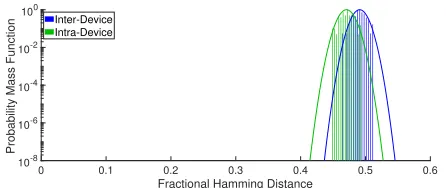
Fig. 3: Inter-device and Intra-device hamming distances of 46
QCUNO using AHB (kernel size n = 9; 2048 bit fingerprint).
QCUNO can be easily identified as inter and intra device distributions are separable.
ments using the OpenCV [22] functionsImgproc.filter2Dand
Imgproc.threshold.
V. QCUNO EVALUATION
We produced 46 QCUNO for evaluation purposes. A mi-croscope with 10x magnification was used for imaging. The QCUNO was excited using a white light, filtered using a 500nm wavelength short-pass filter. The light emitted by the QCUNO was filtered using a 600nm wavelength long-pass filter to remove other light than emissions from the QCUNO.
Each QCUNO was imaged to evaluate inter-device hamming
distance; one QCUNO was imaged 50 times to evaluate intra-device hamming distance.
The inter-device hamming distance is the number of bits in which fingerprints from two devices (QCUNOs) differ. In an ideal situation two devices would differ in half of their bits. When normalising the distance a value of 0.5 describes the ideal situation.
The intra-device hamming distance is the number of bits in which fingerprints from the same device (QCUNOs) imaged at two different times differ. In an ideal situation the same device should always produce the same bit sequence and the intra-device hamming distance should be zero.
In a practical setting the intra-device hamming distance will be above zero due to measurement errors. However, to be able to verify the identity of a QCUNOs with confidence it is necessary that the intra-device hamming distance can be clearly distinguished from the inter-device hamming distance. In a practical setting the QCUNOs fingerprint is recorded and then compared to a stored value. If the hamming distance is below a threshold the QCUNOs identity is accepted. A medium kernel size ofn= 9is used in the experiment. Kernel size has an impact on error resilience which we investigate in
[image:4.612.62.285.184.278.2]detail in Section VII.
Figure 3 shows the evaluation result. The figure shows the normalised occurrence of inter- and intra-device hamming distances and their fitted normal distribution. The mean and variance values for AHB for inter- and intra-device hamming distance distributions are µ = 0.48, σ2 = 1.6×10⁻⁴ and µ= 0.19,σ2= 5.5×10⁻⁴ respectively.
The probability of false negatives and false positives can be determined by the inter- and intra-device hamming distance distributions. Given that the curves represent the probability of specific value appearing, rather than being cumulative, integration can be used to calculate False Positive Rate (FPR)
and False Negative Rate (FNR): F P R = Rt
−inffinter and
F N R = Rtinffintra where t is the threshold and f is a
probability distribution function. If we assume a threshold
of t = 0.25 (to bias towards a low FPR rate as a practical
setting would do) we obtain a FPR of 3.5 ×10−74 and
a FNR of 0.0053. Other thresholds between the means of
the distributions can be used depending on the application scenario.
VI. ENTROPYEVALUATION
Entropy can be used to describe the uniqueness of the QCUNO; i.e. how many unique fingerprints can be produced. Using the methodology demonstrated by Pappu [10] we found that AHB achieves bitwise maximum Shannon entropy. Ad-ditionally, AHB signatures satisfy the properties of binomial distribution:
1) The data consists of a sequence of nidentical trials - a trial is a pixel being black or white.
2) Two outcomes, success or failure, are possible on each trial - this maps to black pixel and white pixel after applying AHB.
3) The probability of success on any trial does not change from trial to trial - for QCUNOs processed using AHB, the probability for the pixel to be white is always 50%, as the mean of the convolution kernel is equal to the threshold applied afterwards.
4) The trials are independent - as each pixel covers a separate set of QDs, their results are independent.
This allows us to also use the estimation of Effective Number of Independent Bits (ENIB) as shown by Pappu [10] and R¨uhrmair et al. [21]. It is defined as
E=µ(1−µ)
3 5 7 9 11 13 15 17 19 Kernel Size 0.6 0.7 0.8 0.9 1 Fractional Entropy
[image:5.612.310.545.50.308.2]Generated Data - AHB Microscope Data - AHB
Fig. 4:Entropy achieved by AHB using randomly generated emission
patterns and emission patterns obtained from 46 QCUNO.
(a)Rotation (b)Transposition (c)Gradient
[image:5.612.65.280.55.147.2](d)Noise (e)Line (f) Dots
Fig. 5: Error types used for evaluation. (a) Rotation - 3 degrees
(around center); (b) Transposition - 2.5% (of image width); (c) Gradient - 100% (corners become black and white); (d) Noise - 50% (different noise overlaid with 50% opacity); (e) Line (it’s width is 4% of image width); (f) 16 dots (their radius is 4% of image width).
where E estimates the ENIB in fingerprints. µ and σ2 are
determined by experimentation and are mean and variance describing the inter-device hamming distances. The value is then normalised to the bit-length of the fingerprint to obtain the estimated entropy. A value close to 1 indicates maximum bit independence.
The performance of AHB in terms of entropy is evaluated using our 46 QCUNO and 800 randomly generated images.
The random images of size 64×64 pixels use a random
brightness value for each pixel and are used as input for AHB. Generated images were included as reference point as these would provide the best entropy values one can expect.
Figure 4 shows the results. The entropy generated from QCUNOs samples are subject to variation as only 46 sam-ples are used; entropy determined of generated images are smoother as 800 images are used as input.
For AHB on random images the entropy improves with increasing kernel size; when using QCUNOs samples the entropy is largely independent of the selected kernel size. In all cases, achieved entropy values are sufficient for practical scenarios.
VII. ERRORRESILIENCEEVALUATION
We evaluate the impact of expected error conditions on the performance of AHB. Examples of error conditions tested are shown in Figure 5 which focuses on three aspects: misalign-ment with the reading device (5a, 5b), variations in lighting
0 1 2 3
Rotation (Degrees) 0 0.10 0.20 0.30 0.40 0.50 Fractional Hamming Distance GD, n=3 GD, n=9 GD, n=15 MD, n=3 MD, n=9 MD, n=15 (a)Rotation
0 0.5 1 1.5 2 2.5
Transposition (Image Size %) 0 0.10 0.20 0.30 0.40 0.50 0.60 Fractional Hamming Distance GD, n=3 GD, n=9 GD, n=15 MD, n=3 MD, n=9 MD, n=15 (b)Transposition
0 50 100
Gradient (Opacity Fraction)
0 0.02 0.04 0.06 0.08 0.10 0.12 0.14 Fractional Hamming Distance GD, n=3 GD, n=9 GD, n=15 MD, n=3 MD, n=9 MD, n=15 (c)Gradient
0 0.1 0.2 0.3 0.4
Noise (Opacity Fraction)
0 0.05 0.10 0.15 0.20 0.25 Fractional Hamming Distance GD, n=3 GD, n=9 GD, n=15 MD, n=3 MD, n=9 MD, n=15 (d)Noise
0 1 2 3 4
Line Width (Image Size %)
0 0.01 0.02 0.03 0.04 0.05 0.06 0.07 0.08 Fractional Hamming Distance GD, n=3 GD, n=9 GD, n=15 MD, n=3 MD, n=9 MD, n=15 (e)Line
[image:5.612.56.290.63.322.2]0 1 2 3 4 Dot Radius (Image Size %) 0 0.05 0.10 0.15 Fractional Hamming Distance GD, n=3 GD, n=9 GD, n=15 MD, n=3 MD, n=9 MD, n=15 (f) Dots
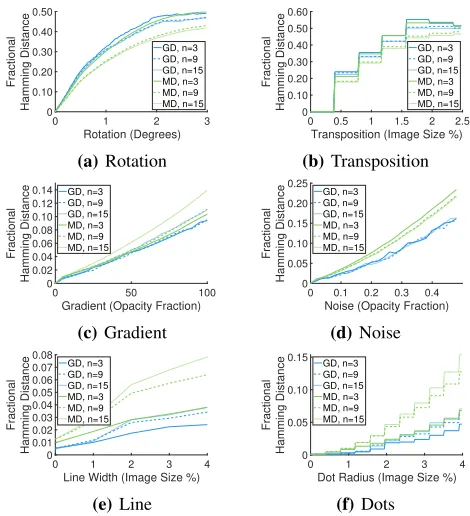
Fig. 6: The effect of different error types on QCUNO fingerprints
from Generated Data (GD) and Microscope Data (MD). The impact of kernel sizenon error is dependant on the error type.
conditions (5c, 5d) and damages of the QCUNO (5e, 5f). For this evaluation we use generated images as before for QCUNO-independent AHB evaluation, as well as image data obtained from our sample QCUNOs.
We compare fingerprints obtained from images with finger-prints generated from the same image after introduction of an error condition. The measured hamming distance of the fingerprints indicates how severe the error impact is on the fingerprint.
Figure 6 shows the impact of different errors on hamming distance when using AHB with different kernel sizes.
The trend is similar when comparing generated images and QCUNO samples. However, for some error cases hamming distances obtained from generated images are more affected (e.g. rotation and transportation).
An increase of the kernel size reduces rotation and trans-position errors, but increases gradient, line and dot errors. In other words, higher kernel sizes are better for tolerating errors induced by misalignment with measurement equipment, while lower sizes are better in case the QCUNO is damaged or lighting conditions are affected.
Thus, the kernel size should be selected according to the type of errors that are likely to be encountered.
VIII. SIMULATIONATTACKRESISTANCE
0 0.1 0.2 0.3 0.4 0.5 0.6 Fractional Hamming Distance
10-8 10-6 10-4 10-2 100
Probability Mass Function
[image:6.612.61.284.53.147.2]Inter-Device Intra-Device
Fig. 7:Results from reading printed paper (Simulation attack).
Inter-device and intra-Inter-device distributions cannot be distinguished.
is shown in Figure 7. The replacements provide a linear response in terms of excitation power and the brightness read, as they do not posses the non-linear excitation properties of the QCUNO. Therefore, dividing the images at different excitation levels provides a constant pixel value throughout the resulting picture, and the fingerprint is determined by noise. This causes the results in Figure 7, where the replacements cannot provide a stable fingerprint. It is demonstrated that the paper based simulation attack is not feasible under the given conditions.
It has to be noted that we did not aim to simulate the output of a specific QCUNO. It is not possible to create any useful output using a printed replacement, let alone the specific output created by a QCUNO.
IX. PRACTICALIMPLEMENTATION
The QCUNO has properties that make it particularly suit-able for large-scale deployments where inexpensive devices such as a mobile phone are used for scanning:
1) As the QCUNO is two-dimensional and the emission pattern is omni-directional, the camera measuring the device does not have to be fixed in a specific location in relation to the QCUNO. Instead, fiducials can be placed around the QCUNO to detect and stretch the image into a consistent format before processing.
2) Because the security relies on multiple excitation levels (as opposed to microscopic readout precision), the area covered by each pixel can be larger and, therefore, can be detected by a cheaper device.
In practice, the QCUNO will be detected using fiducials and will provide meta-data via additional markers such as a QR code. We are currently working on a reading device based on a mobile phone. Our next step is to evaluate interrogation of QCUNOs using this device. In this setting the QCUNO is identified using fiducials and corrections for perspective and orientation must be applied before processing as described in this paper can be used.
X. CONCLUSIONS
In this paper we have shown how fingerprints can be generated from a QCUNO. We used a controlled set-up for performing experiments to prove that the QCUNO has non-linear excitation properties that can be used for security. The fingerprints provide intra and inter-device hamming distances that allow us to clearly identify QCUNOs. We have described
achievable entropy and have shown how the algorithms for fingerprint extraction perform in error situations. We have also shown that the QCUNO prevents simulation attacks.
ACKNOWLEDGMENT
R.J.Y. acknowledges support by the Royal Society through a University Research Fellowship (Grants UF110555 and UF160721). This material is based upon work supported by the Air Force Office of Scientific Research under Award FA9550-16-1-0276.
REFERENCES
[1] Havocscope. (2017) Anti-Counterfeiting News and
Counterfeit Goods Statistics. [Online]. Available:
https://www.havocscope.com/category/counterfeit-goods/
[2] W. H. Organisation. (2017) Substandard and
falsified medical products. [Online]. Available:
http://www.who.int/mediacentre/factsheets/fs275/en/
[3] U. R¨uhrmair et al., “Security based on physical unclonability and disorder,” in Introduction to Hardware Security and Trust. Springer, 2012, pp. 65–102.
[4] D. Bauder, “An anti-counterfeiting concept for currency systems,”
Sandia National Labs, Albuquerque, NM, Tech. Rep. PTK-11990, 1983. [5] G. Hammouriet al., “CDs Have Fingerprints Too,” inProc. CHES’09,
2009.
[6] B. Wiggeret al., “Using unique surface patterns of injection moulded plastic components as an image based Physical Unclonable Function for secure component identification,”Scientific reports, vol. 8, no. 1, p. 4738, 2018.
[7] H. J. Baeet al., “Biomimetic Microfingerprints for Anti-Counterfeiting Strategies,”Advanced Materials, vol. 27, no. 12, pp. 2083–2089, 2015. [8] Y. Genget al., “High-fidelity spherical cholesteric liquid crystal Bragg reflectors generating unclonable patterns for secure authentication,”
Scientific reports, vol. 6, p. 26840, 2016.
[9] A. F. Smithet al., “Plasmonic Nanoparticles as a Physically Unclonable Function for Responsive Anti-Counterfeit Nanofingerprints,”Advanced Functional Materials, vol. 26, no. 9, pp. 1315–1321, 2016.
[10] R. Pappu, “Physical One-Way Functions,” PhD dissertation, Mas-sachusetts Institute of Technology, 2001.
[11] Y. Caoet al., “Optical identification using imperfections in 2D materi-als,”2D Materials, vol. 4, no. 4, 9 2017.
[12] X. Baiet al., “Anti-fake label and security identification system based on multiple luminescent quantum dots,” inProc. IEEE ASID’08, 2008. [13] A. M. Smithet al., “Mapping the spatial distribution of charge carriers in quantum-confined heterostructures,”Nature communications, vol. 5, p. 4506, 2014.
[14] L. Caoet al., “Rate-limited plastic deformation in nanocrystalline Ni,”
Journal of Applied Physics, vol. 117, no. 24, p. 244301, 2015. [15] J. Seo et al., “Colloidal chemical synthesis and nonlinear optical
properties of cadmium chalcogenide semiconductor nanocrystal quantum dots,” inConference on Lasers and Electro-Optics. Optical Society of America, 2003, p. CTuM10.
[16] F. Wuet al., “Optical nonlinearity and optical limiting of CdSeS/ZnS quantum dots,”Journal of Modern Optics, vol. 56, no. 17, pp. 1868– 1873, 2009.
[17] W. Fenget al., “Optical nonlinear properties of CdSeS/ZnS core/Shell quantum dots,”Chinese Physics Letters, vol. 25, no. 4, p. 1461, 2008. [18] R. Scottet al., “Two photon absorption in II–VI semiconductors: The
influence of dimensionality and size,”Nano letters, vol. 15, no. 8, pp. 4985–4992, 2015.
[19] B. ˇSkori´c, “On the entropy of keys derived from laser speckle; statistical properties of Gabor-transformed speckle,”Journal of Optics A: Pure and Applied Optics, vol. 10, no. 5, p. 055304, 2008.
[20] T. Ignatenkoet al., “Estimating the secrecy-rate of physical unclonable functions with the context-tree weighting method,” in Proc. IEEE ISIT’06, 2006.
[21] U. R¨uhrmairet al., “Optical PUFs Reloaded,”IACR Cryptology ePrint Archive, vol. 215, 2013.