Munich Personal RePEc Archive
Choice of Spectral Density Estimator in
Ng-Perron Test: Comparative Analysis
Malik, Muhammad Irfan and Rehman,
Atiq-ur-International Institute of Islamic Economics, Atiq-ur-International Islamic
University, Islamabasd, International Institute of Islamic Economics,
International Islamic University, Islamabasd
17 November 2014
Online at
https://mpra.ub.uni-muenchen.de/59973/
Page 1 of 15
Choice of Spectral Density Estimator in Ng-Perron Test:
Comparative Analysis
Muhammad Irfan Malik1 and Atiq-ur-Rehman2
Abstract
Ng and Perron (2001) designed a unit root test which incorporates the properties of DF-GLS and Phillips Perron test. Ng and Perron claim that the test performs exceptionally well especially in the presence of negative moving average. However, the performance of test depends heavily on the choice of spectral density estimators used in the construction of test. There are various estimators for spectral density available in literature, having crucial impact on the output of test however there is no clarity on which of these estimators gives optimal size and power properties. This study aims to evaluate the performance of Ng-Perron for different choices of spectral density estimators in the presence of negative and positive moving average using Monte Carlo simulations. The results for large samples show that: (a) in the presence of positive moving average, test with kernel based estimator give good effective power and no size distortion (b) in the presence of negative moving average, autoregressive estimator gives better effective power, however, huge size distortion is observed in several specifications of data generating process
Keywords: Ng-Perron test, Monte Carlo, Spectral Density, Unit Root Testing
JEL Classification: C01, C15, C63
1.
Introduction
Unit root testing is a well-known and one of most debated issues in econometrics. There are lots of economic and econometric implications of existence of unit root in time series data, including the incidence of spurious regression(Atiq-ur-Rehman, 2011; Libanio, 2005). Due to its importance, many tests and testing procedures were developed for testing unit root. However the size and power properties of unit root tests have always been subject to debate.
In many economic time series models, errors may have heterogeneity and temporal dependence of unknown form. This is the main source of size and power distortion of unit root tests. To draw more accurate inference from estimates of parameters it has now become important to construct unit root test based on long run variance (LRV) estimates which takes into account serial correlation and heterogeneity. The key aspect to construct LRV is to estimate the spectral density (SD hereafter) at zero frequency. There are two main types of SD estimators: (1) autoregressive estimator of spectral density, (2) kernel based estimator of spectral density. However literature does not provide any information about the relative performance of these estimators of spectral density. Many of existing tests for unit root uses estimator of spectral density at zero frequency including the Ng-Perron test. Ng and Perron (2001) have developed a new suit of tests, which according to them outperforms the other tests, especially in case of negative moving average
1
Corresponding Author, PhD. Scholar (Econometrics), International Institute of Islamic Economics, International Islamic University Islamabad, E-mail: [email protected]
2
Page 2 of 15
process. The output of test is also affected critically by choice of spectral density estimator. and literature does not provide any guide in this regard.. Ng and Perron (2001) did not discuss the effect of choice of spectral density estimator and thus leave a confusion for the practitioners with regard to choice of the estimator of spectral density.
The aim of this study is to investigate the properties of Ng-Perron test for different choices of SD estimators using Monte Carlo simulations. We examine the size distortion and effective power of the test, with both autoregressive (AR) estimator and kernel based (KB) estimators of spectral density, in the presence of negative and positive moving average. Rest of paper is organized as follows. In section 2 we discuss Ng-Perron test and estimators of spectral density estimators. Section 3 consists of our Monte Carlo design. Section 4 dedicated to the results. The detail of detection of sign of moving average is given in section 5 and conclusions in section 6.
2.
Effect of Spectral Density estimator on Output of
Ng-Perron test: A Real Data Illustration
Like other tests, the output of Ng-Perron test depends crucially on the choice of spectral density estimator and the final decision may be quite contradictory for two different choices of the density. This fact is illustrated below with the help of a real data example.
We apply Ng-Perron test on log GDP of UK from 1951-2007. The outputs of Ng-Perron test with both estimators of spectral density estimators given in Table 1.1.
Table # 1.1: Output of Ng-Perron test with AR and KB estimator for log UK GDP data
Spectral Density Estimator Ng-Perron tests
With Drift With Drift and Trend
AR Estimator -8.25* -25.25*
KB estimator
( Parzen Kernel) 1.54 -3.81
Critical Value
5% Critical Value -8.1 -17.3
The output presented in Table 1 shows that for the autoregressive estimator of spectral density, the Ng-Perron test statistics is below the critical value and unit root hypothesis should be considered rejected. On the other hand, for Kernel based estimator of spectral density, the Ng-Perron test statistics is far above the critical value and the null of unit root could not be rejected even at a loose significance level. Therefore the person applying the unit root test may be confused in the choice of result. Therefore this study is designed to compare the size and power properties of Ng-Perron test so that a practitioner may get some guidance for the right choice of spectral density estimator.
3.
Computation of Ng-Perron Test
Page 3 of 15
3.1.
Test Statistics
Dufour and King (1991) and Elliott, Rothenberg, and Stock (1996) found that local GLS detrending of the data yields significant power gains. Phillips and Perron (1988) found that use of SD could improve performance of test. Ng and Perron (2001) combines GLS detrending with SD to design new test. The proposed test consists of a suite of four tests, namely MZa, MZt, MSB and MPT. The four test statistics proposed by Ng-Perron are.
(
̃ ̂ )
( ̂ )
{
̅ ̅ ̃
̂ ̅ ̅ ̃
̂
Where represent drift and drift and trend in DGP, and ∑ ( ̃ ) . The symbol
̂ indicates the estimate of spectral density at frequency zero.
3.2.
Spectral Density at Frequency zero:
Page 4 of 15
which can be further subdivided into four types. This hirearchy is summarized in floowing fig.
The computational details of these estimators are as under:
3.2.1. Autoregressive (AR) Estimator of Spectral Density
Autoregressive estimator of spectral density was proposed by Stock (1990) (see also (Phillips & Perron, 1988; Stock, 1994)). This estimator based on the estimation of parametric model is identical to the equation of ADF test equation.
After having GLS detrending series estimate the regression equation given below.
̃ ̃ ∑ ̃ ̂ (3.1)
Autoregressive estimator of spectral density is
̂ ̂
( ̂ )
̂ ∑ ̂ And ̂ ∑ ̂
̂ s the sum of coefficients of lags of ̃ . Here ̃ ̃ ̃ and ̂ is variance of residuals ( ̂ ) from the equation (3.3)
3.2.2. Kernel Based (KB) Estimator of Spectral Density
Non parametric kernel based estimator of spectral density was proposed by Phillips (1987) and then restructured by Phillips and Perron (1988). Kernel based estimator of spectral density is the weighted sum of auto covariance, in which weights are being decided by the kernel and bandwidth parameter.
Page 5 of 15
̃ ̃ (3.2)
The kernel based estimator given as
̂ ∑ ̂ (3.3)
̂ ∑ ̂ ̂
Where is bandwidth parameter (which act as a truncation lag in the covariance weighting), is kernel function which can be estimated in multiple ways listed below. ̂ is Th order auto covariance of residual from equation (3.2).
In the estimation of kernel estimator of spectral density, in this study we consider following kernels.
1. Bartlett Kernel
{ | | | |
2. Parzen Kernel
{
| | | | | | | |
3. Quadratic Spectral Kernel
(
( )
)
4. Tukey-Hanning Kernel
{
| |
Here ( for all kernels. Asymptotically all these kernels are equivalent (Andrews, 1991).
The computational details are given below. Ng and Perron point out that these four tests are equivalent in term of size and power. In whole of our discussion MZa is taken as representative of these four.
4.
Monte Carlo Experiment
Page 6 of 15
Every step of the above mentioned Monte Carlo experiment is summarized as under:
4.1.
Data Generating Process
Following form of data generating process were used to conduct the Monte Carlo experiment:
DGP-I
DGP-II
The DGP-I resembles an ARMA process with intercept but no trend, whereas DGP-II resembles ARMA with drift and trend.
Here t= 1, 2,…,T.
Autoregressive Coefficient
Setting the autoregressive coefficient will generate unit series which could be used to compute the power of Ng-Perron test, whereas setting Rho<1 generates stationary series which can be used to compute power of the test. Following values of Rho were used for the Monte Carlo experiment: is 0.99, 0.98, 0.95, 0.90, 0.85, 0.80 and 0.70
Page 7 of 15
The aim of this study was to evaluate the performance of Ng-perron test both for positive and negative moving average processes. The values of used in experiment were following: 0.80, -0.60, -0.40, -0.20, 0, 0.2, 0.4, 0.6 and 0.8
Calculating Size and Size Distortion
Ng and Perron provide a set of asymptotic critical values for their test. The test statistics calculated on the series generated under the null were compared with these critical values to calculate the actual size of the test. The size distortion is the difference between actual size and nominal level of significance.
Calculating Power and Effective Power
Power of test was computed by applying unit root tests to series generated with a stationary root. The probability of rejection of null is the power of test.
However, for several data generating processes, heavy size distortion was observed. Since it is not reasonable to compare power of two tests with different sizes, we have used effective power of the tests for comparison. The effective power was calculated as follows:
Effective Power for a DGP =Actual Power at Rho<1 - Actual Size for Rho=1
5.
Monte Carlo Results:
This study aims to investigate the performance of Ng-Perron unit root test using Monte Carlo simulations. We will discuss the performance of test by changing DGP’s, moving average coefficient, sample size with AR estimator and KB estimator of spectral density.
As we have cited in literature section 2.2, KB estimators are asymptotically equivalent. We observed in the Monte Carlo experiment that they are equivalent in the small samples as well. Therefore choice of kernels does not affect the performance of Ng-Perron test in the small sample. This is shown in section 4.1. This simplifies our analysis and section 4.2 and 4.3 compares one of these kernels with AR estimator of spectral density.
5.1.
Equivalence of Kernels in KB estimator
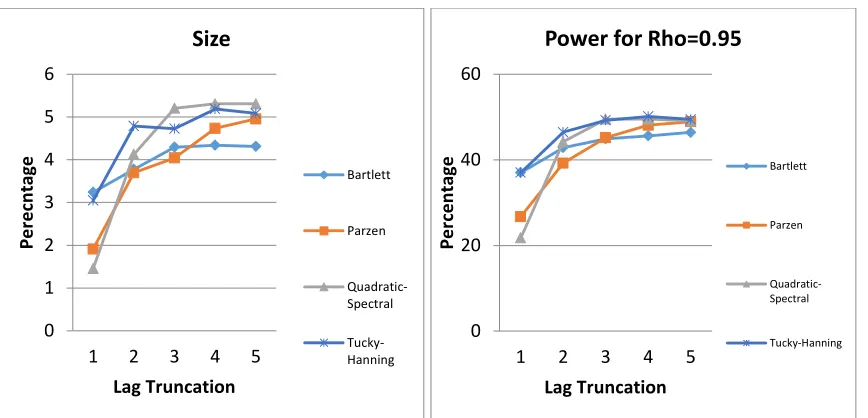
This section illustrates the equivalence of KB estimators. There are four choices of kernels in this study whose computational details are given in section 3. The figures below summarize the size and power of Ng-Perron test for different choice of kernels. The figures show that the power curves remains same of various choices of kernels. The experiment was repeated for a variety of
DGP’s and similar results were obtained. Analysis shows that choice of kernels does not effect
significantly the size and power of test, therefore there is no need of summarizing the simulations for all four kernels. Only one of these kernels will be sufficient to observe the behavior of remaining ones.
Page 8 of 15
Figure # 2: The size and power of MZa when sample size is 80, with DGP-I
In comparison of size and power of test with AR estimator and KB estimator, we use Parzen kernel as representative of these four kernels.
5.2.
Effective Power verse Power
It has been observed that size of the test is not stable. When the size is not stable, power comparison is meaningless. For useful comparison we compare distortion in size and effective power of test. Size distortion is difference between observed size and theoretical size (here 5%) of test, effective power is defined as the difference between empirical power and empirical size of test.
5.3.
Performance of test with DGP-1
Both KB and AR estimator of spectral density estimators are equivalent mathematically at zero lag length/ lag truncation for any data generating process. We discuss the performance of test
0 1 2 3 4 5 6
1 2 3 4 5
Per e cn tage Lag Truncation Size Bartlett Parzen Quadratic-Spectral Tucky-Hanning 0 20 40 60
1 2 3 4 5
Per
ce
n
tage
Lag Truncation
Power for Rho=0.95
Bartlett Parzen Quadratic-Spectral Tucky-Hanning 0 5 10 15 20 25 30 35 40 45
1 2 3 4 5
Per ce n tage Lag Truncation Size Bartlett Parzen Quadratic-Spectral Tucky-Hanning 0 10 20 30 40 50 60 70 80 90
1 2 3 4 5
Per
ce
n
tage
Lag Truncation Power for Rho=0.95
[image:9.612.74.508.68.277.2]Page 9 of 15
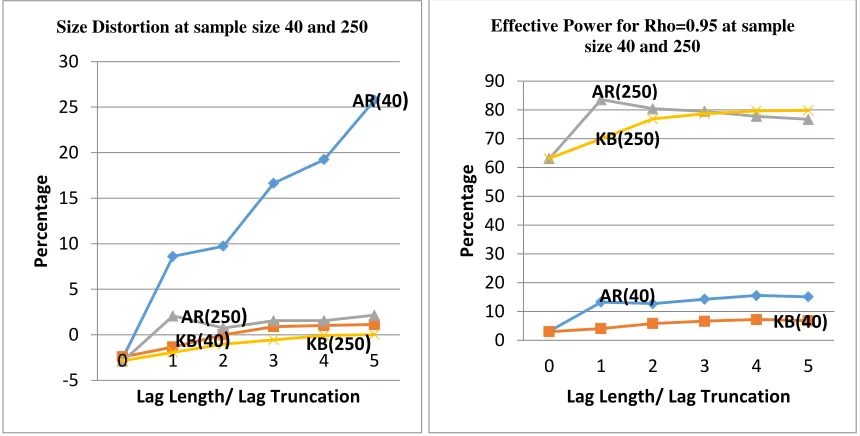
with KB and AR estimators of spectral density at nonzero lag length/ lag truncation. Our result shows that the test has very low effective power in small sample size with both estimators. Figures 3 and 4 depict the size distortion and effective power of test with positive value of moving average coefficient.
Figure # 3: The size distortion and effective power Ng-Perron test with AR and KB estimator when MA=0.2 for DGP-I
Figure # 4: The size distortion and effective power Ng-Perron test with AR and BK estimator when MA=0.6 for DGP-I
From figures above, the distortion in size and effective power of test increases with lag length when we use AR estimator of spectral density, on the other hand, while using KB estimator, effective power of the test improves with large lag truncation without any distortion in the size of test. Therefore it could be deducted that in case of positive moving average KB estimator
-5 0 5 10 15 20 25 30
0 1 2 3 4 5
Per
ce
n
tage
Lag Length/ Lag Truncation
Size Distortion at sample size 40 and 250
AR(40)
KB(40)
AR(250)
KB(250) 0
10 20 30 40 50 60 70 80 90
0 1 2 3 4 5
Per
ce
n
tage
Lag Length/ Lag Truncation
Effective Power for Rho=0.95 at sample size 40 and 250
AR(250) KB(250) AR(40) KB(40) -5 0 5 10 15 20 25 30
0 1 2 3 4 5
Per
ce
n
tage
Lag Length/ Lag Truncation
Size Distortion at sample size 40 and 250
AR(40) AR(250) KB(40) KB(250) 0 10 20 30 40 50 60 70 80 90
0 1 2 3 4 5
Per
ce
n
tage
Lag Length/ Lag Truncation
Effective Power for Rho=0.95 at sample size 40 and 250
AR(40)
KE(40) AR(250)
[image:10.612.72.502.171.389.2] [image:10.612.75.505.433.648.2]Page 10 of 15
outperform the AR estimator. The experiment with different values of MA and autoregressive parameters, the behavior of effective power and distortion remains similar.
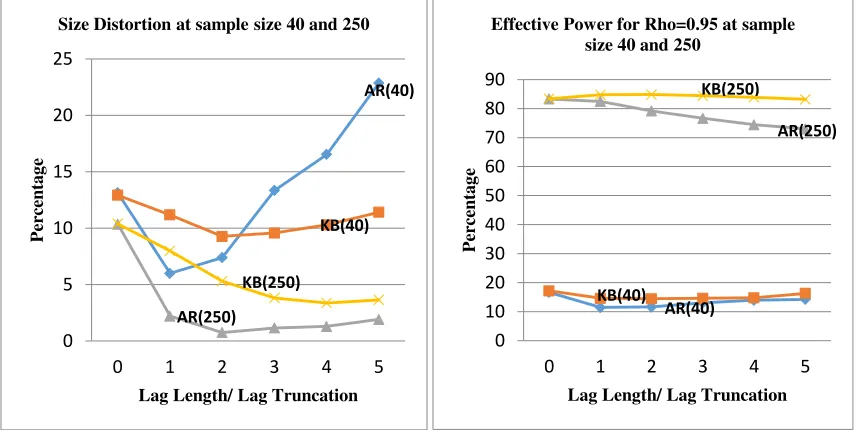
Different picture emerge when we have negative moving average in the data generating process. Lag length selection has significant consequences on the performance of the test with AR estimator. From figure 5 & 6, we observed that for weaker negative moving average structure, the performance of test was similar with both estimators of SD.in large samples. As negative moving average structure become stronger, distortion is high when using the effective power shows non-monotonic behavior and start decreasing KB estimator regardless of the choice of truncation lag and sample size. On the other hand, the size distortion with AR estimator is smaller and reduces to zero when lag length is 5. The effective power shows non-monotonic behavior and start decreasing after it reaches its maximum value. Effect power is maximized when the lag length/ lag truncation is 2 and start decreasing at higher lag.
Figure # 5: The size distortion and effective power Ng-Perron test with AR and KB estimator when MA=-0.20 for DGP-I
Figure # 6: The size distortion and effective power Ng-Perron test with autoregressive estimator and kernel based estimator when MA=-0.60 for DGP-I
0 5 10 15 20 25
0 1 2 3 4 5
Per
ce
n
ta
g
e
Lag Length/ Lag Truncation Size Distortion at sample size 40 and 250
AR(40)
AR(250) KB(250)
KB(40)
0 10 20 30 40 50 60 70 80 90
0 1 2 3 4 5
Per
ce
n
ta
g
e
Lag Length/ Lag Truncation Effective Power for Rho=0.95 at sample
size 40 and 250
AR(40)
AR(250)
KB(40)
[image:11.612.73.502.289.504.2]Page 11 of 15
5.4.
Performance of test with DGP-II
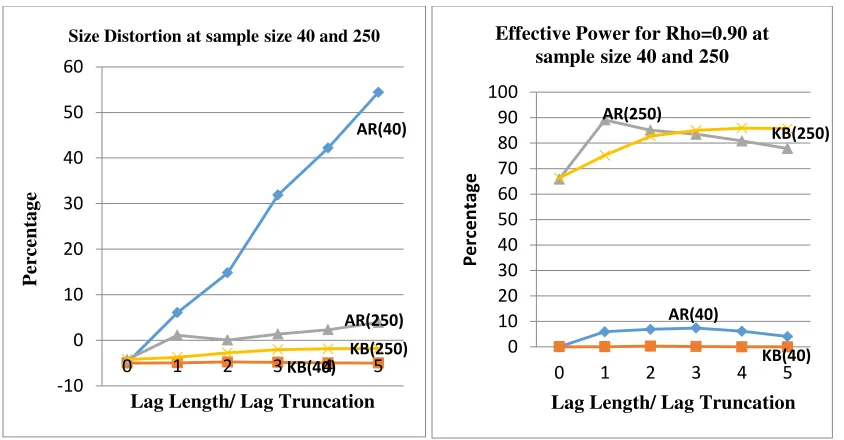
In this part of discussion we discuss the effective power and size distortion when data generating process consists of drift as well as time trend. Figure 7 and 8, given below depict that the performance of test when we have positive moving average structure in DGP. Like the results for DGP-I we observed that KB estimator is better choice for Ng-Perron test when there is positive moving average in DGP with nonzero lag truncations. The size distortion of test is very small with KB estimator even in small samples. On the other hand, AR estimator gives huge size distortion for the small sample sizes which could be as high as 60% in some cases. The effective power of the two estimators as shown in right panel of figure 7 is same for the smaller as well as for large sample size. Therefore the estimator with smaller size distortion should be preferred. Thus KB estimator is preferred if there is positive moving average. This conclusion matches with what we conclude for DGP-I. in size is high with AR estimator with deterministic part consists both drift and time trend at the same time.
Figure # 7: The size distortion and effective power Ng-Perron test with AR and BK estimator when MA=0.2 for DGP-II
0 10 20 30 40 50 60 70 80
0 1 2 3 4 5
P
er
ce
nta
g
e
Lag Length/ Lag Truncation Size Distortion at sample size 40 and 250
AR(40)
AR(250) KB(250)
KB(40)
0 10 20 30 40 50 60 70 80
0 1 2 3 4 5
P
er
ce
nta
g
e
Lag Length/ Lag Truncation Effective Power for Rho=0.95 at
sample size 40 and 250
AR(40) AR(250)
[image:12.612.72.502.69.309.2]Page 12 of 15
Figure # 8: The size distortion and effective power Ng-Perron test with AR and BK estimator when MA=0.6 for DGP-II
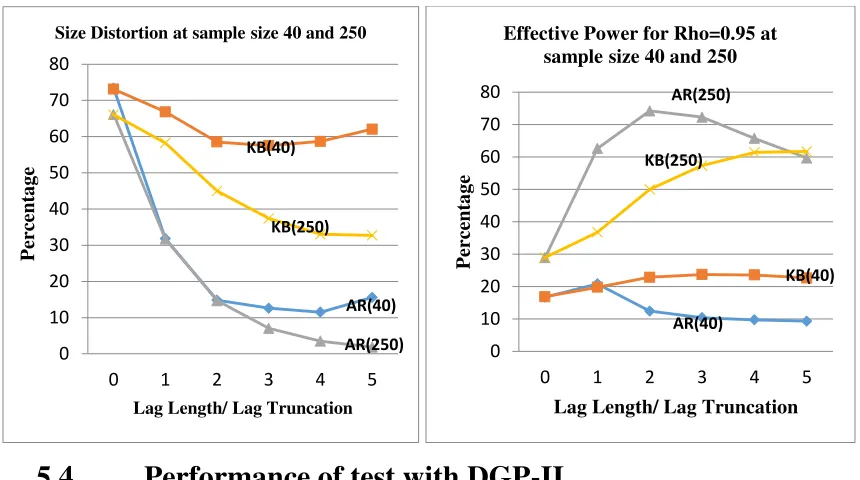
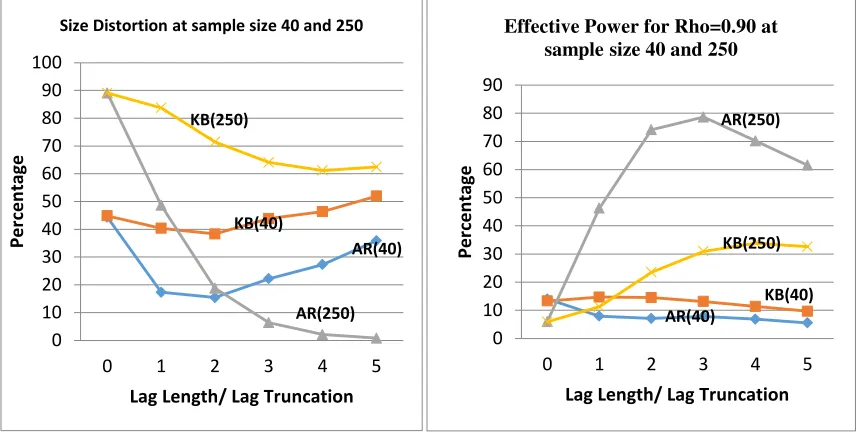
Figure 9 and 10 shows the distortion in size and effective power of test for AR and KB estimators at different lag length/ lag truncations. The Monte Carle experiment results are similar to DGP-1 for negative moving average. In large sample, with strong negative moving average structure, size distortion is very high with both estimators at zero lag length/ lag truncation. There is sharp decrease in the size distortion and approaches to zero at lag 5 for AR estimator with effective power nearly 77%. On the other hand test with KB estimator has very low effective power i.e. maximum 35% power and distortion in size is well above 40% for any size of sample in the presence of strong negative moving average.
Figure # 9: The size distortion and effective power Ng-Perron test with AR and BK estimator when MA=-0.2 for DGP-II
-10 0 10 20 30 40 50 60
0 1 2 3 4 5
P er ce nta g e
Lag Length/ Lag Truncation
Size Distortion at sample size 40 and 250
AR(40)
AR(250)
KB(40)
KB(250) 0
10 20 30 40 50 60 70 80 90 100
0 1 2 3 4 5
Per
ce
n
tage
Lag Length/ Lag Truncation Effective Power for Rho=0.90 at
sample size 40 and 250
AR(40) AR(250) KB(40) KB(250) -10 0 10 20 30 40 50 60 70
0 1 2 3 4 5
Per
ce
n
tage
Lag Length/ Lag Truncation
Size Distortion at sample size 40 and 250
AR(40)
AR(250)
KB(40)
KB(250) 0 10 20 30 40 50 60 70 80 90
0 1 2 3 4 5
P er ce nta g e
Lag Length/ Lag Truncation
Effective Power for Rho=0.90 at sample size 40 and 250
AR(40) AR(250)
KB(250)
[image:13.612.72.494.69.289.2] [image:13.612.74.494.331.548.2]Page 13 of 15
[image:14.612.72.499.69.289.2]Figure # 10: The size distortion and effective power Ng-Perron test with AR and BK estimator when MA=-0.6 for DGP-II
Figure 9 and 10 shows that Monte Carlo the results obtained for negative moving average also support our previous finding that AR estimator is better option in the presence of negative moving average.
From above discussion on Monte Carlo results of Ng-Perron test, we come to the conclusion that nature of moving average is important in the selection of estimator of spectral density estimator. Wrong selection of estimator may lead to wrong inference about existence of unit root.
6.
Summary and Conclusion
-10 0 10 20 30 40 50 60
0 1 2 3 4 5
Per
ce
n
tage
Lag Length/ Lag Truncation
Size Distortion at sample size 40 and 250
AR(40)
KB(40)
AR(250) KB(250) 0
20 40 60 80 100
0 1 2 3 4 5
Per
ce
n
tage
Lag Length/ Lag Truncation Effective Power for Rho=0.90 at
sample size 40 and 250
AR(40) AR(250) KB(40) KB(250) 0 10 20 30 40 50 60 70 80 90 100
0 1 2 3 4 5
Per
ce
n
tage
Lag Length/ Lag Truncation
Size Distortion at sample size 40 and 250
AR(40) AR(250) KB(250) KB(40) 0 10 20 30 40 50 60 70 80 90
0 1 2 3 4 5
Per
ce
n
tage
Lag Length/ Lag Truncation
Effective Power for Rho=0.90 at sample size 40 and 250
AR(40) AR(250)
KB(250)
[image:14.612.73.504.331.548.2]Page 14 of 15
In this research we have evaluated the performance of Ng-Perron test for following choice of spectral density estimators
1. Autoregressive estimator 2. Kernel based estimator with
a. Bartlett Kernel b. Parzen Kernel
c. Quadratic Spectral Kernel d. Tukey-Hanning Kernel
The simulation experiment was done on variety of DGP’s and for wide range of parameters
values. The simulation results reveal that the kernel based estimator with different kernel give similar size and power even in small samples. Thus we come up with conclusion that choice of kernel does not make any difference.
Page 15 of 15
7.
References
Andrews, D. W. (1991). Heteroskedasticity and autocorrelation consistent covariance matrix estimation.
Econometrica, 59(3), 817-858.
Atiq-ur-Rehman. (2011). Impact of Model Specification Decisions on Performance of Unit Root Tests.
International Econometric Review, 3(2), 22-33.
Dufour, J. M., & King, M. L. (1991). Optimal invariant tests for the autocorrelation coefficient in linear regressions with stationary or nonstationary AR (1) errors. Journal of Econometrics, 47(1), 115-143.
Elliott, G., Rothenberg, T. J., & Stock, J. H. (1996). Efficient Tests for an Autoregressive Unit Root.
Econometrica, 64(4), 813-836.
Libanio, G. A. (2005). Unit roots in macroeconomic time series: theory, implications, and evidence. Nova Economia Belo Horizonte, 15(3), 145-176.
Ng, S., & Perron, P. (2001). Lag length selection and the construction of unit root tests with good size and power. Econometrica, 69(6), 1519-1554.
Phillips, P. C. (1987). Time series regression with a unit root. Econometrica, 55(2), 277-301.
Phillips, P. C., & Perron, P. (1988). Testing for a unit root in time series regression. Biometrika, 75(2), 335-346.