ISSN Online: 2327-5901 ISSN Print: 2327-588X
Analysis of the Behavior of
a Turbomachine Driven by a
Compressed Air System
Miguel Toledo-Velázquez
1*, Raúl Cruz-Vicencio
2, Juan Abugaber-Francis
1,
Juan Carlos Anzelmetti-Zaragoza
21Instituto Politécnico Nacional, Escuela Superior de Ingeniería Mecánica y Eléctrica, Sección de Estudios de Posgrado e
Investigación, Laboratorio de Ingeniería Térmica e Hidráulica Aplicada (LABINTHAP), Unidad Profesional “Adolfo López Mateos”, Ciudad de México, México
2Universidad Veracruzana, Escuela de Ingeniería Mecánica y Eléctrica, Unidad Poza Rica-Tuxpan, Veracruz, México
Abstract
Different experiments in high speed turbomachines require expensive and sophisticated infrastructure to implement their impulsion and reach high re-gimes. In developed countries, this can be achieved by using aeroderivative gas turbines or DC motors of about 400 HP. This paper presents an experi-mental system designed and built with the intention of performing behavior studies in test turbomachinery. The proposed installation uses compressed air as driving fluid, which allows the turbomachinery to reach high rotational speeds where very important phenomena occur. An analysis is carried out considering the rotational speed behavior of an internal combustion engine turbocharger of the Perkins series when it is driven by pressures ranging from 4.2 kg/cm2 to zero. Additionally, another experiment couples an automotive electrical generator with the turbine to observe the system operation when a load is applied. The behavior of the pressure is analyzed when it is in function of the time of air discharge that goes from a compressed air storage tank to the turbocharger for its impulsion. This is an experimental system that can be designed and constructed economically within the bounds of any public uni-versity.
Keywords
Turbomachinery, Compressed air, Turbocharger, Vorticity
1. Introduction
When centrifugal compressors or high speed turbomachines are investigated, it How to cite this paper: Toledo-Velázquez,
M., Cruz-Vicencio, R., Abugaber-Francis, J. and Anzelmetti-Zaragoza, J.C. (2017) Analysis of the Behavior of a Turboma-chine Driven by a Compressed Air System. Journal of Power and Energy Engineering, 5, 1-13.
https://doi.org/10.4236/jpee.2017.55001
Received: April 6, 2017 Accepted: May 21, 2017 Published: May 25, 2017
Copyright © 2017 by authors and Scientific Research Publishing Inc. This work is licensed under the Creative Commons Attribution International License (CC BY 4.0).
is necessary to reach an appropriate range of operation to better understand the phenomena that take place at these regimes. One major problem is to have an adequate equipment to drive the turbomachines to such high rotational speeds. In developed countries, part of the research and development spending is in-tended for advanced and expensive infrastructure acquisition to carry out this type of experimentation.
The interest of experimenting with high speeds in turbomachinery is impor-tant because they work in normal operation and obtain their maximum efficien-cies at these velocities [1].
Some papers such as [2] have studied the rotating stall and vibrations at high speeds. Here, experimental facility was used to analyze the vibrations of a cen-trifugal compressor which was driven by a DC motor between zero and 17,000 rpm. To determine the operation curve of an experimental compressor, Arnulfi et al. [3] used a 400 HP electric motor coupled with a speed-increaser gearbox to impulse the compressor. In [4], the driving was performed similarly but with a 500 kW engine. To analyze the vorticity phenomenon, Ellis [5] applied an expe-rimental facility using a 15 HP motor controlled by a set of pulleys regulating its speed; however, the experiment was performed at relatively low speeds between 1800 and 4000 rpm.
In general, the most mentioned methods in the literature are the impulsion though DC motors using powerful speed-increaser gearboxes and the method of aero derivative gas turbines.
This paper proposes a method to drive turbomachinery by using compressed air, highly ecological and that can be built with common mechanical elements of low cost. The propulsion system is under development and is used to analyze the behavior of a turbocharger based on the rotational speed and the flow through the turbine.
The paper is organized as follows: Section 2 includes the experimental infra-structure; Section 3 discusses the experimental method; Section 4 presents the mathematical model needed to perform the experiments; Section 5 gives an analysis of results; and Section 6 makes conclusions.
2. Experimental Infrastructure
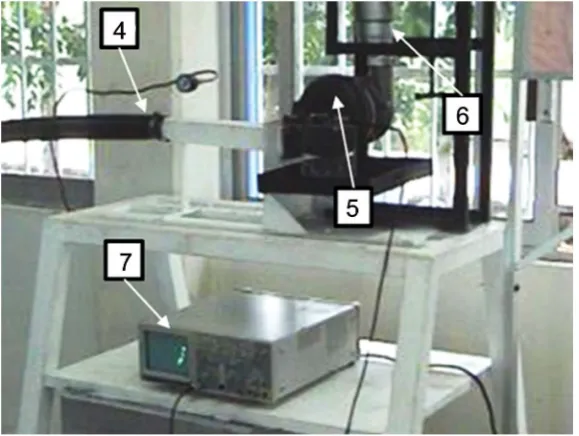
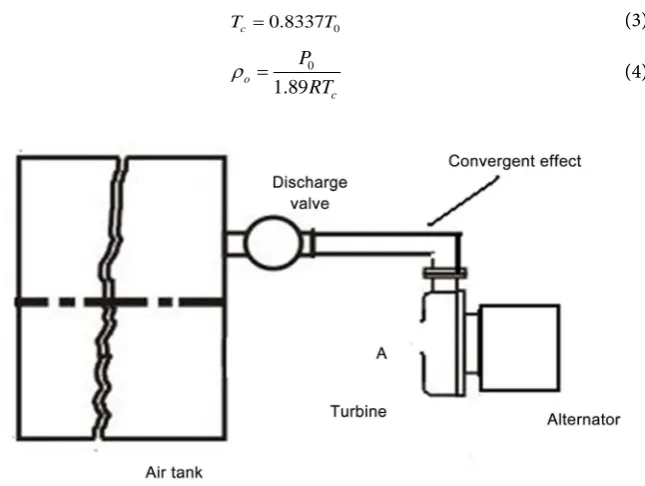
The experimental system consists of two main parts: the compressed air supply system (Figure 1) and the turbomachine experimental test bed (Figure 2). The proposed compressed air system is described in more detail in [6] [7] and is a base infrastructure for other research projects.
3. Experimental Method
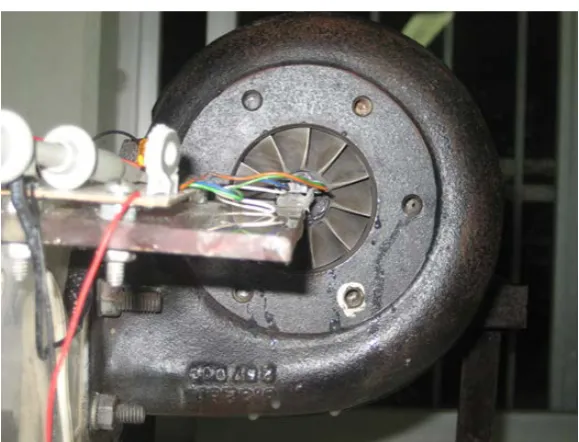
As mentioned before, an analysis is performed considering the behavior of the rotational speed of an internal combustion engine turbocharger of the Perkins series (Figures 3-5) when it is impelled by pressures going from 4.2 kg/cm2 to 0. These pressures are possible due to the compressed air stored in a receiver tank
[8] [9]. Figure 6 illustrates the experimental installation.
[image:3.595.229.518.238.467.2]The electric motor drives the compressor compressed air to a pressure of 4.2 kg/cm2. Then, the valve is opened to let the air impulse the turbocharger gradu-ally through subsonic flow velocities which are measured by an electronic circuit based on an optoelectronic sensor as shown in Figure 7.
Figure 1. Compressed air supply system.
[image:3.595.230.520.498.716.2]Figure 3. Turbocharger installed.
Figure 4. Example of a simulated turbocharger.
[image:4.595.245.503.514.718.2]Figure 6. Experimental installation.
Figure 7. Electronic circuit for detecting rotational speeds.
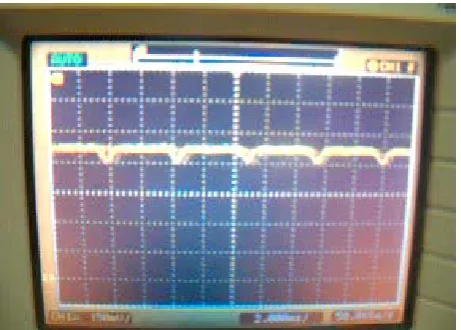
The electronic signal is detected and sent to an oscilloscope (Figure 8) which is used to measure the period and the frequency and determine the rpm of the turbomachine.
From repeated experiments, different velocities are obtained as a function of the time of air discharge from the tank. Figure 9 illustrates this behavior.
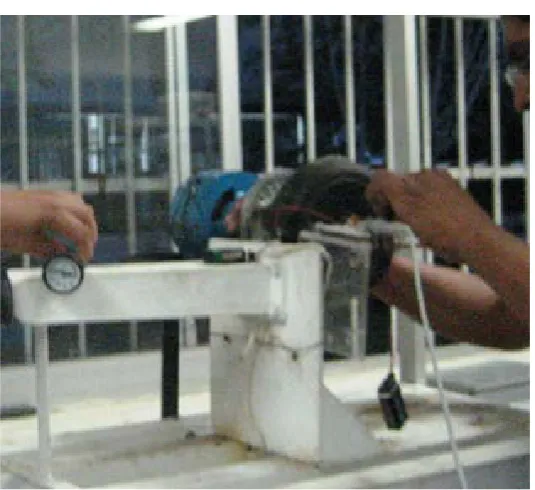
[image:5.595.229.519.315.536.2]Some tests are carried out analyzing the gauge pressure behavior in the tank when it is function of the time of discharge (Figure 11).
4. Mathematical Model
[image:6.595.260.491.297.462.2]After obtaining the experimental installation operation, the theory of gas dy-namics is applied to analyze this behavior [10]. To simplify the analysis it is as-sumed that the storage tank discharge process is an isentropic process from a gauge pressure of 3.2 kg/cm2 to atmospheric pressure. Therefore this process can be compared to the same that occurs in an isentropic flow through a convergent reduction as can be illustrated in Figure 12. In this figure, the turbine air dis-charge A is at atmospheric conditions, thus it is feasible to simulate the pipe and the turbine by a length equivalent to a convergent nozzle with cross-section A. This assumption is made in order to obtain the flow behavior in the discharge period through the turbine when the compressor replaced by generator.
Figure 8. Signal obtained from the electronic circuit.
[image:6.595.241.502.498.713.2]Figure 10. Generator coupled to the turbine.
Figure 11. Pressure behavior when load is applied.
Let us consider Po, To, ρo, the absolute pressure, the temperature and density corresponding to the air tank and P, T, ρ the corresponding magnitudes in the equivalent convergent nozzle that replaces turbine and the pipe in the experi-ment system. The flow phenomenon is described as:
1 2 1 1
2 o
p p M
γ γ
γ
− −
= −
[image:7.595.220.528.343.597.2]where po is the pressure in the tank, p is the pressure in the nozzle, M is the Mach number of the flow and γ the ratio of specific heats (in this case air with value of 1.4). Considering that for a sonic flow M = 1 and Equation (1), we have:
1.89
o
P p = (2)
Equation (2) is the critical pressure ratio. When this ratio is greater than or equal to 1.89, then the flow is sonic and is calculated using the critical magni-tudes Tc and ρc. The present study was performed in the city of Poza Rica, Vera-cruz with an atmospheric pressure of 100 kPa and a temperature of 30˚C. From Equation (2), it is deduced that the flow reaches the speed of sound for tank pressures higher than189 kPa. In this case, the measured superior pressure is 420 kPa, thus the flow reaches the speed of sound in the range of 420 - 189 kPa. Less than 189 kPa, the flow is subsonic and is calculated differently.
[image:8.595.214.537.344.587.2]The next step is to calculate the mass flow for sonic and subsonic intervals. During the experiment, the tank temperature To is considered to be always con-stant with value of 30˚C, the ratio of specific heats γ = 1.4 and R = 287 J/kg K.
Table 1 presents the values corresponding to mass flow obtained in the sonic flow range between 0 and 4 seconds that is the time interval in which flow moves at the speed of sound. To form the table, the following equations are used:
0 0.8337
c
T = T (3)
0 1.89 o
c
P RT
ρ = (4)
[image:8.595.209.542.639.733.2]Figure 12. Storage tank discharge through a convergent pipe.
Table 1. Mass flow for the sonic interval.
Tiempo (s) P0 (kPa) Po/p Tc (K) ρc (kg/m3) a = v (m/s) Flow (kg/s)
0 420 4.2 252.6 3.06 318.5 0.39
1 300 3.2 252.6 2.19 318.5 0.28
2 250 2.5 252.6 1.82 318.5 0.23
3 230 2.3 252.6 1.67 318.5 0.21
c
a= γRT (5)
c
[image:9.595.316.538.176.289.2]m =aρ A (6)
Table 2 shows the values of mass flow obtained for the range between 5 and 7 seconds that is the time interval in which flow moves at the subsonic speed. This behavior is verified at pressures lower than 186 kPa.
The following equations are used to form the table: 0.2857 0 0 P T T P =
(7)
P RT
ρ= (8)
c
a= γRT (9)
0.2857 0
2.236 P 1
v a
P
= −
(10) The effective area A is considered to be 4 cm2 and is an approximation to the area over which the air makes contact with the turbine inlet. In Figure 13, the mass flow is plotted against the time of air discharge shown in Table 1 and Ta-ble 2. Figure 14 illustrates the sudden change of behavior when there is a transi-tion of flow regime from sonic to subsonic in the range between 4 and 5 seconds after the tank discharge.
If the tank volume V0 is used as control volume, the equation of state can be applied as: 0 0 m P RT V
= (11)
The derivative of Equation (11) results in a function of the mass flow:
0 0 d d d d RT P m
t t V
=
(12)
Using the corresponding constant values and Vo = 0.34 m3, we obtain: d
d d
d 255767
P
m t
t = (13)
To calculate dP/dt at each point of Figure 11, numerical methods based on fi-nite differences are used. Table 3 shows there results.
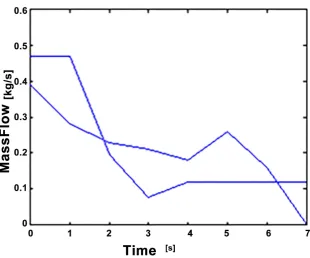
[image:9.595.206.542.660.731.2]The behavior of the mass flow can be obtained in the same manner for the second method. Figure 15 shows the comparison of both results for the mass flow using the procedures mentioned.
Table 2. Mass flow for the subsonic interval.
Tiempo
(s) (Kpa) P0 Po/p (K) T (kg/mρ 3) (m/s) v (kg/s) Flujo
5 170 1.7 260.3 2.27 292.5 0.26
6 140 1.4 275 1.77 235 0.16
Figure 13. Behavior of the mass flow.
[image:10.595.227.518.250.541.2]Figure 14. Behavior of the mass flow using the volume control located in the tank.
Table 3. Mass flow behavior using the control volume located in the tank.
Tiempo (s) dP/dt dm/dt
0 120000 0.47
1 120000 0.47
2 50000 0.195
3 20000 0.078
4 30000 0.12
5 30000 0.12
6 30000 0.12
[image:10.595.208.537.601.739.2]Figure 15. Comparison between the two analyzes.
This comparison suggests the use of an estimated behavior which is defined by the graph that lies between the two curves obtained mathematically. Opting for an average of these two graphs which perhaps will respond in a more consis-tent manner for the actual mass flow and take into account the effects of fluid compressibility induced in both subsonic and sonic regimes.
5. Analysis of Results
The first experiment that used the turbocharger Perkins, showed its transient behavior defined by Figure 9. According to the figure, it is possible to reach speeds relatively high, which are necessary to implement an appropriate analysis in high speed turbomachinery. As can be seen, there exist a convenient regime between 42,000 and 60,000 rpm. In this case, this interval speed behavior can be used when studies of its centrifugal compressor are required. In order to obtain larger time intervals and higher speeds, it is necessary to increase the tank pres-sure and adapt regulators to maintain the compressor speed constant and con-duct an adequate characterization.
The second experiment replaced the centrifugal compressor from the turbo-charger and an automotive electric generator was coupled to the turbine instead. Its discharge pressure behavior curve was shown in Figure 11. Analyzing the mass flow, using the compressed air tank contour as control volume and consi-dering Equation 12, it is visible that the transient behavior of pressure is propor-tional to the behavior of the instantaneous flow mass and if discontinuities in the transient mass flow are not considered, then it is proportional to the slope of the tangent at each point from Figure 11, obtaining a behavior as Figure 14.
consi-dered, the flow behavior with respect to time has a different tendency caused by the transition effect from supersonic to subsonic flow in the discharge period of the deposit.
It can be inferred from this result that there is a range of operation for the turbomachinery, limited by the two curves shown in Figure 15. There is evi-dence that the behavior obtained is plausible under these conditions. In a future experiment, the hypothesis can be checked by using adequate instrumentation in order to limit the enunciation of the results.
6. Conclusions
According to the results we can obtain the following conclusions:
• Using the experimental setup based on a system of compressed air supply
and the experimental test-bed described in this paper, it is possible to carry out tests in high speed rotating turbomachinery.
• In the case of the turbocharger Perkins that was used in this experiment, it is
possible to work with speeds between 15,000 and 60,000 rpm. Also, it is possible to obtain the compressor performance curves, as long as the ade-quate instrumentation is available.
• According to the proposed mathematical analysis in this work, a gap of
oper-ation for the instantaneous mass flow is deduced in the range of the experi-mental time.
• One proposal is to obtain an average curve between the two shown in Figure
15, defining the behavior of the given mass flow of fluid compressibility ef-fects and shockwaves.
• This experimental equipment can be configured to perform studies in
cen-trifugal compressors.
• Usually the drive systems for high speed turbomachinery are expensive; how-
ever, the system presented in this work can be built at low cost, with a budget within the bounds of any public university.
Acknowledgements
This work was carried out with the support of the University of Veracruz and the National Polytechnic Institute of Mexico.
References
[1] Rodgers, C. (1964) Typical Performance Characteristics of Gas Turbine Radial Compressors. Journal of Engineering for Power, 86, 161-170.
[2] Bently, D.E. and Goldman, P. (2000) Vibrational Diagnostics of Rotating Stall in Centrifugal Compressors. ORBIT, 21, 46-50.
[3] Arnulfi, G.L., Giannattasio, P., Giusto, C., Massardo, A.F., Micheli, D. and Pina-monti, P. (1999) Multistage Centrifugal Compressor Surge Analysis: Part I-Experimental Investigation. Journal of Turbomachinery, 121, 305-311.
https://doi.org/10.1115/1.2841315
Geome-try. Journal of Turbomachinery, 121, 763-771.https://doi.org/10.1115/1.2836730 [5] Ellis, G.O. (1964) A Study of Induced Vorticity in Centrifugal Compressors. ASME
Journal of Engineering for Power, 86, 63-76.https://doi.org/10.1115/1.3675420 [6] Juárez, J., Martínez, M. and Zarate, R. (2004) Diseño y construcción de banco
experimental de pruebas para la determinación del comportamiento de un compresor centrífugo. Undergraduate Thesis, University of Veracruz, Veracruz. [7] Cruz, R. (1998) Análisis Teórico y Numérico del Flujo en el Impulsor de
Compresores Centrífugos. Master’s Thesis, National Polytechnic Institute, Ciudad de México.
[8] Goldstein, A.W. (1948) Design and Performance of Experimental Axial-Discharge Mixed-Flow Compressor: I-Impeller Design Theory. NACA-RM-E8F04.
[9] Came, P.M. (1978) The Development, Application and Experimental Evaluation of a Design Procedure for Centrifugal Compressors. Proceedings of the Institution of Mechanical Engineers, 192, 49-67.
https://doi.org/10.1243/PIME_PROC_1978_192_007_02
[10] Toledo, M. and Cruz, R. (2003) Polytropic Analysis of a Centrifugal Compressor. Información Tecnológica, 14, 9-14.
Submit or recommend next manuscript to SCIRP and we will provide best service for you:
Accepting pre-submission inquiries through Email, Facebook, LinkedIn, Twitter, etc. A wide selection of journals (inclusive of 9 subjects, more than 200 journals)
Providing 24-hour high-quality service User-friendly online submission system Fair and swift peer-review system
Efficient typesetting and proofreading procedure
Display of the result of downloads and visits, as well as the number of cited articles Maximum dissemination of your research work