http://www.scirp.org/journal/chnstd ISSN Online: 2168-541X
ISSN Print: 2168-5428
China and South Asia Trade Competition and
Complementary: Analysis Based on the
Background of “One Belt and One Road”
Si Xu
College of Economics, Jinan University, Guangzhou, China
Abstract
The Chinese government continued implementation of the strategy of “The Belt and Road”. The strategy has brought new opportunities for China and South Asia economic and trade cooperation. According to the “UN” UN- COMTRADE database, measuring the trade of China and South Asia of each index, revealed comparative advantage index, export similarity index, the spe-cialization of the revised coefficient and coefficient of consistent indices, ana- lysis competitive and complementary of China and south Asian countries trade. Results show that the trade structure of China and South Asia has a certain competitiveness, but also has a lot of complementarity. There are lots of varie-ties for trade. Chinese exports to South Asia have a wide range of categories, export manufactured goods are the main products. South Asian exports to China are the low value-added primary products and semi-finished products mainly. Under the background of the strategy of “The Belt and Road”, policy measures should be taken to promote China’s economic and trade relations with south Asian countries.
Keywords
The Belt and Road, Trade Competitiveness, Trade Complementarity, China and South Asia
1. Introduction
Since the second half of 2013, Chinese President Xi Jinping first put forward to the strategic conception of the Silk Road economic belt and the 21st century Ma-ritime Silk Road to the international community, to show the world a grand blueprint of “One Belt And One Road”. The strategic conception has got a posi-tive response by more than 60 countries and regions around the world, includ-How to cite this paper: Xu, S. (2017).
China and South Asia Trade Competition and Complementary: Analysis Based on the Background of “One Belt and One Road”. Chinese Studies, 6, 108-122.
https://doi.org/10.4236/chnstd.2017.62010
Received: March 28, 2017 Accepted: May 20, 2017 Published: May 23, 2017
Copyright © 2017 by author and Scientific Research Publishing Inc. This work is licensed under the Creative Commons Attribution International License (CC BY 4.0).
http://creativecommons.org/licenses/by/4.0/
ing South Asia, India, Pakistan, Sri Lanka, Bangladesh, Afghanistan, Nepal, Bhutan. Because for China, almost 80% of oil and 50% natural gas and nearly half of all trade goods should be transported through the Indian Ocean, the In-dian Ocean has played a important role in ensuring the channel security and economic interests, therefore it has made a contribution to making South Asia to become the critical part of “One Belt And One Road” strategic.
Historically, Indian is at the most important meeting point of the north Silk Route, the South Silk Route and Maritime Silk Road. As the important emerging powers, Indian becomes an unavoidable presence during the implementation of “One Belt And One Road” strategy. Of course, the implementation of the strate-gy is conducive to the long-term interests of India. Now India is one of founding members of the Asian investment bank, and it actively joins the construction of Bangladesh-China-India-Myanmar (BCIM) Economic Corridor. China and Pa-kistan are all-weather strategic partners. The bilateral ties have withstood the tests of time and the fluctuations of international situation.
Pakistan supports the Chinese government’s policy, it is the main entrance for China to enter the Indian Ocean, the Arabian Sea and the Persian Gulf and other regions, and its special geographical position could be an important fulcrum to connect the “Silk Road Economic Belt” with “21st century Maritime Silk Road”. China Pakistan economic corridor is the “flagship projects” of “One Belt And One Road”, it impacts the smooth implementation of “One Belt And One Road” directly, so the importance of Pakistan to “One Belt And One Road” cannot be overstated. Sri Lanka has a good location, especially has a significant strategic position in South Asia. It is a key hub of sea communications. Its advantage in transport, transit, supply and other aspects is obvious. Bangladesh is located at the intersection of China, India and ASEAN, as the bond of multilateral cooper-ation, it is expected to become an important commercial hub of regional coop-eration depending on excellent geographical location. Thus, South Asia has a vi-tal strategic significance in the smooth implementation of “One Belt And One Road”.
14 emerging countries to search the cooperation potential. Han Yonghui & Zou Jianhua (2014) analyzed the present trade condition and cooperation prospect of China and West Asia under the background of “One Belt And One Road” Initia-tive. Han Yonghui et al. (2015) studied the trade competitiveness and comple-mentarity of China and West Asia under the background of Silk Road Ecomomic Belt and Maritime Silk Road Strategy. Sang Baichuan & Yang Lizhuo (2015) stu-died China’s trading relations with the countries of “One Belt And One Road” by research of trade competitiveness and trade complementarities. Du Xiuhong (2015) made an analysis on trade structure of China and India in the context of “One Belt And One Road” Initiative. Liao Mingzhong (2015) evaluated the trade potential of China to “One Belt And One Road” countries by using gravity model. But there is no literature to study about present trade condition of China and the South Asia under the background of “One Belt And One Road”. Based on this, this paper takes use of quantitative research methods to make an empirical analysis about trade competitiveness and complementation of China and South Asia, in order to study current situation and trade potential of China and South Asia, to provide theoretical foundation for strengthening trade cooperation be-tween China and South Asia.
2. Trade Situation of China and South Asia
The economic development of South Asia is unbalanced. Among them, India, Pakistan and Sri Lanka in general are experiencing a high-speed economic de-velopment in recent years. Especially India has outstanding performance, the national economy grows rapidly and national strength has been greatly en-hanced, so India’s influence in region and the whole world is strengthening. Pa-kistan has been completed the task of economic restructuring in principle and has established a relatively complete economic system initially, its economic growth is gradually accelerating. Sri Lanka has established the industrial system basically, the national economy has achieved good results with a goal-oriented task. While Bangladesh and Nepal’s economy was unsatisfactory due to domestic political instability. It is obvious that political uncertainty has a negative impact on economic development. The unbalanced economic development also reflects in the bilateral trade between China and South Asia. In 2014, total trade between China and South Asia reached $106.02 billion, up 10.1% year on year. Among them, the total imports reached $20.19 billion, down 3.9%, the total exports reached $85.83 billion, up 14.1%.
having been an increase of 20.23%. To the end of 2014, China had became the second-largest export trading nation for Pakistan, second only to United States, China is Pakistan’s largest source of imports. Sri Lanka’s exports to China reached $170 million, up 42.9% year on year, accounting for 1.6% of Sri Lanka’s total exports; Sri Lanka’s imports from China reached $3.45 billion, up 16.6% year-on-year, accounting for 17.9% of Sri Lanka’s total imports. Until the end of 2014, China had became the second largest source of imports for Sri Lanka, next to India. China’s trade volume with Bangladesh had been growing rapidly, in 2014, bilateral trade reached $12.547 billion, having been an increase of 21.98%, Bangladesh has become third-largest trading partner for China in South Asia. In recent years, the trade between China and Nepal has developed rapidly. Nepal has become an important channel for China entering the Southeast Asian mar-ket. In 2014, bilateral trade reached $2.33 billion, China’s exports to Nepalreached $2.28 billion, Nepal’s imports from China reached $46.07 million. The trade be-tween China and Afghanistan, Maldives, Bhutan is at a very low level generally.
Current research about trade status between countries or regions usually fo-cuses on trade competitiveness and complementarity, this paper also stduytrade situation and potential of China and South Asia from this perspective. Tradi-tional research about the trade competition and complementarity is based on Revealed Comparative Aadvantage Index. RCA index is put forward by American economist Balassa (1965, 1989) and has been widely applied. According to the in-dex, a lot of academic research is carried on. Many indexes are introduced to study trade competition and complementarity. This text establishs the index system to measure the trade competition and complementarity of China and South Asia. Related indicators include Trade Integration Index, Revealed Comparative Aad-vantage Index, Export Similarity Index, amended Specialization Coefficient and Consistency Coefficient. These indexes are very classical for trade stduy.
Confined to limit data, this paper takes India, Pakistan, Sri Lankaas research objects. India and Pakistan are two major countries in South Asia, their trade volume with China was about 90% of total bilateral trade between China and South Asia. So they are representative. While Sri Lanka is the first country to support China’s “21st Century Maritime Silk Road” Initiative officially. Some South Asian countries’ bilateral trade with China are weak, such as Bhutan, Nepal, Afghanistan, Sri Lanka. Trade share is small comparatively. There is short of data about Bangladesh.
(machinery and transport equipment). The third class is labor-intensive prod-ucts, including SITC6 (manufactured goods classified by raw materials) and SITC8 (miscellaneous manufactured articles). There is last class named SITC9 (other unclassified finished products).
3. The Analysis about Trade Complementarity of China and
South Asia
1) Revealed Comparative Advantage Index (RCA)
RCA (Revealed Comparative Advantage Index) is an index used in interna-tional economics for calculating the relative advantage or disadvantage of a cer-tain country in a cercer-tain class of goods or services as evidenced by trade flows. It is based on the Ricardian comparative advantage concept. The formula is as fol- low, RCA
i
a a
i
w w
X X X X
= That is, the RCA is equal to the proportion of the coun-
try’s exports that are of the class under consideration divided by the proportion of world exports that are of that class. A comparative advantage is “revealed” if RCA > 1. If RCA is less than unity, the country is said to have a comparative disadvantage in the commodity or industry.
It’s generally believed that if RCA index is more than 2.5, indicating that the in-dustry has a very strong international competitiveness in this country; if RCA ranges from 2.5 to 1.25, indicating that the industry has a relatively strong interna-tional competitiveness in this country; if RCA ranges from 1.25 to 0.8, indicating that the industry has a litter strong international competitiveness; if RCA is less than 0.8, it indicates that the industry is comparative disadvantage in this country.
Table 1 shows that, China has comparative advantages in capital and tech-nology-intensive products, such as SITC7 (machinery and transport equipment), and the advantages has been increasing in recent years. Now RCA is more than 1.25, it means that our manufacturing products already have strong internation-al competitiveness. It is related to the establishment of Chinese position as the world factory. Obviously, China has already been a super big manufacture coun-
Table 1. China’s RCA index.
try. The South Asian countries in general are not international competitive in ma-chinery and transportation equipment. Trade complementarity between China and South Asia is very high in this industry. In recent years, China high-speed rail has became the representative of the high-end equipment manufacturing industry. It starts to develop international market. To the end of 2014, there were already 28 countries conducting cooperation with China on import of high-speed rail. It is the proof of China’s outstanding achievements of manufacturing industry.
The RCA index indicates that China is less competitive in primary commodi-ty , and it shows a decreasing trend year by year, including SITC0 (food and live animals), SITC1 (beverages and tobacco), SITC2 (non-food raw materials), SITC3 (mineral fuels, lubricants and raw materials), SITC4 (animal and vegeta-ble oils). Because China is a populous country, its per capita hold of resources is low while consumption is enormous. China do not have comparative advantage in resource-intensive products.
At the same time, the South Asian countries generally have strong interna-tional competitiveness on SITC0 (food and live animals) products, indicating that China and South Asia have tradecomplementarity of agricultural products. India is very competitive on SITC2 (non-food raw material), and Sri Lanka also has an advantage on SITC1 (beverages and tobacco). That means there may be tradecomplementary and cooperation for China and these countries. China has obvious advantages in labor-intensive products, including SITC6 (manufactured goods classified by raw materials) and SITC8 (miscellaneous manufactured ar-ticles). Especially the RCA index of SITC8 is more than 2.5, that indicates it has strong international competitiveness. Although the RCA index shows a des-cending trend since 2000, but it tends to be steady in recent years. At the same time, South Asian countries is very competitive in SITC8 and SITC6 universally. There is a trend of export similarity for China and South Asia. Trade competi-tion among these nacompeti-tions is more and more sharp inevitably. Overall, China has an increasing advantage in capital or technology-intensive products and has prominent comparative advantage in labor-intensive products significantly. But China is not competitive in resource-intensive products, which is consistent with the facts that China has rich labor resources however it’s lack of natural re-sources and capital relatively.
Table 2. India’s RCA index.
2000 2001 2002 2003 2004 2005 2006 2007 2008 2009 2010 2011 2012 2013 2014 0 2.15 2.10 2.06 1.77 1.72 1.56 1.57 1.60 1.66 1.10 1.24 1.34 1.59 1.66 1.61 1 0.52 0.47 0.48 0.45 0.45 0.42 0.44 0.45 0.58 0.65 0.59 0.43 0.50 0.50 0.47 2 1.24 1.26 1.51 1.38 1.97 2.34 2.08 2.11 1.91 1.65 1.73 1.25 1.59 1.19 1.05 3 0.34 0.52 0.52 0.65 0.79 0.85 1.07 1.27 1.10 1.03 1.20 1.18 1.16 1.29 1.48 4 1.85 1.49 0.88 0.83 1.11 0.91 0.75 0.68 0.63 0.64 0.67 0.64 0.59 0.62 0.60 5 1.14 1.12 1.08 1.08 1.09 1.07 1.13 1.06 1.08 0.91 0.97 0.96 1.11 1.09 1.08 6 2.92 2.65 2.75 2.80 2.48 2.41 2.16 2.04 1.99 1.96 2.19 1.91 1.86 2.01 1.90 7 0.18 0.21 0.21 0.24 0.25 0.27 0.29 0.30 0.39 0.45 0.42 0.42 0.41 0.41 0.44 8 1.72 1.59 1.50 1.51 1.55 1.45 1.44 1.30 1.15 1.55 1.12 1.24 1.35 1.03 1.12 9 0.47 0.70 0.57 0.35 0.27 0.30 0.28 0.27 0.35 0.77 0.40 0.92 0.18 0.42 0.20
again and again, the competitiveness is descending and rising alternately, but the commodity or industry still has comparative advantages in international market.
According to Table 3, Pakistan’s RCA index of SITC0 (food and live animals) shows an upward trend in tortuous, strengthening comparative advantage on the whole; the RCA index has been more than 2.5 since 2008, meaning that SITC0 has strong international competitiveness. Pakistan’s RCA index of SITC4 (ani-mal and vegetable oils, oils and waxes) varies relatively greatly, but still has rela-tively strong competitiveness. Pakistan’s RCA index of SITC6 (classified by raw manufactures) has remained more than 2.5, meaning that SITC6 is highly com-petitive. Pakistan’s RCA index of SITC8 (miscellaneous products) change smoothly, meaning that SITC8 is relatively competitive.
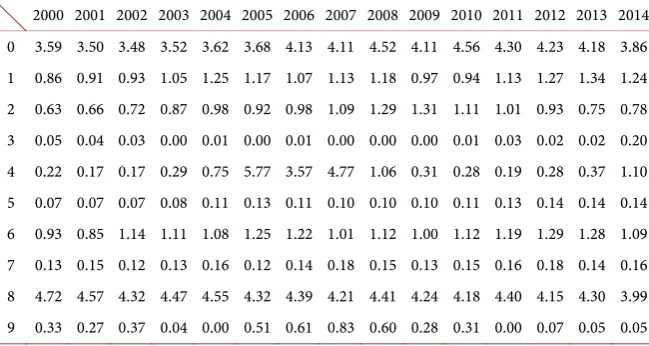
Sri Lanka’s RCA index of SITC0 (food and live animals) have a rising trendo-verall, but showing a downward trend in recent years; RCA index remaines at around 4, meaning that SITC0 has strong international competitiveness. Sri Lanka’s RCA index of SITC1 (beverages and tobacco) changes mildly, showing a slight upward trend with relatively strong international competitiveness. Sri Lanka’s RCA index of SITC6 (manufactured goods classified by raw materials) shows an upward trend overall, with relatively strong international competitive-ness. Sri Lanka’s RCA index of SITC8 (miscellaneous manufactured articles) changes greatly, showing a downward trend overall; the RCA index remaines more than 4, meaning that SITC8 has strong international competitiveness (as follow: Table 4).
2) Trade Integration Index (TII)
Trade Integration Index (TII) is a measure of the close degree of trade be-tween two countries. If the index is high, it means that trade complementarity between two countries is strong. The formula is as follow: ab a
b w
E E TII
M M
Table 3. Pakistan’s RCA index.
[image:8.595.210.535.295.468.2]2000 2001 2002 2003 2004 2005 2006 2007 2008 2009 2010 2011 2012 2013 2014 0 1.92 1.83 1.84 1.82 1.73 2.18 2.25 2.16 3.18 2.53 2.79 3.17 2.70 3.13 2.89 1 0.08 0.10 0.09 0.15 0.19 0.21 0.25 0.14 0.13 0.16 0.20 0.30 0.24 0.17 0.13 2 1.07 0.71 0.61 0.61 0.76 0.61 0.55 0.61 0.76 0.84 0.81 0.91 1.26 1.11 1.02 3 0.14 0.23 0.21 0.24 0.26 0.34 0.36 0.44 0.37 0.31 0.39 0.32 0.08 0.13 0.20 4 0.82 0.45 0.46 0.89 1.02 1.63 1.60 1.38 1.49 1.06 0.75 1.23 1.48 1.15 0.89 5 0.18 0.18 0.20 0.22 0.20 0.29 0.25 0.25 0.32 0.32 0.34 0.39 0.35 0.41 0.40 6 3.82 3.85 3.82 3.83 3.53 3.50 3.44 3.23 3.07 3.48 3.31 3.19 3.38 3.57 3.43 7 0.03 0.03 0.03 0.03 0.10 0.05 0.05 0.12 0.08 0.07 0.08 0.05 0.05 0.05 0.05 8 2.43 2.35 2.39 2.36 2.49 2.45 2.57 2.41 2.43 2.31 2.31 2.23 2.53 2.15 2.11 9 0.04 0.04 0.01 0.01 0.01 0.02 0.02 0.05 0.00 0.00 0.00 0.00 0.24 0.00 0.00
Table 4. Sri Lanka’s RCA index.
2000 2001 2002 2003 2004 2005 2006 2007 2008 2009 2010 2011 2012 2013 2014 0 3.59 3.50 3.48 3.52 3.62 3.68 4.13 4.11 4.52 4.11 4.56 4.30 4.23 4.18 3.86 1 0.86 0.91 0.93 1.05 1.25 1.17 1.07 1.13 1.18 0.97 0.94 1.13 1.27 1.34 1.24 2 0.63 0.66 0.72 0.87 0.98 0.92 0.98 1.09 1.29 1.31 1.11 1.01 0.93 0.75 0.78 3 0.05 0.04 0.03 0.00 0.01 0.00 0.01 0.00 0.00 0.00 0.01 0.03 0.02 0.02 0.20 4 0.22 0.17 0.17 0.29 0.75 5.77 3.57 4.77 1.06 0.31 0.28 0.19 0.28 0.37 1.10 5 0.07 0.07 0.07 0.08 0.11 0.13 0.11 0.10 0.10 0.10 0.11 0.13 0.14 0.14 0.14 6 0.93 0.85 1.14 1.11 1.08 1.25 1.22 1.01 1.12 1.00 1.12 1.19 1.29 1.28 1.09 7 0.13 0.15 0.12 0.13 0.16 0.12 0.14 0.18 0.15 0.13 0.15 0.16 0.18 0.14 0.16 8 4.72 4.57 4.32 4.47 4.55 4.32 4.39 4.21 4.41 4.24 4.18 4.40 4.15 4.30 3.99 9 0.33 0.27 0.37 0.04 0.00 0.51 0.61 0.83 0.60 0.28 0.31 0.00 0.07 0.05 0.05
whole wold in the same time. If TII is more than 1, it indicates that bilateral trade relations is close; if TII is less than 1, it indicates that bilateral trade rela-tions is loose.
Table 5. China and some countries in South Asia, bilateral trade combined index.
Category
Year
India’s trade
with China China’s trade with India
Pakistan’s trade with China
Chinese trade
with Pakistan with Sri Lanka China’s trade with Sri Lanka Chinese trade
2000 0.502 0.771 0.770 1.583 0.027 1.885 2001 0.542 0.883 0.807 1.885 0.027 1.683 2002 0.677 0.933 0.528 2.245 0.057 1.119 2003 0.797 0.801 0.401 2.468 0.048 1.345 2004 0.893 0.938 0.372 2.149 0.052 1.384 2005 1.137 0.872 0.431 1.878 0.073 1.556 2006 0.989 1.023 0.458 1.777 0.057 1.416 2007 0.947 1.255 0.501 2.041 0.068 1.393 2008 0.789 1.126 0.509 1.609 0.083 1.346 2009 0.721 1.145 0.699 1.796 0.102 1.711 2010 0.853 1.115 0.723 1.763 0.116 1.540 2011 0.570 1.031 0.680 1.827 0.107 1.431 2012 0.495 0.842 1.036 1.829 0.125 1.450 2013 0.451 0.848 0.976 2.055 0.112 1.565 2014 0.391 0.911 0.841 2.150 0.145 1.521
China’s Trade Integration with Inida is at or near 1 or more largely, meaning that India is quite dependent on Chinese market. At the same time, Trade Inte-gration Index is declining in recent years, meaning that the dependence rela-tionship of their trade is weakened gradually. Trade Integration between China and Pakistan remains stable as a whole, with a slow upward trend. China’s Trade Integration with Pakistan reaches 1.94 on average and even exceeds 2 in recent years, indicating their trade relationship is getting more and more closely. The proportion of China’s exports to Pakistan account for China’s total exportsre-mains at 0.43% around. While the proportion of Pakistan’s exports to China ac-count for Pakistan’s total exports is more than 10%, indicating that Pakistan’s dependence on Chinese market is much higher than China’s dependence on Pa-kistan market. That is why PaPa-kistan’s Trade Integration with China is less than 1.Sri Lanka's Trade Integration with China is very low, it is more than 0.1 in re-cent years, indicating that China doesn’t depend on the market of Sri Lanka. Meanwhile, China’s Trade Integration with Sri Lanka is 1.49 on average, mean-ing that Sri Lanka is highly dependent on Chinese market.
3) Trade Complementarity Index
1 1
2
n n
t t
n
CS = −
∑
a −b( ) ( )
2 2n n
t t
n
n n
t t
n n
a b CC
a b
=
∑
∑
∑
n t
a represents exports of product “n” accountes for the proportion of total
exports for country “a” in period “t”. n t
b represents imports of product “n”
ac-countes for the proportion of total imports for country “b” in period “t”. When the index is closer to 1, that means the trade complementarity between two countries is strong. There are a lot of chance for trade cooperation. Trade com-plementarity between China and South Asia is as follow: Table 6.
Table 6 shows, the Trade Complementarity between China and India shows a gradual upward trend, Trade Complementarity Index exceeds 0.7, indicating trade complementary between two nations is strong. India’s exports to China are mainly textiles and raw materials, base metals and products, minerals and other industrial raw materials. While India’s imports from China are mainly mechan-ical and electrmechan-ical products, chemmechan-ical products, transport equipment and other industrial products. The trade structure of China and India is different, so there is a certain degree of trade complementarity for the two countires. In recent years, SITC7 (machinery and transport equipment), SITC8 (miscellaneous man-ufactured articles) and SITC6 (manman-ufactured goods classified by raw materials) are products with the highest export share for China. Their exports accounts for more than 88% of China’s total exports. SITC3 (mineral raw materials, lubri-cants and raw materials), SITC7 (machinery and transport equipment) and SITC6 (manufactured goods classified by raw materials) are products with the highest import share for India. Their imports accounts for more than 65% of In-dia’s total imports. It is obvious that China’s largest export is SITC7 and SITC6, they happen to be India’s main import. On the other hand, SITC3 is the third- largest imports, average proportion of imports is more than 14%. Meanwhile SITC3 is India’s main exports, average proportion of exports is more than 19%. From here we see, there is a certain degree of trade structure complementarity for China and India, trade cooperation potential between two countries is high. Trade Complementarity Index between China and Pakistan and Trade Com-plementarity Index between China and Sri Lanka change smoothly, both of them is less than 0.4. The reason is as follow: SITC6 (manufactured goods classified by material), SITC8 (miscellaneous manufactured articles) and SITC0 (food and live animals) are products with the highest export share for Pakistan and Sri Lanka. Their exports accounts for more than 80% of Pakistan’s total exports, so does Sri Lanka. But China’s import share of these products is less than 20%. So trade complementarity between China and Pakistan is very weak, so does Sri Lanka.
Table 6. Trade Complementarity Index between South Asia and China.
2000 2001 2002 2003 2004 2005 2006 2007 2008 2009 2010 2011 2012 2013 2014 India 0.55 0.57 0.55 0.57 0.60 0.63 0.63 0.64 0.69 0.70 0.70 0.70 0.71 0.68 0.70 Pakistan 0.38 0.36 0.34 0.35 0.37 0.35 0.34 0.38 0.36 0.35 0.35 0.34 0.32 0.30 0.32
Sri
4. The Analysis about Trade Competition of China and South
Asia
1) Export Similarity Index The formula is as follow:
(
)
0 1 1 100 2 i i ni i a a b b
ab a a b b i i
i a a b b
X X X X
ESI X X X X
X X X X
= − = + × − + ×
∑
i aX represents exports of product “i” for country “a”, Xa represents coun-try “a”’s total exports to the world market, i
b
X represents exports of product
“i” for country “b”, Xb represents country “b”’s total exports to the world market. ESI evaluates the trade similarity between two countries in the face of global market, sequentially measures trade competitiveness of the two countries. ESI varies from 1 to 100. The higher index becomes, the more intense the trade competition between two nation is. The export similarity index of China and Sout is as follow: Table 7.
Exports similarity between China and India showed a descending trend on the whole, but it rises in recent years. Because China and India are both emerging developing countries. They have similar economic divisions and position in the international market. They have something in common, such as resource en-dowment, technology level, geographic location. Then they tend to become the exporter dominated by labor-intensive industries. Inevitably exports similarity between the two nations is relatively high. China is still making the transition from a large agricultural country to the major industrial countrie. India is now actively transforming to capital and technology-intensive industries. These can make competition between two countries more vigorous undoubtedly. The ESI of China and Pakistan is more than 50, and it shows a decreasing tendency. Be-cause the two countries gradually attach more importance to the adjustment of export structure to reducing homogeneous commodity exports. Export similari-ty between China and Sri Lanka changes significantly, experiencing the process of decrease to increase.
2) Trade Competitiveness
1 1 2 n n t t n
CS = −
∑
a −b( ) ( )
2 2n n t t n n n t t n n a b CC a b =
∑
∑
∑
Table 7. Export similarity between China and South Asia: ESI.
2 CS CC CI= + n
t
a represents exports of product “n” accountes for the proportion of total
exports for country “a” in period “t”. n t
b represents exports of product “n”
ac-countes for the proportion of total exports for country “b” in period “t”. When the index is closer to 1, that means the trade competition between two countries is intensive. Trade competition between China and South Asia is as follow: Ta-ble 8.
Trade Competitiveness index between China and South Asia remaines above 0.5 and is experiencing the process of decrease to steady, showing a slight up-ward trend since 2010. Among them, CI index between China and India remains above 0.6, it maintained a high trade competitiveness. China’s exports of SITC6, SITC7 and SITC8 products are accounting for more than 88% of total exports, while India’s exports of SITC6 and SITC7 products are accounting for more than 38% of India’s total exports on average, they are the main exports for India. Pakistan’s exports of SITC6 and SITC8 products are accounting for more than 68% of its total exports. Sri Lanka’s exports of SITC6 and SITC8 products are accounting for more than 62% of its total exports. These two products are main exports for Pakistan and Sri Lanka. The result indicates that export similarity between China and South Asia is relatively high, which is reflected clearly by ESI. The reason is that China and South Asia have something in common, such as resource endowment and comparative advantage. They are dependent on export model oriented by labor-intensive industries. Both of them have developed ra-pidly in labor-intensive manufacturing industry. So their export structure is sim-ilar, intensifying trade competition.
5. Conclusion and Recommendations
According to the analysis in this paper, the trade structure of China and South Asia has a certain competitive, but also has a lot of complementarity, that means competitiveness and complementary is concomitant. The trade goods were var-ious, China exports to South Asia are mainly manufactured goods, South Asian exports to China mainly are primary products and semi-finished products. The volume of trade between China and South Asian in general is growing, China has become the major trade partner for South Asia countries. Relative to the economic scale and the opening degree of China and South Asia, the trade vo-lume between them is low, and there is a problem of trade structural imbalance. On the one hand, from a worldwide perspective, export similarity between
Table 8. Trade competitiveness of China and the South Asia: CIindex.
China and South Asian are on the rise in recent years. Especially for China and India, their export similarity is high, the competition is more intense. India is the most important country in South Asia. In terms of economic size, India’s GDP is nearly five times as much as other South Asian countries. On the other hand, al-though trade complementarity between China and other South Asian is not high, but trade complementarity between China and India is higher and remains stable. In recent years, China and the South Asian trade competitiveness is get-ting stronger. In this situation, China should take advantage of trade comple-mentarities to promote bilateral relations, strengthen differentiated products that have a comparative advantage, and adjust the structure of the industrial trade. With the advance of “One Belt And One Road” strategy, the economic and trade cooperation between China and South Asian are facing more oppor-tunities and challenges. Therefore, more measures should be taken to further expand trade cooperation, widen the field of international trade and economic cooperation.
Firstly, Make good use of trade complementarities to improve trade structure. Chinese exports to South Asia have a wide range of categories, including from raw materials to high-tech products, export manufactured goods are the main products. South Asian exports to China are the low value-added primary prod-ucts and semi-finished prodprod-ucts mainly. China should strengthen exports which have comparative advantages, increase trade of complementary products. So complementary and mutually beneficial is the structure of their exchanges of goods that it has greatly pushed the development of bilateral trade. In terms of product quality and grade, to begin with China should take full advantage of su-perior resources. Then China should lay emphasis on technological innovation, master the core technology and protect intellectual property, so that China can improve product quality, increase product added value and enhance the degree of product differences, ultimately promote the international competitiveness of Chinese manufacturing industry. China should put more emphasis on exporting the technology and capital intensive products which are high value-added with high technical content, simultaneously reduce labor-intensive exports which are low value-added to avoid excessive competition with South Asian countries. In-dustry is the foundation of trade, so China should attach great importance to the optimization and upgrading of industrial structure, make full use of industrial complementation. For example, China is a big manufacturing country, India has a strong service sector. Both sides should strengthen cooperation in service trade, realize the most complementary of manufacturing and services to achieve the dynamic trade balance.
No-vember 11, 2015. It can further improve the level of liberalization of China-Pa- kistan FTA, provide more financing facilities for businesses of the two countries. What is more, it may make sure that major projects including China and Pakis-tan Economic Corridor can be implemented successfully. Moreover, in 2015 China also actively pushed forward the FTA negotiations with Sri Lankaso as to make positive progress at an early date. In December of that year, China started FTA upgrade negotiations with Maldives. The establishment of China-India free trade area should take full advantage of historical opportunity of “One Belt And One Road” strategy, strengthen trade negotiations and cooperation. So that we can strive to establish China-India free trade area to reduce trade barriers and lessen trade friction.
Thirdly, strengthen infrastructure construction to promote the interconnec-tivity. The core of “One Belt And One Road” strategy is interconnectivity, and the premise is the infrastructure construction. The implementation of “One Belt And One Road” strategy needs a variety of transport corridor including highway, railway, port and airport as the important cohesive device to promote business exchanges and cooperation. On the other hand, the convenience of transporta-tion can reduce the cost of trade. South Asian natransporta-tions are generally enslaved to poor infrastructure, their economic development and cooperation is usually re-stricted by poor transport capacity. China has long since increased infrastructure investment in parts of South Asia, especially harbour construction, such as Gwadar Harbor in Pakistan’s Baluchistan Province, Sri Lanka’s Hambantota port, Bangladesh’s Chittagong port and so on. China and South Asian countries should develop extensive cooperation in high-speed rail, cross-border bridges and other infrastructure. Particularly in terms of high-speed rail, China has out-standing technology and abundant operation experiences so that China is also quite competitive in the international market. China should fully explore such advantages to promote cooperation with South Asian countries in high-speed rail projects, consequently stimulating trade of transportation industry.
References
Du Xiuhong 杜秀红 (2015). An Analysis on China-India Trade Structure in the Context
of the Belt and Road Initiative from 2002-2014 “一带一路”背景下的中印货物贸易结 构分析: 2002-2014年. Journal of Audit & Economics, No. 6, 106-112.
Han Yonghui, Luo Xiaofei, & Zou Jianhua 韩永辉, 罗晓斐, 邹建华 (2015). Trade
Co-operation Competitiveness and Complementarities of China and West Asia under the Background of Silk Road Economic Belt and Maritime Silk Road Strategy 中国与西亚
地区贸易合作的竞争性与互补性研究——以“一带一路”战略为背景. World
Econo-my Studies, No. 3, 89-98.
Han Yonghui, & Zou Jianhua 韩永辉, 邹建华 (2014). The Present Situation and
Pros-pects of Trade Cooperation between China and West Asia under the Background of “One Belt and One Road” “一带一路”背景下的中国与西亚国家贸易合作现状和前景 展望. Intertrade, No. 8, 21-28.
Liao Mingzhong 廖明中 (2015). An Evaluation of Trade Potential with the Silk Road
Sang Baichuan, & Li Jiguang 桑百川, 李计广 (2011). China’s Trading Relations with
Major Emerging Countries: Analysis Based on Trade Competitiveness and Trade Complementarity 拓展我国与主要新兴国家的贸易关系——基于贸易竞争性与互补 性分析. Finance & Trade Economics, No. 10, 69-75.
Sang Baichuan, & Yang Lizhuo 桑百川, 杨立卓 (2015). China’s Trading Relations with
the Countries of “One Belt And One Road”: Based on the Trade Competitiveness and Trade Complementarities 拓展我国与“一带一路”国家的贸易关系——基于竞争性
与互补性研究. On Economic Problems, No. 8, 1-5.
Submit or recommend next manuscript to SCIRP and we will provide best service for you:
Accepting pre-submission inquiries through Email, Facebook, LinkedIn, Twitter, etc. A wide selection of journals (inclusive of 9 subjects, more than 200 journals)
Providing 24-hour high-quality service User-friendly online submission system Fair and swift peer-review system
Efficient typesetting and proofreading procedure
Display of the result of downloads and visits, as well as the number of cited articles Maximum dissemination of your research work