The Impact of Thermal Modeling on Limiting RF-EMF
*
Norbert Leitgeb
Institute of Health Care Engineering with European Notified Body of Medical Devices, Graz University of Technology, Graz, Aus-tria.
Email: [email protected]
Received February 5th, 2013; revised March 8th, 2013; accepted March 21st, 2013
Copyright © 2013 Norbert Leitgeb. This is an open access article distributed under the Creative Commons Attribution License,
which permits unrestricted use, distribution, and reproduction in any medium, provided the original work is properly cited.
ABSTRACT
The paper quantitatively assesses the relationship between specific energy absorption rates (SAR) of radio frequency (RF) electromagnetic fields (EMF) and resulting intracorporal tissue temperature changes (∆T) at whole body exposure of a small person to resonant RF EMF. Applied thermal modeling allowed accounting also for dynamic thermoregula- tory responses. As expected from physical laws the correlation of all local SAR values and ∆T data was fairly good. However, at local level SAR proved to be only weakly associated with ∆T. Even if averaged, over any 10 g tissue the ratio ∆T10g/SAR10g still varied by almost two orders of magnitudes. Blood perfusion was found to play a major role in affecting local temperature changes and caused even net cooling. The results demonstrate that local SAR is a poor sur-rogate for local temperature change, and that conventional static thermal modeling underestimates body core tempera-ture. Results demonstrated that recommended reference levels of RF EMF fail to reliably prevent from exceeding yet legally binding basic restrictions not only with regard to whole-body SAR but also with regard to whole-body tempera-ture rise (ΔT). Consequently, from a legal point of view general presumption of conformity is no longer justified. While thermal basic restrictions were exceeded if related to the whole-body averaged value, compliance could not be excluded with regard to body-core related values. Further results might allow improving EMF limiting in terms of relating it more closely to the basic health-relevant parameter which is tissue temperature change.
Keywords: Electromagnetic Fields; Radio Frequency; Health Risks; Tissue Heating; Specific Absorption Rate
1. Introduction
Existing regulations and guidelines for limiting expo- sures to non-ionizing electromagnetic fields (EMF) such as from the International Commission on Non-Ionizing Radiation Protection (ICNIRP) or the Institute of Elec-trical and Electronics Engineers (IEEE) aim at defining basic limits for those induced intracorporal quantities which primarily generate health-relevant biological ef-fects. For pragmatic reasons in a second step reference values are derived by numerical modeling linking meas-urable external field parameters to intracorporal basic quantities [1-4].
For biophysical reasons the frequency range of non- ionizing EMF (up to 300 GHz) can be divided into two basic sections governed by quite different but well estab- lished interaction mechanisms.
In the extremely low frequency (ELF) range electric and magnetic fields have to be assessed separately al-though both induce intracorporal electric field strengths
(and in turn electric current densities), however, with different pathways. Induced electric field strengths may cause the primary biologic effect, namely cellular excita-tion, provided stimulation thresholds are exceeded. Pro- gress in numerical simulation and digital anatomical modeling allowed more reliably assessing the relation- ship between magnetic reference levels and basic restric-tions which in the meanwhile resulted in doubling former magnetic field reference levels (e.g. at power frequency from 100 µT to 200 µT) without challenging the basic restriction [1].
merical simulation and digital anatomical modeling al- lowed demonstrating that RF EMF reference values are not conservative enough to justify presumption of con- formity with basic restrictions in any case. Studies re- ported up to 45% excess of basic restrictions at exposure scenarios of persons with small body height such as chil-dren or undersized adults [7-15].
2 2 2
Limiting EMF exposure by basic restrictions and ref-erence levels is based on three essential requirements:
a) knowledge of the primary health-relevant interac-tion mechanisms for identifying basic intracorporal quan- tities;
b) knowledge of the frequency-dependent dose re-sponse as an indispensable requirement for extrapolation to other exposure conditions and limit setting in the en-tire frequency range;
c) knowledge of the relationship between basic intra-corporal quantities and measurable external field para- meters (reference levels).
This paper quantitatively assesses the relationship of EMF-induced intracorporal tissue temperature changes and SAR with particular consideration of dynamic ther-moregulation.
2. Method
Numerical investigations were made in a two-step ap- proach. In a first step, the intracorporal SAR distribution has been calculated by the commercial software package CST Studio Suite [16] based on finite integration tech- nique (FIT) [17] at the numerical anatomical model DIZZY of an 8-year-old boy (1.4 m, 26 kg) segmented into voxels [18]. In a second step the cal- culated SAR distributions were used for thermal simula-tion which was based on the bioheat equasimula-tion [19] which had been further improved by accounting for additional and time-dependent thermoregulatory processes. These were heat-dependent changing metabolic rate A, blood perfusion and vasodilatation B, heat exchange S via tis- sue/air interfaces at the skin and within the lung, and by heat transfer due to insensible water loss and sweating [7]. This resulted in the following improved bioheat equation mm
, B T r t
1 , , ,, , B ,
T
t C
K T t A T S T
T t T t SAR t
r r
r r r r
r r r r
with the spatial vector in m, the time t in s, the specific heat capacity C in
r
Ws K kg , the mass density in
3
kg m , the thermal conductivity K in W m K
, theB in W K m
3
, and the absorbed energy rate SAR inW kg.
After initially calculating the steady-state starting con- dition, induced tissue temperature changes were deter- mined as a function of time over 60 min to assure T reached the new steady-state. Dielectric tissue parameters were derived from the Cole-Cole model [20-22], thermal parameters were taken from the literature [23,24].
The association between SAR and tissue temperature change ∆T has been quantitatively investigated for a worst-case scenario with plane-wave whole-body RF EMF exposure at resonance frequency and at reference level as defined by exposure limits [2,3].
3. Results
The resonance frequency of the used 1.4 m tall child model at plane wave RF EMF exposure was defined by peaking whole-body SAR
SARWB
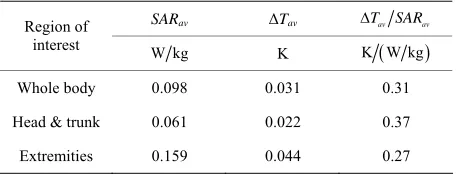
. It was found at 90 MHz. The results showed that reference level RF EMF induce an SARWB of 0.098 W kg which exceeds the basic restriction 0.08W kg by 23%. Thermal modeling demonstrated that the temperature increase ∆TWB, aver-aged over the entire body (including extremities outside the temperature equilibration body-core zone) is only 0.031 K (Table 1). It has to be noted that hot-spots en-countered at the extremities make the whole-body aver-aged temperature increase ∆TWB by 61% larger than the body-core temperature increase ∆TBC which is averaged over head and trunk only. Consequently, the blood tem-perature increase which is equivalent to the change of body core temperature ∆TBC- amounted to only 0.022˚K which is 27% lower than ∆TWB.If SAR would be used as a surrogate for temperature increase, the relationship of both quantities SAR and ∆T would be needed to be known. Based on whole-body averages the ratio TWB SARWB was 0.31K W kg
while TBC SARBC was 0.37K W kg
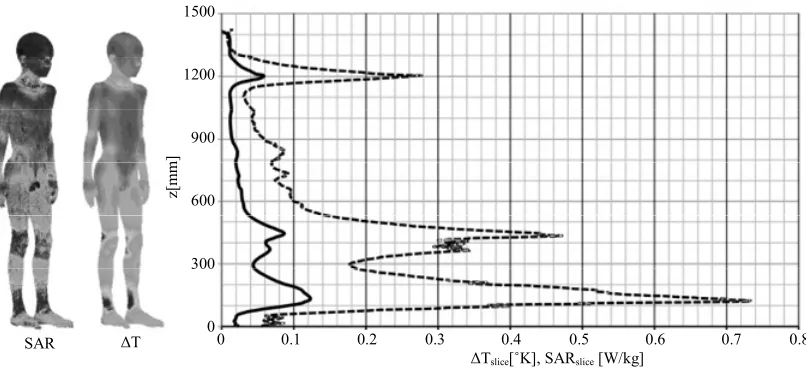
. To investi-gate the variability of the relationship between local ∆T and SAR, vertical profiles of slice-averages of horizontal cross sections SARslice and related temperature changes [image:2.595.310.538.645.732.2]∆Tslice were determined. Figure 1 shows that both vertical
Table 1. Characteristic values of RF-EMF induced heating in the DIZZY child model.
SARav ΔTav Tav SARav
Region of
interest W kg K K W kg
Whole body 0.098 0.031 0.31
Head & trunk 0.061 0.022 0.37
Extremities 0.159 0.044 0.27
0 0.1 0.2 0.3 0.4 0.5 0.6 0.7 0.8
ΔTslice[˚K], SARslice [W/kg]
ΔT
SAR
1500
1200
900
600
300
0
z[
[image:3.595.96.499.85.269.2]mm]
Figure 1. Height profiles of slice-averaged values of SARslice and ΔTslice with surface distributions of SAR and ΔT at the child
model.
profiles are fairly similar. However, while their overall correlation was very good (correlation coefficient 0.987) the ratio Tslice SARslice varied considerably, in
par-ticular up to 6.7-fold in the head region and up to 2.3- fold in the remaining body region, respectively. The ratio peaked at the skull because of weak local absorption (low SARvoxel) and heat transfer from the cerebrospinal fluid and brain regions causing an over-proportional tempera-ture increase. The overall span of the ratio
slice slice
T SAR
amounted to almost one order of magni-tude (0.177 to 1.486).
At voxel level, the association between SARvoxel and
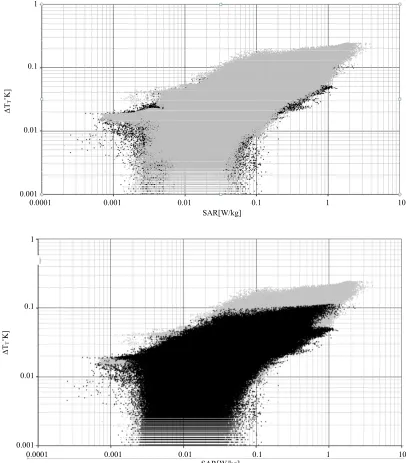
∆Tvoxel was weaker than at slice-averaged values, but still fairly good (correlation coefficient 0.808). However, detailed analysis of the voxel-values showed that local variations of SARvoxel and ∆Tvoxel values are rather high. The maximum voxel-values were 4.03 W/kg and 0.24˚K, respectively. Interestingly, if drawn one over the other the distribution exhibits a complex structure indicating that the relationship between SARvoxel and
∆Tvoxel is governed by physiologic heat transfer mecha-nisms. To demonstrate this, results are presented one over the other (in both versions) for the extremities and the temperature-regulated body core (head and trunk). Figure 2 shows that the temperature elevation within the temperature-controlled body-core region is clearly lower than at the extremities. In addition, since physiological heat transfer tends to decrease ∆Tvoxel in voxels with higher absorption rate (heat sources) and to increase
∆Tvoxel at voxels with lower SAR (heat sinks) the distribu-tion exhibits a two-tear structure which is clearly seen in the head and trunk (torso) data (Figure 2). At local level enforced heat dissipation by increased blood circulation can even lead to negative heat balance and negative val-ues of ∆Tvoxel (net cooling). Please note that the chosen
logarithmic presentation does not allow including nega-tive values; these were omitted.
6
3.1 10
The role of blood perfusion was investigated by ana-lyzing differently perfused tissues such as muscle and fat. Figure 3 shows that due to its higher water content and better perfusion muscle exhibits higher SARvoxel but smaller T. Almost the same temperature elevations were found in fat tissue at lower SARvoxel. Due to lower heat dissipation, the same amount of absorbed energy induced higher temperature elevations in fat compared to muscle tissue. Consequently, overall, the distribution associated with fat tissue is shifted towards lower values of SARvoxel (Figure 3).
If SAR was a good proxy for ∆T, the ratio of both quantities should be fairly constant. However, this is clearly not the case. This is reflected already by the ratio of mediansT SAR of the entire fat and muscle tissue. The ratio was 1.85-fold higher at fat compared to muscle tissue with 0.5 K W kg
and 0.27 K W kg
, re-spectively.The ratio of voxel-values Tvoxel SARvoxel varied
even more. Ideally, it should be independent on SAR. In fact, it is not. It is systematically decreasing with in- creasing SARvoxel (Figure 4). The overall span is ex- tremely large and amounts to about 4 orders of magni- tudes. Evaluated over the whole body, the ratio may ex-hibit even negative values (which for logarithmic pres-entation are cut off in Figure 4). The ratio
voxel voxel
T SAR
ranges from −20K W kg
to at most45K W kg
which is 145-fold higher than the ratio0.31K W kg
of whole-body averaged values. Since recommended basic restrictions of RF EMF ex-posure are based on spatial averages over any 10 g tissue (SAR10g), the distribution of SAR10g has also been0.0001 0.001 0.01 0.1 1 10 SAR[W/kg]
0.1
0.01
0.001
Δ
TT
˚
K]
0.0001 0.001 0.01 0.1 1 10 SAR[W/kg]
1
0.1
0.01
0.001
Δ
TT
˚
[image:4.595.94.500.87.550.2]K]
Figure 2. Region-specific voxel-values ΔT over SAR at the child model; extremities over torso (above) and torso over extremi-ties (below); torso (black), extremiextremi-ties (grey).
SAR10g and ∆T10g improved to 0.977, and variability be- came smaller. The maxima of SAR10g and ∆T10g were 1.19W kg and 0.186˚C, respectively. Due to averaging, no (local) negative values of temperature changes were found anymore. However, within the body the ratio
10g 10g T SAR
still varied considerably. It exhibited a span of almost two orders of magnitudes reaching from 0.11
4. Discussion
Any modeling is inherently suffering from unavoidable simplifications and numerical restrictions. This leads to deviations from the real world, and consequently to un-certainties. Sources of uncertainty are discretization, meshing, computational space limitation, boundary con-ditions, physical tissue properties, and computational algorithms, both for EMF interaction, heating and ther-mal regulation. To minimize uncertainties, a high spatial resolution of 2 mm was chosen, which among others allowed minimizing staircase effects; meshing was made
K W kg up to a maximum of 9.63K W kg
.0.0001 0.001 0.01 0.1 1 10 SAR[W/kg]
1
0.1
0.01
0.001
Δ
TT
[
˚
K]
0.0001 0.001 0.01 0.1 1 10 SAR[W/kg]
1
0.1
0.01
0.001
Δ
TT
[
˚
[image:5.595.123.477.84.481.2]K]
Figure 3. Tissue-specific voxel-values ΔT over SAR at the head and trunk region of the child model, fat over muscle (above) and muscle over fat(below); muscle (black), fat tissue (grey).
0.0001 0.001 0.01 0.1 1
SAR [W/kg] 10
10 0
10
1
0.1
0.01
T
/S
A
R
[°
K
/(
W/
k
g
)]
0.0001 0.001 0.01 0.1 1 10 SAR[W/kg]
100
10
1
0.1
0.01
Δ
T/S
A
R
[
˚
K/
(W/
kg
)]
[image:5.595.126.466.523.711.2]lowed limiting uncertainty to about 1% in accordance to [25]. The uncertainty with regard to tissue properties is caused by their measurement itself, extrapolation from animal tissue to humans and interpersonal variability. The related uncertainty can be estimated to about 10% - 15% for physical and about 10% for thermal parameters, respectively [20-22]. The uncertainty of the numerical algorithm was minimized by carefully setting the termi-nation criteria and can be estimated to less than 5% [16]. The overall performance of the numerical SAR estima-tion was validated by using the test model as defined in the standard EN 62311 [26] which resulted in a deviation of EMF-induced quantities of 2.8%. Thermal modeling was validated by simulating experiments with provoked body heating caused by exposure to 450 MHz EMF [27]. The deviation from experimental results remained below 20%. This includes overall uncertainties of numerical modeling and those of the experimental approach [28].
In the rational of recommended guidelines the objec-tive of EMF limitation is declared to prevent from excess heating, in particular from whole-body heating exceeding 1˚C [1,3]. The presented results with improved thermal modeling shows, that rather than whole-body-heating the body core temperature rise TBC of 0.022˚C is almost low enough to allow concluding that this goal is met in-cases of whole body exposure to reference values even in excess of present SARWB limits. The low temperature elevation is not surprising since in case of induced heat, thermoregulation aims at keeping body’s core tempera- ture constant. However, this does not exclude higher temperature riseat local level. Based on the initial bioheat equation, Bakker et al. [8] reported a maximum local temperature rise of 1˚C. By accounting for dynamic ther- moregulatory mechanisms in our study the maximum vo- xel temperature rise is somewhat lower with a ∆Tvoxel of 0.24˚C. It should be noted that locally averaged values are generally lower than voxel-values. The ∆T10g value which was encountered at the extremities was at most 0.18˚C.
One particular finding of this study was that good cor-relation of the entire voxel data of ∆Tvoxel and SARvoxel is not sufficient to take SAR as a surrogate for temperature increase. In fact this does not already indicate that local SAR was a good proxy, neither for ∆T at voxel level nor at 10 g average level. The reason is that of course good correlation of the entire data is not surprising and follows already from the bioheat equation. However, biological thermoregulation and tissue-specific heating cause the large variance in the relationship between SAR and T at local level which increases with decreasing averaging volume down to voxels. However, in spite of their fairly good overall correlation even averages over any 10 g
deling suggesting that averaging SAR over a volume such as 10 cm³ (10 g) would be a better predictor of tissue temperature rise although statistically not significantly correlated with ∆T10g tissue [30,31].
The presented results demonstrate that local tempera-ture rise is strongly dependent on the intensity and dy-namics of tissue perfusion. Since body-core temperature is regulated by thermal control mechanisms such as vaso- dilation and insensible water loss, SAR-attributed tem-perature changes are smaller in body core regions com-pared to extremities.
Taking local SAR as proxy for local T is conserva- tively ignoring any heat dissipation and thermoregulation and, hence, implicitly assuming adiabatic heating. How-ever, it does not account for heat dissipation to low SAR- regions which could heat sensible regions even higher than expected. Therefore, if reduction factors were not conservatively chosen, this approach is not necessarily conservative in any case.
The results confirmed that RF EMF reference levels do not prevent small people from exposures exceeding the basic restriction. In this particular case the excess was 23%. This finding is in agreement with the literature re-porting overexposures up to 45% [7-15].
In its statement to its guidelines for limiting exposure to RF EMF ICNIRP acknowledged such results and ar- gued, the excess of recommended basic restrictions would be negligible compared to the large reduction fac-tor 50 chosen for the general public [29]. However, while such an argument is acceptable in scientific discussions on health risks, it is inadequate from a legal point of view, since legal restrictions need to be met anyway and do not leave room for further negotiation.
Therefore, such a non-compliant relationship chal-lenges the presumption of conformity with basic restric- tions when meeting reference levels. In our case the ex- cess of basic SAR restrictions also leads to exceeding the implicit basic thermal restriction 0.02˚C as derived from the objective to prevent from heating above 1˚C by ap-plying the reduction factor 50. The excess of the tem- perature limit was 52% with regard to the whole-body average and 12% with regard to the body-core tempera-ture, respectively. It needs to be noted that the latter re-mains within the uncertainty range and would not already proof noncompliance.
re-sults in lower body-core temperatures.
The encountered non-compliance between reference values and basic restrictions requires either adapting ref-erence values and/or basic SARWB restrictions.
The presented study demonstrates that thermal model-ing allows gainmodel-ing better insight into the relationship between SAR and the objectives of health protection. A potential change from SAR to the biological more rele-vant quantity T would require further studies on the impact of worst-case scenarios with regard to environ-ment, biology and interpersonal variance.
5. Conclusions
Thermal modeling performed on a small person (child) exposed to resonance frequency (90 MHz) EMF by ac-counting for time-dependent thermoregulatory processes showed, that in spite of the fairly good correlation be-tween overall data of SAR10g and ∆T10g, local SAR10g val-ues are only weakly associated with local tissue tem-perature changes. Therefore, local SAR10gis no adequate surrogate to quantitatively assess local tissue temperature changes.
The fact that reference levels do not justify assumption of conformity in any exposure scenario poses a legal problem and requires a solution.
The results confirmed the reported excess of whole- body basic SARWB restrictions at plane wave EMF expo-sure of undersized people at reference levels. They dem-onstrated also that also deduced thermal basic restrictions might be exceeded if related to the whole-body average. However, compliance could not be excluded with regard to body-core averaged temperature rise.
REFERENCES
[1] ICNIRP, “Guidelines for Limiting Exposure to Time- Varying Electric and Magnetic Fields (1 Hz to 100 kHz),”
Health Physics, Vol. 99, No. 6, 2010, pp. 818-836.
[2] ICNIRP, “Guidelines for Limiting Exposure to Time- Varying Electric, Magnetic and Electromagnetic Fields (Up to 300 GHz),” Health Physics, Vol. 74, No. 4, 1998, pp. 494-522.
[3] IEEE, “IEEE Standard for Safety Levels with Respect to Human Exposure to Radio Frequency Electromagnetic Fields, 3 kHz to 300 GHz,” IEEE STD 95.1, New York, 2005.
[4] J. C. Lin, “Dosimetric Comparison between Different Quan- tities for Limiting Exposure in the RF Band: Rationale and Implications for Guidelines,” Health Physics, Vol. 92,
No. 6, 2007, pp. 547-553.
doi:10.1097/01.HP.0000236788.33488.65
[5] M. Damm, C. Nusshold, D. Cantillo, G. N. Rechberger, K. Gruber, W. Sattler and C. O. Kappe, “Can Electromag- netic Fields Influence the Structure and Enzymatic Digest of Proteins? A Critical Evaluation of Microwave-Assisted
Proteomics Protocols,” Journal of Proteomics, Vol. 75,
No. 18, 2012, pp. 5533-5543. doi:10.1016/j.jprot.2012.07.043
[6] K. R. Foster and R. Glaser, “Thermal Mechanisms of In- teraction of Radiofrequency Energy with Biological Sys- tems with Relevance to Exposure Guidelines,” Health Physics, Vol. 92, No. 6, 2007, pp. 609-620.
doi:10.1097/01.HP.0000262572.64418.38
[7] F. Niedermayr, N. Leitgeb and W. Siegl, “Simulation of the Temperature Elevation in Children Exposed to Plane Wave Electromagnetic Fields (10 MHz - 1 GHz) at IC-NIRP Reference Level,” Biomedical Engineering, Vol. 57,
No. 3, 2012, pp. 193-200.
[8] J. F. Bakker, M. M. Paulides, E. Neufeld, A. Christ, N. Kuster and G. C. van Rhoon, “Children and Adults Ex-posed to Electromagnetic Fields at the ICNIRP Reference Levels: Theoretical Assessment of the Induced Peak Temperature Increase,” Physics in Medicine and Biology,
Vol. 56, No. 15, 2011, pp. 4967-4989. doi:10.1088/0031-9155/56/15/020
[9] J. F. Bakker, M. M. Paulides, A. Christ, N. Kuster and G. C. van Rhoon, “Assessment of Induced SAR in Children
Exposed to Electromagnetic Plane Waves between 10 MHz and 5.6 GHz,” Physics in Medicine and Biology, Vol. 55, No. 11, 2010, pp. 3115-3130.
doi:10.1088/0031-9155/55/11/009
[10] S. Kuehn, W. Jennings, A. Christ and N. Kuster, “Assess- ment of Induced Radio-Frequency Electromagnetic Fields in Various Anatomical Human Body Models,” Physics in Medicine and Biology, Vol. 54, No. 4, 2009, pp. 875-890.
doi:10.1088/0031-9155/54/4/004
[11] E. Conil, A. Hadjem, F. Lacroux, M. F. Wong and J. Wiart, “Variability Analysis of SAR from 20 MHz to 2.4
GHz for Different Adult and Child Models Using Finite Difference Time-Domain,” Physics in Medicine and Bi- ology, Vol. 53, No. 6, 2008, pp. 1511-1525.
doi:10.1088/0031-9155/53/6/001
[12] P. Dimbylow and W. Bolch, “Whole-Body Average SAR
from 50 MHz to 4 GHz in the University of Florida Child Voxel Phantoms,” Physics in Medicine and Biology, Vol.
52, No. 22, 2007, pp. 6639-6649. doi:10.1088/0031-9155/52/22/006
[13] J. Q. Wang, O. Fujiwara, S. Kodera and S. Watanabe, “FDTD Calculation of Whole-Body Average SAR in
Adult and Child Models for Frequencies from 30 MHz to 3 GHz,” Physics in Medicine and Biology, Vol. 51, No. 17, 2006, pp. 4119-4127.
doi:10.1088/0031-9155/51/17/001
[14] T. Nagoaka, E. Kuneida and S. Watanabe, “Proportion- Corrected Scaled Voxel Models for Japanese Children and Their Application to the Numerical Dosimetry of Specific Absorption Rate for Frequencies from 30 MHz to 3 GHz,” Physics in Medicine and Biology, Vol. 53, No.
23, 2006, pp. 6695-6711. doi:10.1088/0031-9155/53/23/004
[16] CST Studio Suite CST GmbH, Bad NauheimerStraße 19, D-64289, Darmstadt, 2009. http://www.cst.com
[17] T. Weiland, “A Method for Discretically Solving Max- well’s Equations for Six-Component Fields (German),”
AEÜ, Vol. 31, 1977, pp. 16-120.
[18] A. Christ, W. Kainz, E. G. Hahn, K. Honegger, M. Zef- ferer, E. Neufeld, W. Rascher, R. Janka, W. Bautz, J. Chen, B. Kiefer, P. Schmitt, H.-P. Hollenbach, J. Shen, M. Oberle, D. Szczerba, A. Kam, J. W. Guag and N. Kuster, “The Virtual Family—Development of Surface-Based Anatomical Models of Two Adults and Two Children for Dosimetric Simulations,” Physics in Medicine and Biol- ogy, Vol.55, No. 23, 2010, pp. 23-38.
doi:10.1088/0031-9155/55/2/N01
[19] H. Pennes, “Analysis of Tissue and Arterial Blood Tem- peratures in the Resting Human Foream,” Journal of Ap- plied Physiology, Vol. 1, No. 2, 1948, pp. 93-122.
[20] C. Gabriel, S. Gabriel and E. Corthout, “The Dielectric Properties of Biological Tissues: I. Literature Survey,”
Physics in Medicine and Biology, Vol. 41, No. 11, 1996,
pp. 2231-2249. doi:10.1088/0031-9155/41/11/001 [21] S. Gabriel, R. Lau and C. Gabriel, “The Dielectric Prop-
erties of Biological Tissues: II. Measurements in the Fre- quency Range 10 Hz to 20 GHz,” Physics in Medicine and Biology,Vol. 41, No. 11, 1996, pp. 2251-2269.
doi:10.1088/0031-9155/41/11/002
[22] S. Gabriel, R. Lau and C. Gabriel, “The Dielectric Prop- erties of Biological Tissues: III. Parametric Models for the Dielectric Spectrum of Tissues,” Physics in Medicine and Biology, Vol. 41, No. 11, 1996, pp. 2271-2293.
doi:10.1088/0031-9155/41/11/003
[23] A. Hirata, H. Sugiyama and M. Kojima, “Computational Model for Calculating Body-Core Temperature Elevation in Rabbits Due to Whole-Body Exposure at 2.45 GHz,”
Physics in Medicine and Biology, Vol. 53, No. 12, 2008,
pp. 3391-3404. doi:10.1088/0031-9155/53/12/022
Field Energy Prescribed in the ICNIRP Guidelines,”
Physics in Medicine and Biology, Vol. 52, No. 16, 2007, pp. 5013-5023. doi:10.1088/0031-9155/52/16/020 [25] R. Findlay and P. Dimbylow, “Variations in Calculated
SAR with Distance to Perfectly Matched Layer Boundary
for a Human Voxel Model,” Physics in Medicine and Bi- ology, Vol. 51, No. 23, 2006, pp. 411-415.
doi:10.1088/0031-9155/51/23/N02
[26] EN 62311, “Assessment of Electronic and Electrical Equip- ment Related to Human Exposure Restrictions for Elec- tromagnetic Fields (0 Hz - 300 GHz),” 2008.
[27] E. Adair, S. A. Kelleher, G. W. Mack and T. S. Morocco, “Thermophysiological Responses of Human Volunteers during Controlled Whole Body Radio Frequency Expo-sure at 450 MHz,” Bioelectromagnetics, Vol. 19, No. 4, 1998, pp. 232-245.
doi:10.1002/(SICI)1521-186X(1998)19:4<232::AID-BE M5>3.0.CO;2-2
[28] F. Niedermayr, “Human Thermoregulation Model of RF- EMF Interaction,” Ph.D. Thesis, Graz University of Tech-nology, Graz, 2012.
[29] ICNIRP, “ICNIRP Statement on the ‘Guidelines for Lim-iting Exposure to Time-Varying Electric, Magnetic and Electromagnetic Fields (Up to 300 GHz)’,” Health Phys- ics, Vol. 97, No. 3, 2009, pp. 257-258.
doi:10.1097/HP.0b013e3181aff9db
[30] R. L. McIntosh and V. Anderson, “SAR versus VAR, and
the Size and Shape That Provide the Most Appropriate RF Exposure Metric in the Range of 0.5 - 6 GHz,” Bio-electromagnetics, Vol. 32, No. 4, 2011, pp. 312-321. doi:10.1002/bem.20642
[31] R. L. McIntosh and V. Anderson, “SAR versus S(inc):