On Classifying Digital Accounting Documents
Chih-Fong Tsai*. National Chung Cheng University. Taiwan.
Abstract. Advances in computing and multimedia technologies allow many accounting documents to be digitized within little cost for effective storage and access. Moreover, the amount of accounting documents is increasing rapidly, this leads to the need of developing some mechanisms to effectively manage those (semi-structured) digital accounting documents for future accounting information systems (AIS). In general, accounting documents contains such as invoices, purchase orders, checks, photographs, charts, diagrams, etc. As a result, the major functionality of future AIS is to automatically classify digital accounting documents into different categories in an effective manner. The aim of this paper is to examine flat non-hierarchical and hierarchical classification schemes for automatic classification of different types of digital accounting documents. The experimental results show that non-hierarchical classification of digital accounting documents performs better than hierarchically classifying digital accounting documents.
Key words: Accounting information systems, digital accounting documents, document classification, hierarchical classification
*
This research is supported by National Science Council of Taiwan (NSC 95-2416-H-194-034).
Submitted January 2007 Accepted September 2007
1. INTRODUCTION
Advances in computer and multimedia technologies allow the construction of images (or data digitization) and large repositories for image storage with little cost. This has led to the size of image collections increasing rapidly. In accounting information, there are many types of transaction documents and images which are digitally archived as gray-scale accounting document images or ‘image accounting’ (Mckie, 1998). For example, invoices, purchase orders, checks, photographs, charts, diagrams, etc. As a result, knowledge management of the organizational intellectual accounting assets is a very important research problem. In particular, accounting information systems (AIS) need to automatically manage these digital accounting documents for effective storage and retrieval. That is, image database management is one key component in future AIS. In this paper, we focus on classifying digital accounting documents.
Image classification can be referred to extracting meaningful image content for subsequent analyses (Conci and Castro, 2002). Image classification is different from standard alphanumeric classification (Grosky, 1997), such as text classification (Kloptchenko et al., 2004). Classifying images is very difficult since they are unstructured. It has been an active research area, e.g. supervised image classification (Agnelli et al., 2002, Tsai, 2006), and unsupervised image categorization (Chen and Wang, 2004), etc. In general, to perform image classification low-level features of images are first of all extracted, such as color, texture, shape, etc. The extracted features as feature vectors are then used to represent image content.
The next stage is to choose a supervised learning model for image classification. This learning machine or classifier is trained by using a given training set which contains a number of training examples and each of them is composed of a pair of a low-level feature vector and its associated class label. Then, the trained classifier is able to classify unknown or unlabeled low-level feature vectors into one of the trained classes.
As there are various types of digital accounting documents described above, it can be applied to a hierarchical-based classification scheme to train different classifiers, in which each of the classifiers is trained to classify relevant documents into the right class. Figure 1 shows an example. For the first level of classification,
digital accounting documents can be classified into two classes, which are non-text and text-based images. Non-text images contain any object content without text information and text-based images contain text content with or without any object content. The second level of classification considers classifying text-based images into classes including such as invoices, checks, goods receipt note, and purchase orders. In addition, another second level classifier can classify non-text images into classes containing such as photographs, maps, and diagrams. It should be noted here that the classification scheme is company or industry dependent. However, in general digital accounting documents can be first classified into text-based and non-text images for hierarchical classification.
digital accounting documents
text-based images
photograph chart map diagram invoice check goods receipt note purchase order non-text images
Figure 1 Hierarchical Classification Scheme
This paper aims at comparing the flat non-hierarchical and hierarchical classification schemes for digital accounting documents. The contribution of this paper is to provide a guidance (as the classification scheme) to automatically classify digital accounting documents. The designed classifiers can be thought of as a database indexing system of future AIS. That is, if digital accounting documents could be automatically classified in an effective manner, the later retrieval of these documents can be provided by AIS.
This paper is organized as follows. Section 2 briefly describes the concept of feature extraction and classifier construction for digital images. Section 3 reviews related work of digital document classification. Section 4 presents the experimental results and the conclusion of this paper is provided in Section 5.
2. IMAGE CLASSIFICATION
2.1. Pattern Classification
Pattern classification or recognition aims at classifying (recognising, describing, or grouping) patterns. The classified patterns are usually groups of measurements
or observations defining points in a multidimensional space. For image classification, pattern recognition systems can deal with the identification of objects from images to perform the image classification task. In addition, pattern recognition can be viewed as a nonlinear mapping process that maps an input feature vector to the output class membership space (Duda et al., 2001).
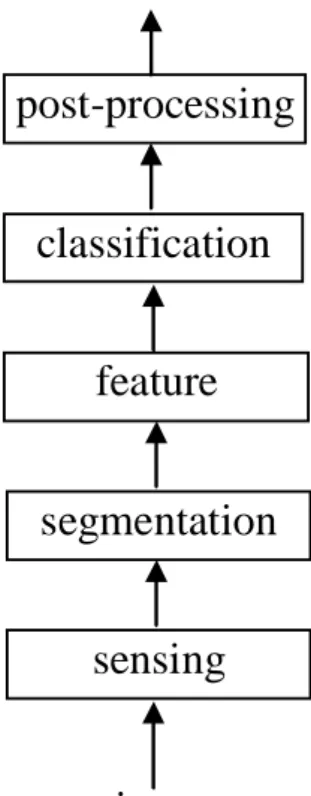
Figure 2 shows a general pattern recognition system, which is composed of several components.
decision
input
post-processing
classification
feature
extraction
segmentation
sensing
Figure 2 Block diagram of a pattern recognition system (Duda et al., 2001)
The sensing component (e.g. camera) takes the input (image) to a pattern recognition system. For image classification, we assume that images have been captured and stored in a database. The task of the segmentation component is to partition images into local contents (e.g. trees and clouds) which can generally have more detailed classification. Then, the feature extraction component extracts low-level features (e.g. texture) from the image segments represented by feature vectors. For the classification component, it assigns the (low-level) feature vectors generated by the feature extraction component to some pre-defined categories. The post-processing component (dependent on application) uses the output of the classifier to decide on some recommended action for the final decision.
2.2. Feature Extraction
For accounting documents, they are usually digitized as gray scale images. In general, there are two well-know texture features to extract textural content of gray scale images, which are Gabor filters and wavelet transform (Jain and Bhattacharjee, 1992; Jahne, 1995).
The content of digital accounting documents can be represented by the texture feature. Texture is a very useful characterization for a wide range of images. Texture can be regular or random. Most natural textures are random. Regular textures are composed of textures that have a regular or almost regular arrangement of identical, or at least similar, components. Irregular textures are composed of irregular and random arrangements of components related some statistical properties (Tuceryan and Jain, 1998).
Gabor filters (Grigorescu et al, 2002) and wavelet transform (Daubechies, 1992) are based on properties of the Fourier transform, which breaks down a signal into constituent sinusoids of different frequencies. It can be thought of as transforming our view of the signal from time-based to frequency-based.
2.3. Classifier Construction
To design a classifier to classify images, a training set is provided in which each of the training examples consist of a feature vector and its associated class label or category. The training set is used to train a machine learning algorithm, e.g.
k-nearest neighbor (Mitchell, 1997). After training, a classifier is constructed,
which is able to classify unlabeled images represented by feature vectors. Figure 3 shows the steps of image classifier construction (Tsai, 2007).
training
classifier
images
trained
feature vectors
feature
extraction
classifier
generation
(a)unlabeled
class
images
labels
feature vectors
feature
extraction
trained
classifier
(b)Figure 3 (a) training stage; (b) classification stage
Most classification systems are based on a flat classification scheme that each document is labeled by one class. On the other hand, hierarchical classification considers classes (or class labels) to be organized into a hierarchy of increasing specificity and each document is labeled by one class in the hierarchy as shown in Figure 1. Therefore, for the case of Figure 1 there are two strategies for classifier construction. The first one is based on the flat classification scheme that one classifier is designed to classify documents into one of the eight classes. The second strategy is to design three classifiers based on the hierarchical classification scheme, in which one classifier is for classifying documents into images and/or transaction documents and the second and third classifiers are for classifying the four types of images and transaction documents respectively.
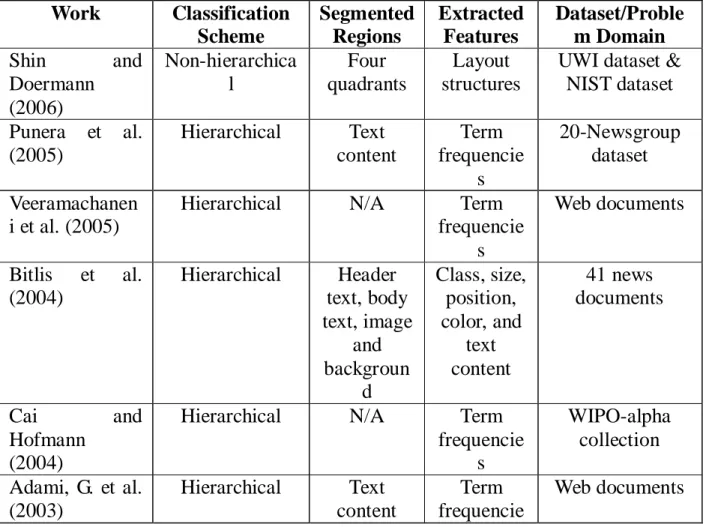
3. RELATED WORK
Table 1 compares related work of document classification in terms of the classification schemes, segmented regions, extracted features, and datasets used.
Work Classification Scheme Segmented Regions Extracted Features Dataset/Proble m Domain Shin and Doermann (2006) Non-hierarchica l Four quadrants Layout structures
UWI dataset & NIST dataset Punera et al. (2005) Hierarchical Text content Term frequencie s 20-Newsgroup dataset Veeramachanen i et al. (2005)
Hierarchical N/A Term frequencie s Web documents Bitlis et al. (2004) Hierarchical Header text, body text, image and backgroun d Class, size, position, color, and text content 41 news documents Cai and Hofmann (2004)
Hierarchical N/A Term frequencie s WIPO-alpha collection Adami, G. et al. (2003) Hierarchical Text content Term frequencie Web documents
s Diligenti et al. (2003) Non-hierarchica l XY-trees Layout structures Commercial invoices LeBourgeois et al. (2001) Non-hierarchica l Text content Layout structures Journal table of contents Shin and Doermann (2000) Non-hierarchica l Four quadrants Layout structures UWI dataset (article images) Table 1 Comparison of related work
Regarding Table 1, several issues can be identified as follows:
None of related work focuses on accounting documents except Shin and Doermann (2000) which consider 20 different federal income tax form page types. However, they do not focus on various types of accounting documents.
Since accounting documents (e.g. map) are not considered in related work, their segmented regions and extracted features only focus on text only content and page layout information instead of image segmentation and textural features described in Section 2.2.
Hierarchical classification is usually used in text-based and text only document classification.
Finally, it is not known whether the hierarchical scheme is better than non-hierarchical one in terms of classifying digital accounting documents.
4. EXPERIMENTS
4.1. Experimental Setup
4.1.1. Dataset
The dataset we used for the experiments is MediaTeam Oulu Document Database1. It is suitable for the domain of classifying digital accounting documents because it contains text-based (e.g. check and correspondence), non-text (e.g. street maps), and other documents which include both information (e.g. advertisements
1
and manuals). In total, there are 19 categories in this dataset. The ratio of the training and testing sets for each category is 1:1. Note that each category of the dataset contains different numbers of documents which may result in poor performance for the ‘small-size’ categories. However, this class imbalance problem is not the focus of this paper.
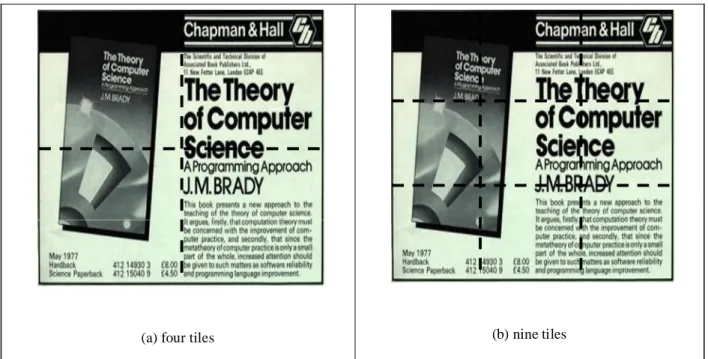
4.1.2. Document Segmentation
Each image is first of all resized into 256*256 pixel resolution for document segmentation. Figure 4 shows two types of tiling scheme to segment each document image.
(a) four tiles (b) nine tiles
Figure 4 The two tiling schemes
4.1.3. Feature Extraction
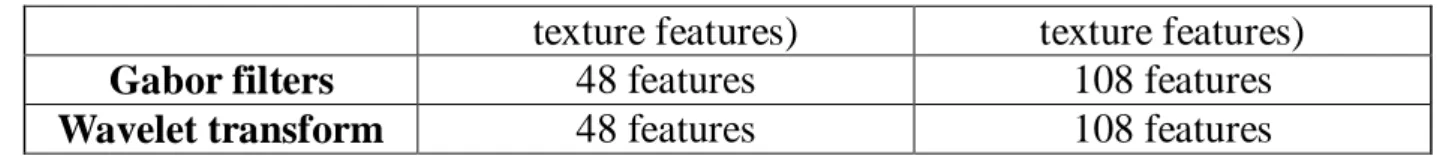
For feature extraction, Gabor filters and wavelet transform texture features of each segment are extracted for comparisons. In particular, a bank of Gabor filters with center frequencies (1/wavelength) f = 0.125, 0.25, 0.5 and orientations o = 0o, 45o, 90o, 135o and three levels of Daubechies-4 wavelet features were extracted. Then, the mean value of Gabor filters and Daubechies wavelet of each segment were separately computed. Table 2 shows the resulting feature vectors of each document based on the two texture features and tiling schemes.
texture features) texture features)
Gabor filters 48 features 108 features
Wavelet transform 48 features 108 features
Table 2 Four sets of feature vectors per document
It should be noted that, although there are many segmentation algorithms for different types of documents, we only considered extracting the textural feature of digital accounting documents because the digital accounting documents are image based. In addition, there is no standard approach to segment various types of digital accounting documents in literature.
4.1.4. Classifier Design
The support vector machine (SVM) and k-nearest neighbor (k-NN) classifiers were compared. The reason to choose these two classifiers is because k-NN (k = 1) can be used as a benchmark (Jain et al., 2000) and SVM provides better classification performance than many other techniques, such as naïve Bayes, neural networks, decision trees, etc. (Byun and Lee, 2003).
To construct a SVM classifier, two kernel functions were used, which are the polynomial and radial basis function (RBF) kernel functions. However, RBF SVM will not report here since its performance did not result in any improvement over Poly SVM for this dataset. Therefore, we used Poly SVM to compare with k-NN (k = 1, 3, 5, and 7).
4.1.5. Classification Scheme
The flat non-hierarchical and hierarchical classification schemes were considered for comparisons. Based on the flat non-hierarchical classification scheme, each of the classifiers (SVM and k-NN) was trained to classify documents into one of the 19 categories. For hierarchical classification, two types of classification scheme were considered. Figure 5 shows the first level classification of the two schemes.
digital accounting documents
(a)
digital accounting documents
text-based images
non-text images
(b)
Figure 5 The first level of hierarchical classification
In Figure 5a, the first level classifier is trained to classify documents into one of the text-only, non-text, and hybrid image classes. For the second level classification, three classifiers are constructed to classify text-only, non-text, and hybrid images respectively. Therefore, there are four classifiers trained. In Figure 5b, a classifier is trained to classify documents into either text-based (including both text-only and hybrid images) or non-text image classes for the first level classification. Then, two second level classifiers are constructed to classify text-based and non-text images respectively. As a result, three classifiers are trained.
The reason of using the above two hierarchical classification schemes is because it is unknown for digital accounting documents that whether the first level classification should consider classifying three (Figure 5a) or two (Figure 5b) image classes.
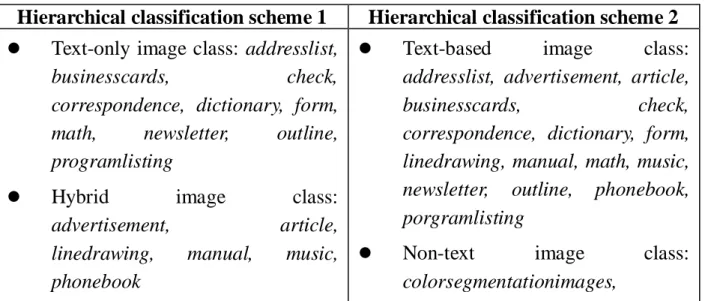
Table 3 shows the 19 categories which are classified in terms of the first level classification schemes (Figure 5).
Hierarchical classification scheme 1 Hierarchical classification scheme 2
Text-only image class: addresslist,
businesscards, check,
correspondence, dictionary, form,
math, newsletter, outline,
programlisting
Hybrid image class:
advertisement, article,
linedrawing, manual, music,
phonebook
Text-based image class:
addresslist, advertisement, article,
businesscards, check,
correspondence, dictionary, form, linedrawing, manual, math, music, newsletter, outline, phonebook, porgramlisting
Non-text image class:
Non-text image class:
colorsegmentationimages, streetmap, terrainmap
streetmap, terrainmap
Table 3 Hierarchical classification of the dataset
In the first hierarchical classification scheme, the dataset is classified into the text-only, hybrid, and non-text image classes which contain 10, 6, and 3 categories respectively. In the second hierarchical classification scheme, the text-based and non-text image classes contain 16 and 3 categories respectively.
4.2. Results of Non-hierarchical Classification
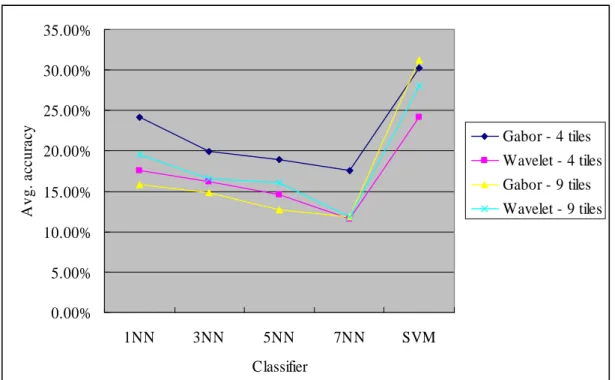
Figure 6 presents the average classification accuracy of using 4 and 9 tiling schemes and different classifiers. For feature representation, on average the extracted Gabor filters based on the 4 tiling scheme perform the best. For classifier design, SVM outperforms k-NN. 0.00% 5.00% 10.00% 15.00% 20.00% 25.00% 30.00% 35.00% 1NN 3NN 5NN 7NN SVM Classifier A v g . ac cu ra cy Gabor - 4 tiles Wavelet - 4 tiles Gabor - 9 tiles Wavelet - 9 tiles
Figure 6 Avg. classification accuracy
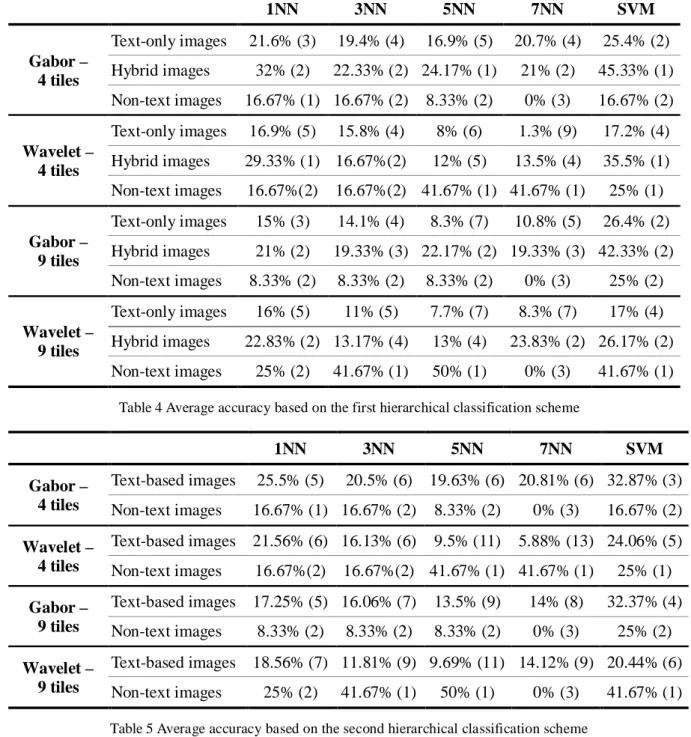
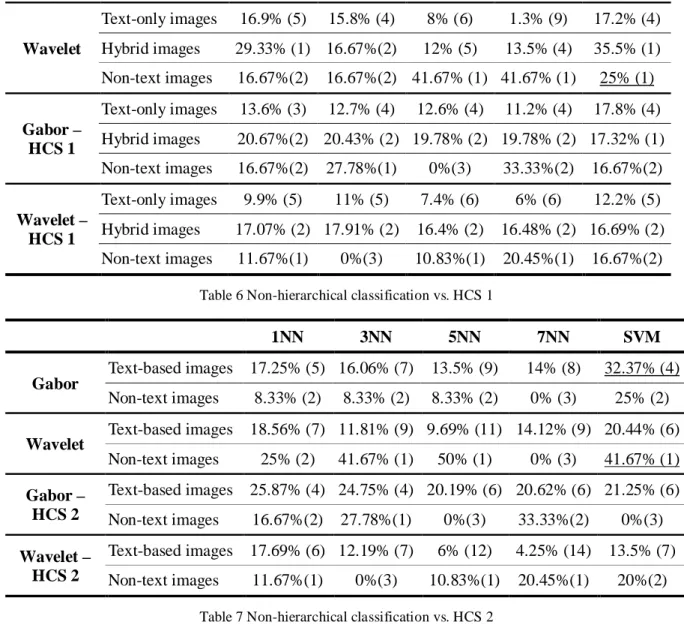
Table 4 and 5 further analyze the performance of the 19 categories based on the two hierarchical classification strategies. The number in the bracket after classification accuracy means the number of classes which have zero rate accuracy.
1NN 3NN 5NN 7NN SVM Gabor – 4 tiles Text-only images 21.6% (3) 19.4% (4) 16.9% (5) 20.7% (4) 25.4% (2) Hybrid images 32% (2) 22.33% (2) 24.17% (1) 21% (2) 45.33% (1) Non-text images 16.67% (1) 16.67% (2) 8.33% (2) 0% (3) 16.67% (2) Wavelet – 4 tiles Text-only images 16.9% (5) 15.8% (4) 8% (6) 1.3% (9) 17.2% (4) Hybrid images 29.33% (1) 16.67%(2) 12% (5) 13.5% (4) 35.5% (1) Non-text images 16.67%(2) 16.67%(2) 41.67% (1) 41.67% (1) 25% (1) Gabor – 9 tiles Text-only images 15% (3) 14.1% (4) 8.3% (7) 10.8% (5) 26.4% (2) Hybrid images 21% (2) 19.33% (3) 22.17% (2) 19.33% (3) 42.33% (2) Non-text images 8.33% (2) 8.33% (2) 8.33% (2) 0% (3) 25% (2) Wavelet – 9 tiles Text-only images 16% (5) 11% (5) 7.7% (7) 8.3% (7) 17% (4) Hybrid images 22.83% (2) 13.17% (4) 13% (4) 23.83% (2) 26.17% (2) Non-text images 25% (2) 41.67% (1) 50% (1) 0% (3) 41.67% (1)
Table 4 Average accuracy based on the first hierarchical classification scheme
1NN 3NN 5NN 7NN SVM Gabor – 4 tiles Text-based images 25.5% (5) 20.5% (6) 19.63% (6) 20.81% (6) 32.87% (3) Non-text images 16.67% (1) 16.67% (2) 8.33% (2) 0% (3) 16.67% (2) Wavelet – 4 tiles Text-based images 21.56% (6) 16.13% (6) 9.5% (11) 5.88% (13) 24.06% (5) Non-text images 16.67%(2) 16.67%(2) 41.67% (1) 41.67% (1) 25% (1) Gabor – 9 tiles Text-based images 17.25% (5) 16.06% (7) 13.5% (9) 14% (8) 32.37% (4) Non-text images 8.33% (2) 8.33% (2) 8.33% (2) 0% (3) 25% (2) Wavelet – 9 tiles Text-based images 18.56% (7) 11.81% (9) 9.69% (11) 14.12% (9) 20.44% (6) Non-text images 25% (2) 41.67% (1) 50% (1) 0% (3) 41.67% (1) Table 5 Average accuracy based on the second hierarchical classification scheme
Regarding Table 5 and 6, the wavelet texture feature is more suitable for classifying non-text images than the Gabor one. In particular, the 9 tiling scheme using the wavelet texture for classifying non-text images performs the best. On the contrary, the 4 tiling based Gabor texture feature performs better than the wavelet and the 9 tiling based Gabor ones in terms of text-only and hybrid image documents.
4.3. Results of Hierarchical Classification
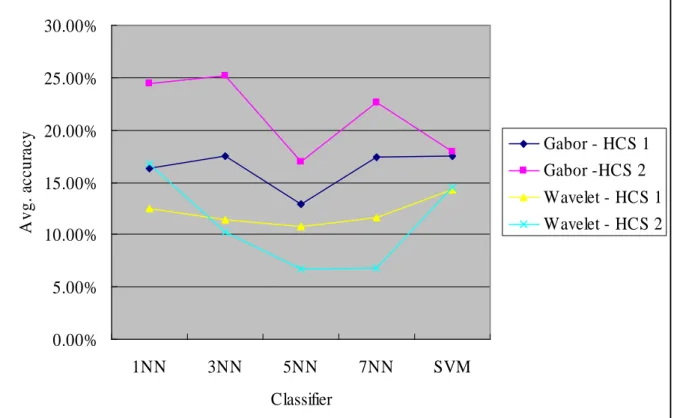
4.3.1. The 4 Tiling Scheme
Based on the 4 tiling scheme, Figure 7 shows average classification accuracy of the hierarchical classification scheme 1 (Figure 5a) and 2 (Figure 5b) (abbreviated as HCS 1 and HCS 2 respectively) by using the Gabor and wavelet texture features. On average, HCS 1 using the Gabor filters feature provides the best performance. In addition, the SVM classifier does not outperform the k-NN one under the hierarchical classification scheme, which is different from the non-hierarchical classification scheme.
0.00% 5.00% 10.00% 15.00% 20.00% 25.00% 30.00% 1NN 3NN 5NN 7NN SVM Classifier A v g . ac cu ra cy Gabor - HCS 1 Gabor -HCS 2 Wavelet - HCS 1 Wavelet - HCS 2
Figure 7 Avg. classification accuracy
Table 6 and 7 compare the result of using non-hierarchical classification with HCS 1 and HCS 2 respectively. 1NN 3NN 5NN 7NN SVM Gabor Text-only images 21.6% (3) 19.4% (4) 16.9% (5) 20.7% (4) 25.4% (2) Hybrid images 32% (2) 22.33% (2) 24.17% (1) 21% (2) 45.33% (1) Non-text images 16.67% (1) 16.67% (2) 8.33% (2) 0% (3) 16.67% (2)
Wavelet Text-only images 16.9% (5) 15.8% (4) 8% (6) 1.3% (9) 17.2% (4) Hybrid images 29.33% (1) 16.67%(2) 12% (5) 13.5% (4) 35.5% (1) Non-text images 16.67%(2) 16.67%(2) 41.67% (1) 41.67% (1) 25% (1) Gabor – HCS 1 Text-only images 13.6% (3) 12.7% (4) 12.6% (4) 11.2% (4) 17.8% (4) Hybrid images 20.67%(2) 20.43% (2) 19.78% (2) 19.78% (2) 17.32% (1) Non-text images 16.67%(2) 27.78%(1) 0%(3) 33.33%(2) 16.67%(2) Wavelet – HCS 1 Text-only images 9.9% (5) 11% (5) 7.4% (6) 6% (6) 12.2% (5) Hybrid images 17.07% (2) 17.91% (2) 16.4% (2) 16.48% (2) 16.69% (2) Non-text images 11.67%(1) 0%(3) 10.83%(1) 20.45%(1) 16.67%(2)
Table 6 Non-hierarchical classification vs. HCS 1
1NN 3NN 5NN 7NN SVM
Gabor
Text-based images 17.25% (5) 16.06% (7) 13.5% (9) 14% (8) 32.37% (4) Non-text images 8.33% (2) 8.33% (2) 8.33% (2) 0% (3) 25% (2) Wavelet Text-based images 18.56% (7) 11.81% (9) 9.69% (11) 14.12% (9) 20.44% (6)
Non-text images 25% (2) 41.67% (1) 50% (1) 0% (3) 41.67% (1) Gabor – HCS 2 Text-based images 25.87% (4) 24.75% (4) 20.19% (6) 20.62% (6) 21.25% (6) Non-text images 16.67%(2) 27.78%(1) 0%(3) 33.33%(2) 0%(3) Wavelet – HCS 2 Text-based images 17.69% (6) 12.19% (7) 6% (12) 4.25% (14) 13.5% (7) Non-text images 11.67%(1) 0%(3) 10.83%(1) 20.45%(1) 20%(2)
Table 7 Non-hierarchical classification vs. HCS 2
Regarding Table 6 and 7, non-hierarchical classification performs better than the two hierarchical classification schemes based on the 4 tiling schemes in terms of the first level and overall classification accuracy.
4.3.2. The 9 Tiling Scheme
By considering the 9 tiling scheme, Figure 8 shows average classification accuracy of HCS 1 and HCS 2 by using the Gabor and wavelet texture features. On average, the k-NN classifier outperforms SVM. However, it is difficult to conclude which texture feature based on what hierarchical classification scheme performs the best.
0.00% 5.00% 10.00% 15.00% 20.00% 25.00% 30.00% 1NN 3NN 5NN 7NN SVM Classifier A v g . ac cu ra cy Gabor - HCS 1 Gabor -HCS 2 Wavelet - HCS 1 Wavelet - HCS 2
Figure 8 Avg. classification accuracy
Table 7 and 8 compare the result of using non-hierarchical classification with HCS 1 and HCS 2 respectively. 1NN 3NN 5NN 7NN SVM Gabor Text-only images 21.6% (3) 19.4% (4) 16.9% (5) 20.7% (4) 25.4% (2) Hybrid images 32% (2) 22.33% (2) 24.17% (1) 21% (2) 45.33% (1) Non-text images 16.67% (1) 16.67% (2) 8.33% (2) 0% (3) 16.67% (2) Wavelet Text-only images 16.9% (5) 15.8% (4) 8% (6) 1.3% (9) 17.2% (4) Hybrid images 29.33% (1) 16.67%(2) 12% (5) 13.5% (4) 35.5% (1) Non-text images 16.67%(2) 16.67%(2) 41.67% (1) 41.67% (1) 25% (1) Gabor – HCS 1 Text-only images 13.4% (3) 12.3% (4) 11.8% (5) 10.4% (5) 17.7% (3) Hybrid images 18.24% (2) 17.92% (2) 19.02% (2) 19.65% (2) 13.93% (2) Non-text images 16.67%(2) 11.11%(2) 0%(3) 0%(3) 0%(3) Wavelet – HCS 1 Text-only images 10.4% (5) 11% (5) 8.3% (6) 6.6% (6) 13% (5) Hybrid images 15.12% (2) 16.4% (2) 16.6%(2) 17.28% (2) 12% (2) Non-text images 16.67% (1) 3.33% (2) 10.83% (1) 23.12% (1) 20% (1)
1NN 3NN 5NN 7NN SVM
Gabor Text-based images 17.25% (5) 16.06% (7) 13.5% (9) 14% (8) 32.37% (4) Non-text images 8.33% (2) 8.33% (2) 8.33% (2) 0% (3) 25% (2) Wavelet Text-based images 18.56% (7) 11.81% (9) 9.69% (11) 14.12% (9) 20.44% (6) Non-text images 25% (2) 41.67% (1) 50% (1) 0% (3) 41.67% (1) Gabor – HCS 2 Text-based images 29.31% (4) 11.44% (6) 14.7% (7) 12.75% (8) 13% (9) Non-text images 16.67%(2) 11.11%(2) 0%(3) 0%(3) 0%(3) Wavelet – HCS 2 Text-based images 20.31% (7) 13.63% (8) 8.1% (10) 7.1% (11) 8.6% (9) Non-text images 16.67% (1) 3.33% (2) 10.83% (1) 23.12% (1) 20% (1)
Table 9 Non-hierarchical classification vs. HCS 2
Similar to the finding of Section 4.3.1, for the first level and overall classification accuracy the flat non-hierarchical classification scheme performs better than the two hierarchical classification schemes based on the 9 tiling schemes.
5. CONCLUSION
Automatically classifying various types of digital accounting documents is a hard problem. As flat non-hierarchical and hierarchical classification can be used for document classification, much related work only focuses on text-only classification. In this paper, different classification schemes were compared for digital accounting documents. The experimental results show that non-hierarchical classification provides higher accuracy than hierarchical classification. It is apposed to related work of hierarchical text-only document classification. This may be because the domain problem of text-only classification contains larger numbers of categories to be classified.
In addition, the Gabor filters and wavelet texture features are better for text-only images (and hybrid images) and non-text image documents respectively. This could be an implication for future work to design a mechanism to combine both features for the final classification output.
Another issue to be noted is digital accounting document segmentation. One future research direction is to well segment various types of digital accounting documents to improve classification accuracy.
6. REFERENCES
ADAMI, G.; AVESANI, P.; SONA, D. (2003): “Bootstrapping for hierarchical document classification”. Paper presented at the ACM International Conference on
Information Knowledge Management, New York, USA, Nov. 2-8, pp. 295-302.
AGNELLI, D.; BOLLINI, A.; LOMBARDI, L. (2002): “Image classification: an evolutionary approach”. Pattern Recognition Letters, vol. 23, pp. 303-309.
BITLIS, B.; FENG, X.; HARRIS, J.L.; POLLAK, I.; BOUMAN, C.A.; HARPER, M.P.; ALLEBACH, J.P. (2004): “A hierarchical document description and comparison method”. Paper presented at IS&T’s 2004 Archiving Conference, San Antonio, Texas, April 20, pp. 195-198.
BYUN, H.; LEE, S.-W. (2003): “A survey on pattern recognition applications of support vector machines”. International Journal of Pattern Recognition and
Artificial Intelligence, vol. 17, no. 3, pp. 459-486.
CAI, L.; HOFMANN, T. (2004): “Hierarchical document categorization with support vector machines”. Paper presented at the International Conference on
Information and Knowledge Management, Washington, DC, USA, Nov. 8-13, pp.
78-87.
CHEN, Y.; Wang, J.Z. (2004): “Image categorization by learning and reasoning with regions”. Journal of Machine Learning Research, vol. 5, pp. 913-939.
CONCI, A.; CASTRO, E.M.M.M. (2002): “Image mining by content”. Expert
Systems with Applications, vol. 23, pp. 377-383.
DAUBECHIES, I. (1992): Ten Lectures on Wavelets. Society for Industrial and Applied Mathematics, Philadelphia.
DILIGENTI, M.; FRASCONI, P.; GORI, M. (2003): “Hidden tree Markov models for document image classification”. IEEE Transactions on Pattern Analysis and
Machine Intelligence, vol. 25, no. 4, pp. 519-523.
DUDA, R.O.; HART, P.E.; STORK, D.G. (2001): Pattern Classification, 2nd Edition. John Wiley, New York.
GRIGORESCU, S.E.; PETKOV, N.; KRUIZINGA, P. (2002): “Comparison of texture features based on Gabor filters”. IEEE Transactions on Image Processing,
vol. 11, no. 10, pp. 1160-1167.
GROSKY, W.I. (1997): “Managing multimedia information in database systems”.
Communications of the ACM, vol. 40, no. 12, pp. 72-80.
JAHNE, B. (1995): Digital Image Processing: Concepts, Algorithms, and Scientific
Applications. Springer-Verlag.
JAIN, A.K.; BHATTACHARJEE, S. (1992): “Text segmentation using Gabor filters for automatic document processing”. Machine Vision and Applications, vol. 5, no. 3, pp. 169-184.
JAIN, A.K.; DUIN, R.P.W.; MAO, J. (2000): “Statistical pattern recognition: a review”. IEEE Transitions on Pattern Analysis and Machine Intelligence, vol. 22, no. 1, pp. 4-37.
KLOPTCHENKO, A.; MAGNUSSON, C.; BACK, B.; VISA, A.; VANHARANTA, H. (2004): “Mining textural contents of financial reports”. International Journal of
Digital Accounting Research, vol. 4, no. 7, pp. 1-32.
LEBOURGEOIS, F.; SOUAFI-BENSAFI, S.; DUONG, J.; PARIZEAU, M.; COTE, M.; EMPTOZ, H. (2001): “Using statistical models in document images understanding”. Paper presented at the International Workshop on Document
Layout Interpretation and its Applications, Seattle, USA, Sep. 9.
MCKIE, S. (1998): The accounting software handbook. 29th Street Press, Texas. MITCHELL, T. (1997): Machine Learning. McGraw Hill, New York.
PUNERA, K.; RAJAN, S.; GHOSH, J. (2005): “Automatically learning document taxonomies for hierarchical classification”. Paper presented at the International
World Wide Web Conference, Chiba, Japan, May 10-14, pp. 1010-1011.
SHIN, C.; DOERMANN, D. (2006): “Document page image classification based on similarity of visual appearance”. Paper presented at the IASTED International
Conference on Signal and Image Processing, Honolulu, Hawaii, USA, Aug. 14-16.
SHIN, C.; DOERMANN, D. (2000): “Classification of document page images based on visual similarity of layout structures”. Paper presented at the SPIE
Document Recognition and Retrieval VII 3967, San Jose, USA, Jan. 22-28, pp.
TSAI, C.-F. (2007): “Image mining by spectral features: a case study of scenery image classification”. Expert Systems with Applications, vol. 32, no. 1, pp. 135-142.
TUCERYAN, M.; JAIN, A.K. (1998): “Texture analysis”. In The Handbook of
Pattern Recognition and Computer Vision, 2nd Edition. Chen, C.H., Pau, L.F., and
Wang, P. S. P. (Eds.), World Scientific, Singapore.
VEERAMACHANENI, S.; SONA, D.; AVESANI, P. (2005): “Hierarchical dirichlet model for document classification”. Paper presented at the International