Synchrotron-Based Data-Constrained Modeling Analysis
of Microscopic Mineral Distributions in Limestone
Yudan Wang1, Yushuang Yang2*, Tiqiao Xiao1*, Keyu Liu3,4, Ben Clennell3, Guoqiang Zhang1, Haipeng Wang5
1Shanghai Institute of Applied Physics, Chinese Academy of Sciences, Shanghai, China
2Materials Science & Engineering, Commonwealth Scientific and Industrial Research Organization, Clayton, Australia 3Earth Science & Resource Engineering, Commonwealth Scientific and Industrial Research Organization, Bentley, Australia
4Research Institute of Petroleum Exploration and Development, PetroChina, Beijing, China 5College of Physics & Electronics Engineering, Shanxi University, Taiyuan, China
Email: *[email protected], *[email protected]
Received November 9, 2012; revised December 16, 2012; accepted January 17, 2013
ABSTRACT
Three dimensional (3D) microscopic distributions of dolomite and calcite in a limestone sample have been analyzed with a data-constrained modeling (DCM) technique using synchrotron radiation-based multi-energy X-ray computed tomography (CT) data as constraints. In order to optimize the experimental parameters, X-ray CT simulations and DCM analysis of a numerical phantom consisting of calcite (CaCO3) and dolomite (CaMg(CO3)2) have been used to investi-gate the effects on the predicted results in relation to noise, X-ray energy and sample-to-detector distance (SDD). The simulation results indicate that the optimal X-ray energies are 25 and 35 keVs, and the SDD is 10 mm. The high resolu-tion 3D distriburesolu-tions of mineral phases of a natural limestone have been obtained. The results are useful for quantitative understanding of mineral, porosity, and physical property distributions in relation to oil and gas reservoirs hosted in carbonate rocks, which account for more than half of the world’s conventional hydrocarbon resources. The case studied is also instructive for the applicability of the DCM methods for other types of composite materials with modest atomic number contrasts between the mineral phases.
Keywords: X-Ray Computed Tomography (CT); Synchrotron Radiation (SR); Data-Constrained Modeling (DCM);
Microstructure; Limestone
1. Introduction
Knowledge of three dimensional (3D) material distribu-tions for hydrocarbon reservoir limestone at microscopic length scales is important in understanding their me-chanical and hydrological properties in relation to oil and gas production and carbon dioxide (CO2) geo-sequestra- tion. Traditional methods such as optical and scanning electron microscopy are common tools for providing valuable information of microstructures, for quantitative modeling investigations on microstructure/property rela-tionship of various materials [1-3]. However, those sur-face observations are often inadequate in obtaining de-tailed 3D information of the sample, such as composi-tional distribution inside limestone. A sample-destructive direct 3D analytical method is serial sectioning [4-6]. Nevertheless, the materials between sections are de-stroyed with only the serial sectioned images remaining.
X-ray computed tomography (CT) is a non-destructive method that provides sectional X-ray attenuation images
(CT images) of objects. The synchrotron radiation (SR) source provides energy-tunable, monochromatized, and naturally collimated X-ray beams that have many advan-tages for CT. Monochromatized beams eliminate beam hardening, which causes CT image artifacts, and thus permit CT values to relate quantitatively to X-ray linear attenuation coefficients. Furthermore, the synchrotron- based X-ray CT has the advantage of high spatial resolu-tion and has been widely used in characterizaresolu-tion of in-ternal structures of a diverse range of materials in bio-logical, medical, materials science and geoscience [7-11]. However, as different compositions of materials may exhibit similar X-ray absorption and refraction charac-teristics, it is often inadequate to resolve material com-positions. A data-constrained modelling (DCM) method-ology has been developed for characterising composi-tional microstructures using two or more CT datasets acquired with different X-ray spectra and incorporates them as model constraints [12-14]. For instance, the ef-fect of nano-porous regions or partially occupied voxels can be identified. The advantage of the DCM approach
includes its capability in resolving partial occupancy of multiple material compositions at the voxel level sample- non-destructively. Such partial occupancy accounts for the effects below normal CT resolution. The DCM approach has been successfully applied to characterize and predict the microstructure of a range of different materials inclu- ding: the distribution of corrosion inhibitor particles in aerospace paint primers [15,16], zinc corrosion product distributions [17], gold particle distributions in nano-stru- ctured functional materials [18], and mineral phases distri- butions in hydrocarbon reservoir sandstones [19,20].
In this article, we have applied high-resolution multi- spectrum X-ray CT technique combined with a DCM approach to study a natural carbonate (limestone) sample containing predominantly calcite (CaCO3) and dolomite (CaMg(CO3)2) mineral phases. The quantitative effects of experimental parameters on prediction accuracy and noise immunity have been studied using simulated nu-merical phantoms. The optimal experimental parameters and credibility of prediction for each material in the sample have been analyzed. X-ray CT experiments were performed at X-ray Imaging and Biomedical Application (BL13W) beamline at the Shanghai Synchrotron Radia-tion Facility (SSRF). The 3D distribuRadia-tion maps of min-eral phases in the sample with high resolution were ob-tained with DCM.
2. Simulation Analysis of Numerical
Phantoms
This section is focused on evaluation of the impacts of experimental variables on X-ray CT attenuation map and DCM composition map reconstruction accuracies. The evaluation is conducted with a numerical phantom with 512 × 512 × 32 voxels (a voxel has a size of 3.7 × 3.7 × 3.7 µm3), as shown in
Figure 1. The numerical phantom
was divided into sub-regions which were comprised of different proportions of calcite and dolomite with the volume fraction step of 10%. From the left to right and the bottom to up, the volume fractions of calcite are 100%, 90%, 80%, 70%, 60%, 50%, 50%, 40%, 30%, 20%, 10% and 0%. The remainders of the cylinders are dolomite. The minerals in the phantom include calcite and dolomite, as listed in Table 1.
Projection images of the phantom have been simulated withmonochromatic parallel beams at X-ray energies of 25 keV, 30 keV, 35 keV and 38 keV. The sample-to-
detector distances (SDDs) were set to 10 mm, 100 mm and 200 mm. At each discrete combination of X-ray en-ergy and SDD, 360 projections over a total rotation angle of 180◦ were obtained with a 0.5˚ angular step between projections. The projection images correspond mathe-matically to the Radom transforms of the phantom with X-ray absorption and refraction. The images contain phase-contrast effects for non-zero SDD. That is, the pro- jection images recorded by the detector were intensity im- ages of the sample after Fresnel propagation at a distance of SDD. For purpose of comparison, a zero SDD case was simulated, although it cannot be achieved in practice.
In order to investigate the effect of noise, various lev-els of Gaussian noise were added to the simulated X-ray projections at levels of 0.1%, 0.2%, 0.5%, 1%, 1.5% and 2%. The actual experimental noise level was also used to simulate the projection images. The measured experi-mental standard deviation values were 1.21% at 25 keV, 1.15% at 30 keV, 1.17% at 35 keV and 1.72% at 38 keV.
After the simulated projections were obtained, images were subjected to phase-retrieval processing prior to to-mographic reconstruction. Phase-retrieval processing was a result of the phase-contrast imaging mode which exhibited an apparent improvement in signal-to-noise level. The resulting tomographic cross sections resemble those from a conventional micro-CT. Slices of X-ray
[image:2.595.323.523.407.606.2]Figure 1. The simulated numerical phantom with various proportions of calcite and dolomite (the volume fraction step is 10%).
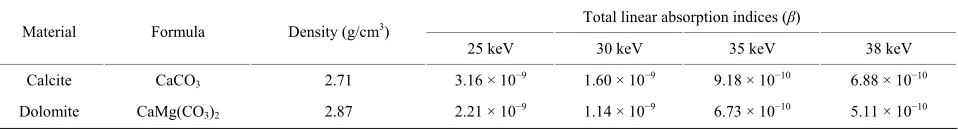
Table 1. The total linear absorption indices (β) of calcite and dolomite at the energies of 25 keV, 30 keV, 35 keV and 38 keV.
Total linear absorption indices (β) Material Formula Density (g/cm3)
25 keV 30 keV 35 keV 38 keV Calcite CaCO3 2.71 3.16 × 10⁻⁹ 1.60 × 10⁻⁹ 9.18 × 10⁻¹⁰ 6.88 × 10⁻¹⁰
Dolomite CaMg(CO3)2 2.87 2.21 × 10⁻⁹ 1.14 × 10⁻⁹ 6.73 × 10⁻¹⁰ 5.11 × 10⁻¹⁰
[image:2.595.60.539.672.737.2]attenuation information at a given X-ray energy were obtained by using the filtered back-projection algorithm as the CT reconstruction method.
The DCM linear optimization approach was then used to reconstruct the compositional maps. On each voxel at position i, the DCM approach [19,20] can be expressed as
, , ,
0 , , 1
1
por cal dol
i i i
por cal dol
i i i
por por cal cal dol dol
i E i i E i i E i i E
v v v
v v v
v v v
, ,EE E1, 2,
(1)
where ipor, vi and i denote for the volume
fractions for pore, calcite and dolomite respectively;
v cal v dol
,
i E
is the absorption indices in reconstructed slices at the X-ray beam energy of E; and i E, , i E, and
,
i E are the absorption indices for pore, calcite and
dolomite at the X-ray beam energy of E respectively [20]. Equation (1) constitutes a linear optimization problem with non-negativity constraints. It is solved using the DCM software with the Simplex algorithm [21]. The solutions of the values
por
cal
dol
por i
v , and i for all
voxels form a predicted compositional map of the origi-nal phantom. For each discrete combination of SDD and noise level, a DCM predicted 3D set of images was ob-tained.
cal i
v vdol
In order to evaluate the performance of multi-energy X-ray CT and DCM under different experimental condi-tions, the normalized cross-correlation (NCC) between the predicted image and the original volume fractions for each material was calculated
1 1 1N p p
i i
i
N p p N
i i
i i
v v v
C v v
2
2 1 2o o o o v v v (2)
where p
i and i are DCM-predicted and original
volume fraction values of the material at ith voxel re-spectively, while
v v o
p
v and v o are their mean values.
The NCC represents a template matching of two datasets, which means that a higher NCC value corresponds to a closer match between the predicted image and the real sample.
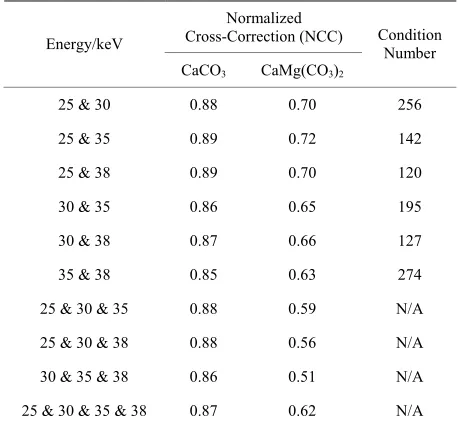
Table 2 shows the NCC values at different energy
combinations and a SDD of 10 mm at experimental noise level and the condition numbers [21] of the coefficient matrix in Equation (1). From Table 2, it is shown that the
[image:3.595.308.537.123.336.2]best X-ray energy combination for the limestone sample is at 25 keV and 35 keV. This is different from the en-ergy combination at 25 keV and 38 keV which gives the smallest condition number. The discrepancy is due to the fact that in this paper, it is assumed that the noise level is the same for projection images at different X-ray beam
Table 2. The NCCs at different energy combinations at SDD of 10 mm and the condition numbers of the coefficient matrix in Equation (1).
Normalized Cross-Correction (NCC) Energy/keV
CaCO3 CaMg(CO3)2
Condition Number
25 & 30 0.88 0.70 256 25 & 35 0.89 0.72 142 25 & 38 0.89 0.70 120 30 & 35 0.86 0.65 195 30 & 38 0.87 0.66 127 35 & 38 0.85 0.63 274 25 & 30 & 35 0.88 0.59 N/A 25 & 30 & 38 0.88 0.56 N/A 30 & 35 & 38 0.86 0.51 N/A 25 & 30 & 35 & 38 0.87 0.62 N/A
energies. The estimation with the matrix condition num-ber has an implicit assumption that the noise level is the same with the CT reconstructed absorption indices [18].
The above analysis uses 2 sets of CT data. In order to know whether the accuracy would be improved with ad-ditional sets of CT data at other X-ray energies, we also included 3 and 4 sets of CT data as shown in Table 2.
Instead of improvement, inclusion of additional data set has shown a decrease in prediction accuracy. This could be related to the fact that the data sets have a low degree of linear independence as suggested by the relatively large condition number. Separate datasets may have dif-ferent zero offset due to experimental noise. Further in-vestigations are required to fully understand the phe-nomena.
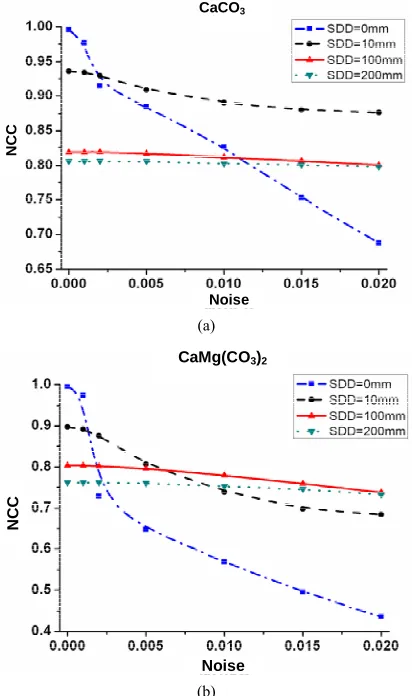
Figure 2 shows that the NCC values decrease with
noise level for fixed values of X-ray beam energy and SDDs. This is expected as the DCM reconstruction ac-curacy decreases with increasing noise. The figure also indicates that the reconstruction accuracy is very sensi-tive to noise for small SDD. This is particularly true at SDD = 0 mm. The noise immunity increases at higher values of SDD. Figure 3 shows the relation between
SDD and NCC at beam energies of 25 keV & 35 keV and at the experimental noise level. In the figure, the solid line is for calcite and the dashed line is for dolomite. It has been observed that the NCC value first increases and then decreases with SDD. From Figures 2 and 3,
CaCO3
Noise
NCC
NCC
(a)
CaMg(CO3)2
Noise
NC
C
[image:4.595.311.534.84.263.2](b)
Figure 2. The graph of the NCC at 25 keV & 35 keV at a series of SDDs as a function of the noise.
retrieval processing was applied to the non-zero SDD case which could improve the signal-to-noise of the CT reconstructions. When SDD takes higher values, NCC reaches a maximum then decreases with increasing SDD. This is because a larger SDD induces a higher level of Fresnel diffraction and edge enhancement effect, which will affect the reconstructed absorption indices [22]. The noise level is usually in the range of 1% to 2% in the experiment. From Figure 2, the NCC at SDD of 10 mm
reaches its highest value for calcite, while for dolomite the maximum NCC is obtained at a SDD of 100 mm.
Figure 3 also shows that the best SDDs for calcite and
dolomite are found to be 10 mm and 100 mm respec-tively, consistent with the analysis above. For a sample composed of both calcite and dolomite, the optimal SDD is the one that gives the highest value of NCC. Figures 2
and 3 indicate that the optimal SDD is 10 mm.
3. DCM Characterization of a Limestone
Sample
The natural limestone sample used for experiments
SDD/mm
Figure 3. The relation of SDD and NCC at 25 keV & 35 keV at experimental noise.
consists of calcite and dolomite. In this rock, the two minerals were distinct, and can be well differentiated by electron microscopy incorporating back-scattered elec-tron contrast. This provided a good basis for quantifying the success of the X-ray based methods. The limestone sample was from the Triassic Feixianguan (T1f) Forma-tion from the Zhujia-1 well (5578.7 m) in the north- eastern Sichuan Basin, South China. The Feixianguan Formation was a major reservoir interval in the basin and hosts a number of gas fields including the giant Puguang Gas Field. T1f was deposited as inter-bedded oolitic limestone and calcareous marl in a restricted marine (la-goonal) environment associated with gypsum deposition on a carbonate platform margin [23]. Multiple dolomiti-sation occurred during the post depositional diagenesis [24]. For high resolution imaging, a cylindrical plug was prepared with a diameter of about 3.5 mm.
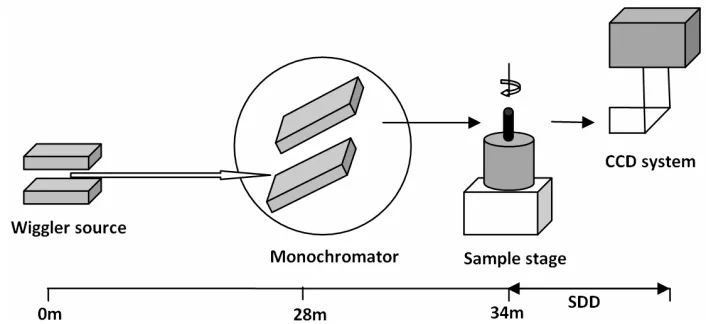
The X-ray micro-tomography experiments were car-ried out at BL13W beamline at SSRF in Shanghai, China. Micro-tomography is composed of an X-ray source, a sample stage, a double-crystal monochromator and a charge-coupled device (CCD) system, as shown in
Fig-ure 4. BL13W is a wiggler beamline producing
mono-chromatic X-rays with a flux density of ~3.4 × 10¹⁰ pho-tons/s/mm2@20 keV and narrow energy band pass (ΔE/E < 5 × 10⁻³, where E is the photon energy) by an Si(111) double-crystal monochromator. As suggested by the simulation results in the previous section, X-ray energies were set to 25 keV and 35 keV and SDD was chosen as 10 mm. An Optique Peter X-ray CCD detector was used to acquire images, which has a native pixel size of 7.4 × 7.4 µm2. Combined with a 2× optical lens, it has pro-vided an effective isotropic voxel with a 3.7 µm edge. For each X-ray beam energy, 1080 projection images were acquired with a 0.167˚ angular spacing between each view. For background correction, flat-field images
[image:4.595.69.275.86.434.2]Figure 4. A schematic of the micro CT system at BL13W of SSRF used in the present experiments.
of direct X-ray beams were measured with no sample for every ten degrees during the sample scanning to correct for time decay of the X-ray intensity. Dark current of the detector system was measured after the CT measurement for correction of the images. The exposure time was 1.5 seconds at both 25 keV and 35 keV beam energies.
The CT slices were reconstructed using the X-TRACT software package [25]. Background corrections were applied using flat-field and dark-current images. Figure 5 is a typical projection image after background
[image:5.595.320.528.271.407.2]correc-tion at 35keV at SDD of 10 mm. Image normalizacorrec-tion was performed to compensate the uneven beam within the image field. Next, the normalized images were sub-ject to Paganin’s phase-retrieval processing prior to to-mographic reconstruction. Paganin’s phase-retrieval al-gorithm was applied with parameters tuned to optimize the signal-to-noise and minimize the edge enhancement without loss of resolution [26]. Finally, the slices were reconstructed by using the method of filtered back-pro- jection of parallel X-ray beam. Since there were some ring artifacts in the slices, a ring artifacts correction based on polar coordinate transformation was performed for these slices. After that, image alignment of data sets for the two slices at different energies was achieved by translation and rotation of slices to maximise the cross- correlations between corresponding images. The proc-essed slices so produced, containing information of ab-sorption indices were used for further analysis by using the DCM method.
Figure 5. A typical projection image after background cor-rection at 35 keV at SDD of 10 mm.
10−11, respectively. The reconstructed attenuation values were lower than that expected for the two material phases. The discrepancy may be caused by a number of factors including the point-spread function (PSF) of the imaging system, which is induced by source size, the PSF of de-tector, the geometry of the system and so on [27]. The CT reconstructed absorption coefficients were corrected by linear rescaling of the reconstructed slices and shifting of pores values. The CT datasets for both beam energies of 25 keV and 35 keV have been rescaled by a multipli-cation factor of 1.1, whilst the shifting of pores values for the 25 keV and 35 keV beam energies are 8 × 10⁻¹¹ and
−6 × 10⁻¹¹, respectively.
Using the above two CT datasets as constraints, a DCM linear optimization approach was used to obtain compositional distributions of calcite and dolomite [19]. The mineral phases of the slice (Slice 500) with the size of 1119 × 1080 pixels were obtained. The distributions of dolomite and calcite have been extracted from the sample, as shown in Figures 7(a) and (b), respectively. The pixel
intensities in these figures denote the volume fractions of the corresponding mineral phases. The DCM calculated 3D compositional distributions of dolomite and calcite on a cubic grid of 500 × 500 × 300 pixels inside the sample A typical slice (Slice 500) at 35 keV and its histogram
are shown in Figures 6(a) and (b), respectively. There
(a)
(a)
β value
hi
s
to
gr
am
[image:6.595.343.502.82.417.2](b)
Figure 6. A typical X-ray CT reconstructed slice (slice 500) at 35 keV at SDD of 10 mm.
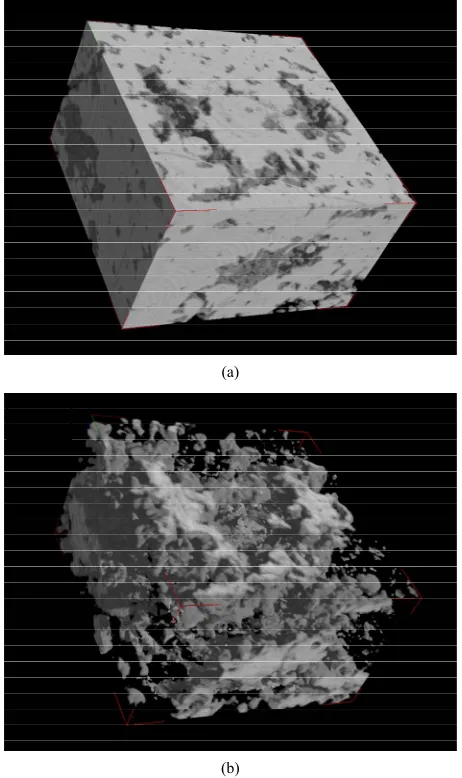
are shown in Figures 8(a) and (b), respectively.
It is shown in Figures 7 and 8 that a fraction of calcite
formed clusters inside dolomite, and pores was concen-trated in some parts of the sample. The figures also indi-cate that there was a significant proportion of pores and dolomite which were smaller than the CT resolution (3.7 µm), which is shown as unsaturated pixel intensity for images. The volume fractions of calcite, dolomite and pores were calculated as average voxel values. In the part of the sample shown in Figure 8, their values are 15%,
81% and 4%, respectively. The correct value of porosity and the correct assignment of the pores within the 3D volume is very important for the computation of rock properties such as fluid permeability and elastic constants, which are important for exploitation of carbonate oil and gas reservoirs.
4. Conclusions
Microscopic 3D distributions of calcite and dolomite in a limestone sample were studied with a data-constrained modeling (DCM) approach using multi-spectrum quanti-
(a)
[image:6.595.60.284.83.432.2](b)
Figure 7. Distribution of mineral phases on the same X-Y plane (slice 500) as in Figure 6, (a) is dolomite and (b) is calcite.
tative X-ray CT data as model constraints. A simulated numerical phantom with various ratios of calcite and dolomite was used to investigate noise sensitivity, effects of X-ray beam energy and sample-to-detector distance (SDD). The simulation results show that the prediction accuracy decreases with increasing noise, the optimal compromise for SDD is 10 mm and the optimal X-ray energies are 25 keV and 35 keV which were selected as the experimental distance and energies. The optimized parameters are useful for future analysis of the micro-structures of similar samples.
A natural limestone sample was prepared and syn-chrotron-based monochromatic multi-energy X-ray CT experiments have been carried out at SSRF with parame-ters of X-ray beam energies at 25 keV and 35 keV and SDD at 10 mm as simulated. DCM characterisation of the microscopic distribution of mineral phases was ob-tained from multi-energy quantitative X-ray CT recon-structed image sets. The results indicated that the pore was concentrated in some parts of the sample, and a proportion of pores and dolomite had sizes smaller than the CT resolution. It has been demonstrated that by using
(a)
[image:7.595.57.288.86.475.2](b)
Figure 8. The three dimensional compositional distribution of part of sample, (a) is dolomite and (b) is calcite.
multiple energies X-ray CT and the DCM method, a segmentation for mineral phases and pore space could be achieved. The DCM method enables us to visualize the distribution not only of discrete, resolved pores, but also regions of calcite and dolomite minerals that are mi-cro-porous. The investigation has demonstrated that the method is a powerful tool for quantitative analysis of geological samples with complex mineralogy where the single energy X-ray tomography method fails to produce an adequately segmented rock volume.
5. Acknowledgements
Y. D. Wang would like to acknowledge sponsorship by the Chinese Scholarship Council (CSC) and hospitality by CSIRO Material Science & Engineering Division during which this work has been carried out. Y. S. Yang would like to acknowledge support by the One Hundred Person Project of Shanxi Province. The authors would
also like to acknowledge support by the CSIRO Ad-vanced Materials and Computational and Simulation Science Transformational Capability Platforms (AM-TCP and CSS-TCP).
REFERENCES
[1] H. Andersson and C. Persson, “In-Situ SEM Study of Fatigue Crack Growth Behaviour in IN718,” Interna- tional Journal of Fatigue, Vol. 26, No. 3, 2004, pp. 211- 219. doi:10.1016/S0142-1123(03)00172-5
[2] C. Motz and R. Pippan, “Fracture Behaviour and Fracture Toughness of Ductile Closed-Cell Metallic Foams,” Acta Materialia, Vol. 50, No. 8, 2002, pp. 2013-2033. doi:10.1016/S1359-6454(02)00047-2
[3] L. H. Qian, H. Toda, S. Morita, T. Kobayashi and Z. G. Wang, “In-Situ Observations of Fracture Processes in 0.6 μm and 9.5 μm SiCP/6061Al Composites,” Materials Transactions, Vol. 46, No. 1, 2005, pp. 34-41.
doi:10.2320/matertrans.46.34
[4] D. N. Bryon, M. P. Atherton and R. H. Hunter, “The In- terpretation of Granitic Textures from Serial Thin Sec- tioning, Image-Analysis and 3-Dimensional Reconstruc- tion,” Mineralogical Magazine, Vol. 59, No. 395, 1995, pp. 203-211. doi:10.1180/minmag.1995.059.395.05 [5] R. Marschallinger, “Correction of Geometric Errors As-
sociated with the 3-D Reconstruction of Geological Ma- terials by Precision Serial Lapping,” Mineralogical Ma- gazine, Vol. 62, No. 6, 1998, pp. 783-792.
doi:10.1180/002646198548160
[6] A. Mock and D. A. Jerram, “Crystal Size Distributions (CSD) in Three Dimensions: Insights from the 3D Re- construction of a Highly Porphyritic Rhyolite,” Journal of Petrology, Vol. 46, No. 8, 2005, pp. 1525-1541. doi:10.1093/petrology/egi024
[7] L. Qian, H. Toda, K. Uesugi, M. Kobayashi and T. Ko- bayashi, “Direct Observation and Image-Based Simula-n tion of Three-Dimensional Tortuous Crack Evolution in- side Opaque Materials,” Physical Review Letters, Vol. 100, No. 11, 2008, p. 115505.
doi:10.1103/PhysRevLett.100.115505
[8] T. Q. Xiao, R. C. Chen, H. L. Xie, L. Rigon, R. Longo and E. Castelli, “Phase Retrieval in Quantitative X-Ray Microtomography with a Single Sample-to-Detector Dis- tance,” Optics Letters, Vol. 36, No. 9, 2011, pp. 1719- 1721. doi:10.1364/OL.36.001719
[9] T. Q. Xiao, S. M. Shi, R. C. Chen, Y. L. Xue, Y. Q. Ren, G. H. Du, B. Deng and H. L. Xie, “X-Ray Microscopic Imaging of Low Z Material Wrapped by Strongly Ab- sorbing Medium,” Acta Physica Sinica, Vol. 57, No. 10, 2008, pp. 6319-6328.
Copyright © 2013 SciRes. IJG [11] S. Mayo, A. Stevenson, S. Wilkins, D. Gao, S. Mookhoek,
S. Meure, T. Hughes and J. Mardel, “X-Ray Phase-Con- trast Tomography for Quantitative Characterisation of Self-Healing Polymers,” The 7th Pacific Rim Interna- tional Conference on Advanced Materials and Processing, Vol. 654-656, 2010, pp. 2322-2325.
[12] S. Yang, S. Furman and A. Tulloh, “A Data-Constrained 3D Model for Material Compositional Microstructures,”
Advanced Materials Research, Vol. 32, 2008, pp. 267-
270. doi:10.4028/www.scientific.net/AMR.32.267 [13] Y. S. Yang, A. Tulloh, I. Cole, S. Furman and A. Hughes,
“A Data-Constrained Computational Model for Mor- phology Structures,” Journal of the Australian Ceramics Society, Vol. 43, No. 2, 2007, pp. 159-164.
[14] H. J. Vinegar and S. L. Wellington, “Tomographic Imag- ing of 3-Phase Flow Experiments,” Review of Scientific Instruments, Vol. 58, No. 1, 1987, pp. 96-107.
doi:10.1063/1.1139522
[15] S. Yang, D. C. Gao, T. Muster, A. Tulloh, S. Furman, S. Mayo and A. Trinchi, “Microstructure of a Paint Primer— A Data-Constrained Modeling Analysis,” The 7th Pacific Rim International Conference on Advanced Materials and Processing,Vol. 654-656, 2010, pp. 1686-1689. [16] S. C. Mayo, A. M. Tulloh, A. Trinchi and Y. S. Yang,
“Data-Constrained Microstructure Characterisation with Multi-Spectrum X-Ray,” Microscopy and Microanalysis, Vol. 18, No. 3, 2012, pp. 524-530.
doi:10.1017/S1431927612000323
[17] Y. Wang, Y. Yang, I. Cole, A. Trinchi and T. Xiao, “In- vestigation of the Microstructure of an Aqueously Cor- roded Zinc Wire by Data-Constrained Modelling with Multi-Energy X-Ray CT,” Materials and Corrosion, Vol. 64, No. 3, 2013, pp. 180-184.
[18] A. Trinchi, Y. Yang, J. Huang, P. Falcaro, D. Buso and L. Cao, “Study of 3D Composition in a Nanoscale Sample Using Data-Constrained Modelling and Multi-Energy X-Ray CT,” Modelling and Simulation in Materials Sci- ence and Engineering, Vol. 20, No. 1, 2012, p. 015013. doi:10.1088/0965-0393/20/1/015013
[19] Y. S. Yang, T. E. Gureyev, A. Tulloh, M. B. Clennell and M. Pervukhina, “Feasibility of a Data-Constrained Pre-
diction of Hydrocarbon Reservoir Sandstone Microstruc- tures,” Measurement Science & Technology, Vol. 21, No. 4, 2010, Article No. 047001.
[20] S. Yang and J. Taylor, “Model and Data Work Together to Reveal Microscopic Structures of Materials,” SPIE
Newsroom,2010.
[21] W. H. Press, S. A. Teukolsky, W. T. Vetterling and B. P. Flannery, “Numerical Recipes: The Art of Scientific Com- puting,” 3rd Edition,Cambridge University Press, 2007. [22] T. Xiao, A. Bergamaschi, D. Dreossi, R. Longo, A. Olivo,
S. Pani, L. Rigon, T. Rokvic, C. Venanzi and E. Castelli, “Effect of Spatial Coherence on Application of In-Line Phase Contrast Imaging to Synchrotron Radiation Mam- mography,” Nuclear Instruments and Methods in Physics Research Section A: Accelerators, Spectrometers, Detec- tors and Associated Equipment, Vol. 548, No. 1, 2005, pp. 155-162. doi:10.1016/j.nima.2005.03.083
[23] G. Y. Zhu, S. C. Zhang and Y. B. Liang, “Palaeo Envi- ronment and the Distribution of H2S in the Triassic Fei- xianguan (T1f) Formation, Northeastern Sichuan Basin, South China,” Journal of Petroleum Exploration and De- velopment, Vol. 32, No. 2, 2005, pp. 65-69.
[24] J. Zhang and Y. G. Wang, “Characteristics of the Car- bonate Evaporation Platform Margin Deposition of the Feixianguan Formation in the Hekou Region, Sichuan Basin,” Journal of Natural Gas Industry, Vol. 23, No. 2, 2003, pp. 19-22.
[25] T. E. Gureyev, Y. Nesterets, D. Ternovski, D. Thompson, S. W. Wilkins, A. W. Stevenson, A. Sakellariou and J. A. Taylor, “Toolbox for Advanced X-Ray Image Process- ing,” Vol. 8141, 2011, p. 81410B.
[26] D. Paganin, S. C. Mayo, T. E. Gureyev, P. R. Miller and S. W. Wilkins, “Simultaneous Phase and Amplitude Ex- traction from a Single Defocused Image of a Homogene- ous Object,” Journal of Microscopy-Oxford, Vol. 206, No. 1, 2002, pp. 33-40.
[27] Y. D. Wang, A. Stevenson, Y. S. Yang, A. Trinchi, S. Wilkins and T. Q. Xiao, “A Quantitative Study of Mono- chromatic X-Ray Transmission through Zinc Wires,”