Munich Personal RePEc Archive
Instrumental Variable Estimates of the
Effect of Management Practices on Firm
Performance in Korean Firms
Kang, Youngho and Chang, Jieun
Samsung Economic Research Institute, Southwestern Oklahoma
State University
4 September 2014
Instrumental Variable Estimates of the Effect of
Management Practices on Firm Performance in Korean Firms
*
September 2014
Youngho Kanga
Jieun Changb†
aSamsung Economic Research Institute, Republic of Korea bDepartment of Social Sciences, Southwestern Oklahoma State University
Abstract
To empirically examine the unbiased effect of management practice on firm productivity, this paper aims to suggest an instrumental variable approach, which requires less costly method. This study uses three firm-level instrumental variables such as the motivations for organizational reform, empowerment, and IT investment during the organizational reform. For empirical study, we use Korean manufacturing firm-level data that contains information on management score and financial statement. The results of the instrumental variable estimation show that better management practice leads to higher level of firm productivity statistically significantly, while the effect of management practices is statistically insignificant in the ordinary least square estimation.
*The views expressed herein are those of the authors and do not necessarily reflect the views of the
1. Introduction
The astounding differences in productivity across firms have long been a topic of
interest for economists. Specifically, management practices are examined to explain such
differences. However, the field of economics profession has skepticism as to whether
management matters. Bloom et al. (2013) argued that this skepticism stems from the
difficulty of measuring management practices and of identifying its effects on productivity as
a result of endogeneity. The former has been addressed by recent studies that emphasized the
measurable aspects of management practices (Bloom and Van Reenen, 2007, 2009, 2011;
Bloom et al., 2010, 2013). Therefore, this paper suggests instrumental variable approach to
deal with the latter.
There are some seminal studies to avoid endogeneity problem. To examine the
unbiased effects of management practice on firm productivity, Bloom and Van Reenen
(2006) used competition and primogeniture measures to instrument for management scores.1
This is because the competitive and legal environments are independent of the other factors
that affect management practices, at least in the short run. Alternatively, Bloom et al. (2013)
suggests a randomized experiment as addressing endogeneity problem. They implemented a
randomized experiment that provided managerial consulting services to textile plants in India,
and therefore provided the first experimental evidence that management practices matters.
Since managerial consulting services were randomly assigned, their results would avoid the
endogeneity problem. These studies suggested the positive effects of management practices
on firm performance. However, primogeniture is not a firm-level instrumental variable, and
random assignment is a very costly method that requires repetitive survey.
This paper aims to suggest a firm-level and less costly instrumental variable approach
to empirically examine the effects of management practices on firm-level productivity. The
firm-level instrumental variables used in this paper are obtained from retrospective questions
in survey of management practice, which is expected to reduce financial costs.
The layout of this paper is as follows. Section 2 discusses the methods used to
measure management practices across firms, the empirical model employed, and the
econometric issues associated with the assessment of the impacts of management practices on
firm productivity. Section 3 presents the empirical results obtained using the firm-level
instrumental variable estimation. Section 4 concludes the paper.
2. Estimation Strategy
2.1 Model Specification and Data
The following estimation equation is constructed to empirically examine the impact
of management practices on firm-level total factor productivity (TFP).
, i i i
i M X
Y (1)
where i is a firm index; Yi is firm-level TFP; Mi is the score of management practices;
i
X is a vector of control variables, including export intensity, research and development
(R&D) intensity, and industry dummies; and i is the error term.
To estimate the equation (1), this paper uses the dataset surveyed by the Samsung
Economic Research Institute in 2011. Based on Miyagawa et al. (2010), this survey was
designed to evaluate management practices in the listed manufacturing firms in Korea.2 To
focus on specific management practices, this survey was restricted to organizational
management and human resources management.3 In particular, organizational management
covers topics such as the permeation of management principles and the implementation of
2 Miyagawa et al (2011) have attempted to measure Korean and Japanese firm management practices in 2007, following Bloom and Van Reenen (2007).
organizational goals. The questions on human resource management include promotion
practices, methods of employee performance assessment, manpower retention, evaluations of
the interpersonal skills of managers, and human resources training, including on-the-job
training. The questionnaire was sent to all 855 of the listed firms in 2011. Responses were
received from 399 for a response rate of 46.7%.4 Since the sample of firm was extracted
from the listed firms, we can use information on not only the management practices but also
the annual financial statement such as value added, fixed assets and total number of workers
provided the Korean Information Service (KIS), a leading credit-rating agency in Korea.
Management practice scores (Mi), our interest of variable, were calculated as follows.
This survey includes seven categories in organizational management and eight categories in
human capital management.5 Each category contained three sub-questions; if a response to
the first question was negative, one point was assigned and the respondent moved to the next
category. If a response to the first question was positive, two points were assigned, and the
respondent proceeded to the second question. If the respondent gave a positive response to
the second question, three points were assigned and the respondent moved on to the final
question. Four points were assigned to a positive response to the final question, whereas three
points were assigned to a negative response. Therefore, the maximum score is 60 (15 × 4).
For convenience, we convert the scale of scores from 1 ~ 60 to 1 ~ 100.
Measuring firm-level TFP (Yi), the dependent variable, has the issue of endogeneity
problem of capital variable. To address this issue, this paper uses Levinsohn and Petrin
(2003) approach that requires panel dataset and uses electricity costs as the instrumental
variable for capital. Although the survey was conducted in just 2011, we can identify TFP
through Levinsohn and Petrin (2003) estimation of production function from 2004 to 2011
4 According to Miyagawa et al. (2011), the response rates in previous studies on management practices and firm performance were 54% in the work of Bloom and Van Reenen (2007), 59.2% in South Korea and 52.8% in Japan in Miyagawa et al. (2011), and 10% in the study conducted by Ichikowshi (1999).
because this survey provides the annual series of firm-level financial statement thanks to
linking with KIS.6 We will extract the firm-level TFP in 2011 from the 2004-2011 series of
TFP to run regression for Equation (1). Note that Equation (1) is the cross-section analysis
because the survey for management practice was conducted in just 2011. Table 1 shows the
results of estimating the firm-level production function by three different estimators, OLS
(Ordinary Least Squares), Fixed-effects, and Levinsohn and Petrin (2003). Consistent with
Levinsohn and Petrin (2003), OLS coefficient on labor exceeds the Levinsohn and Petrin
estimates and the OLS estimate on capital is less than of Levinsohn and Petrin estimate.7
Additional control variables are added: export intensity, R&D intensity and industry
dummies. Export intensity is measured by the percentage of export sales to total sales. R&D
intensity is computed by the percentage of previous R&D investment to total sales. Table 2
summarizes the statistics of the variables.
2.2 Econometric Issues
The endogeneity problem may occur in the estimation of Equation (1) because the
decision of a firm to invest in the improvement of management practices may depend on its
current productivity. If this problem is not addressed, the OLS estimates are biased. Equation
(2) depicts the relationship between the true coefficient of and the estimated coefficient,
} var{
} ,
cov{ *
i i i OLS
M M
(2)
where OLSis the probability limits of the standard OLS and i* is yi Xii. The direction
6 “During 1997 – 2004, as the economy faced the financial crisis of 1997, the government implemented policy changes with regard to corporate governance including the chaebol (Park and Kim, 2008).” The crisis could lead to changes in corporate governance and business environment during this period. To avoid this period, we measure TFP of firms during 2004 - 2011.
7 Because the magnitude of each firm’s productivity shock varies over time and is not a constant fixed effect,
of bias can be determined by the covariance between management practice (Mi) and the
error term (i*), as indicated in Equation (2). For example, the positive correlation
correlation (Mi,i*) > 0 is observed if cash constrained firms can invest more resources in
the improvement of managerial practices as a result of high productivity. Moreover, an
upward bias occurs. If higher firm performance enabled managers to reduce their input of
efforts as in correlation (Mi,i*) < 0, the management practice coefficient can be biased
downward (Bloom and Van Reenen, 2006).8
The instrumental variable estimation can address endogeneity most effectively. We
suggest the set of variables related to past organizational reform as instrumental variables.
Category on past organization reform in the survey are consisted of four questions; the
implementation of organizational reform, motivation for organizational reform,
empowerment in organizational reform, and informational technology (IT) investment in
organizational reform. First, it asked whether the firms implement organizational reform
(“Has your company implemented organizational reform in the 1ast 10 years?”). The firms
which did so proceeded to the following questions: “What causes organizational reform in
your company?”, “Was decision-making authority given to those in a lower position as a
result of the organizational reform?”, and “Does your company increase IT investment in the
organizational reform process?”9
The instrumental variables must be both relevant and exogenous. First, we validated
relevance; that is, the instrumental variables should be related to management practice (Mi).
For this, we compare the distributions of management practice scores according to the value
of instrument variable. It could be ideal to show management practice scores during
8 As with the results of the study conducted by Bloom and Van Reenen (2006), high scores in management practice were attained when managers invested much time and effort in monitoring (the collection and processing of production information), target practice (the setting of coherent targets), the nurture of human resources through training, and promotion and hiring decisions.
organizational reform. However, data availability allows for management practice scores in
2011. To alternatively check the relevance, we assume that the management practice in a firm
is persistent across time unless a firm invests to improve management practice through
organizational reform. Figure 1 displays the kernel density estimates for the management
practice scores of the sampled firms in 2011. These scores are distributed according to reform
motivation in Panel (A), empowerment in Panel (B), and IT investment in Panel (C). Panels
(A)-(C) are similar in that the distribution of the management scores for firms that have not
implemented organizational reform lies to the left of the other two distributions. The highest
mean value of the distribution of management scores was reported by the group of firms that
implemented organizational reform regardless of performance in Panel (A), encouraged
empowerment during organizational reform in Panel (B), and invested in IT in the process of
reform in Panel (C). The Kolmogorov-Smirnov test was also used to determine the relevance
of instrumental variables given the null hypothesis of equality of the distributions of
management practice scores in Figure 1. The distribution on the right differs significantly
from the other distributions, which are presented as dashed lines in Panels (A), (B), and (C),
at the 5% level. Accordingly, these results indicate that the set of instrumental variables is
statistically and significantly associated with management practice scores, our variable of
interest.
Second, IVs should also be exogenous; that is, they should not affect TFP directly,
except through management practices. Since organizational reform was conducted prior to
the time t in the Equation (1), the time-precedence of organizational reform satisfied the
exogeneity condition. However, if the variables are persistent across time, the time
precedence is inadequate to justify the exogeneity. To support the exogeneity of instrumental
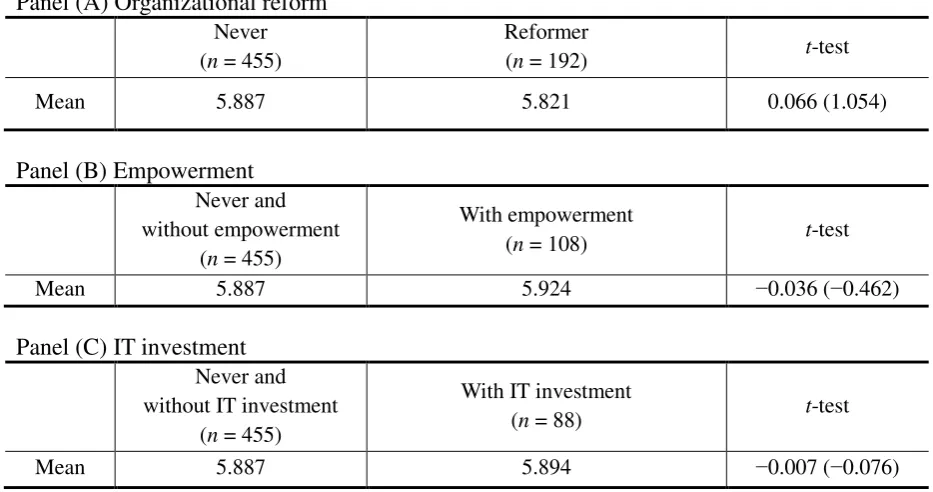
variables, Table 3 presents the t-test results for TFPs prior to the organizational reform. Panel
do not conduct organizational reform (“never”) and firms who conduct organizational reform
(“reformer”). As shown in Panel (B), the average TFP of reformers who conduct
empowerment (“with empowerment”) is not significantly different from that of “never” and
reformers who do not conduct any empowerment (“without empowerment”). TFP of
reformers who makes IT investment is not higher than that of “never” and reformers who do
not make IT investment in Panel (C) of Table 3. To assess the reliability of the instrumental
variable estimates, diagnostic tests are also conducted in the next section.
3. Estimation Results
Table 4 presents the estimated effects of management practices on TFP. The OLS
results in column (1) show that management practices are positively but insignificantly
associated with TFP. However, as discussed previously, the endogeneity problem may lead to
biased OLS estimates. To obtain reliable results, this paper uses the instrumental variable
approach.
In columns (2)-(4), the two-stage least square (2SLS) procedure is used to implement
the instrumental variable estimation. Column (2) includes motivations for organizational
reform and empowerment during organizational reform as the instrumental variables. The
third column has motivations for organizational reform and IT investment in organizational
reform for the instrumental variable. The fourth column includes all three instrumental
variables such as motivations, empowerment and IT investment. The coefficients of
management practice are positive and statistically significant at least at the 5% level from
columns (2)-(4). One point increase in management practice score increases firm-level TFP
by 4.6 percent in column (4). The relatively large 2SLS estimates demonstrate that OLS
result underestimates the effects of management practices on TFP.10 The direction of bias in
OLS estimates suggests negative feedback from firm performance to managerial effort.
Several diagnostic tests were conducted to assess the reliability of the instrumental
variable estimates. The first-stage F-statistics of the joint significance of the instruments were
used to check the relevance of the instruments. The rule of thumb in Staiger and Stock (1997)
was that the F-statistic should exceed ten. The first-stage F-statistics were above ten in this
study; that is, the instrumental variables are relevant. Moreover, to check the exogeneity of
the instrument, the Wu-Hausman test assesses whether instrumental variables are endogenous.
The insignificant test statistics in the columns (2)-(4) do not reject the null hypothesis of no
endogeneity. Additionally, the Hansen statistics of overidentification test support that the set
of instrumental variables are exogeneous.
4. Conclusion
This study has attempted to estimate the unbiased effect of management practices on
firm-level productivity. For this, we suggest an inexpensive way of obtaining firm-level
instrumental variables. The firm-level instrumental variables used in this study are identified
based on retrospective questions regarding organizational reform in the management practice
survey. The set of instrumental variables that we suggested has the advantage in that these are
firm-level and less costly. These instrumental variables are relevant and exogenous. The
results of the instrumental variable estimation show that better management practice leads to
higher level of firm productivity statistically and significantly, while there is the positive but
insignificant effect of management practices in the ordinary least square (OLS) estimation.
References
Aghion, Bloom and Van Reenen. (2014) Incomplete Contracts and the Internal Organization of Firms, Journal of Law, Economics, and Organization, doi: 10.1093/jleo/ewt003
Bloom, N., B. Eifert, A. Mahajan, D. KcKenzie, and J. Roberts. (2013) Does Management Matter? Evidence from India, Quarterly Journal of Economics, 128(1):1-51.
---, and J. Van Reenen. (2006) Measuring and Explaining Management Practices across Firms and Countries [online]. London: LSE Research Online available at: http://eprints.lse.ac.uk/archive/0000073
---, and J. Van Reenen. (2007) Measuring and Explaining Management Practices across Firms and Countries, Quarterly Journal of Economics, 122(4):1341-1408.
---, and J. Van Reenen. (2011) Human Resource Management and Productivity. Handbook of Labor Economics.Vol 4 Part B 1697-1767.
---, L. Garcicano, R. Sadun, and J. Van Reenen. (2009) The Distinct Effects of Information Technology and Communication Technology on Firm Organization. NBER Working Paper No. w14975
---, A. Mahajan, D. McKenzie, J. Roberts. (2010) Why Do Firms in Developing Countries Have Low Productivity?, American Economic Review, 100(2):619-623.
Corrado, C.A. and C.R. Hulten. (2010) How Do You Measure a Technological Revolution.
American Economics Review: papers & Proceedings 100: 99-104.
Levinsohn, J. and A. Petrin. (2003) Estimating Production Functions Using Inputs to Control for Unobservables, Review of Economic Studies 70(2): 371-342.
Miyagawa, T., K. Lee, S. Kabe, J. Lee, H. Kim, Y. Kim, and K. Edamura. (2011) Management Practices and Firm Performance in Japanese and Korean Firms – An Empirical Study Using Interview Surveys. RIETI Discussion Paper Series 10-E-013.
Park, C. and S. Kim. (2008) Corporate governance, regulatory changes, and corporate restructuring in Korea, 1993-2004 Journal of World Business 43:66-84.
Petrin, A., B. P. Poi and J. Levinsohn. (2004) Production Function Estimation in Stata Using Inputs to Control for Unobservables, Stata Journal, 4(2):113-123.
Figure 1. Distribution of management practice scores
Panel (A)
0
.0
0
5
.0
1
.0
1
5
.0
2
.0
2
5
20 40 60 80 100
management practice scores
regardless of performance due to poor performance
never
Panel (B)
0
.0
0
5
.0
1
.0
1
5
.0
2
.0
2
5
20 40 60 80 100
management practice scores
empowerment without empowerment
Panel (C)
0
.0
0
5
.0
1
.0
1
5
.0
2
.0
2
5
20 40 60 80 100
management practice scores
IT investment without IT investment
Table 1. Estimated production functions
OLS Fixed-effects Levinsohn and Petrin
Log capital 0.166***
(2.81)
−0.148 (−0.86)
0.200** (2.27)
Log employment 0.931*** (11.25)
1.087*** (3.85)
0.890*** (9.07)
Industry dummies Yes Yes Yes
Year dummies Yes Yes Yes
H0: Constant returns to scale [p-value]
[image:14.595.68.537.331.433.2] [image:14.595.64.531.490.736.2]1.097*** [0.009] 0.939* [0.793] 1.090** [0.025]
Number of observations 2,390 2,390 2,390
Note: Robust t-ratios are in parentheses.
*, **, and *** indicate significance at the 10%, 5%, and 1% levels, respectively.
Table 2. Summary statistics
Variables Obs Mean St. Dev. Min Max
Log of TFP 330 5.87 3.49 −13.15 8.83
Management practice score 330 65.66 16.07 28.33 100.00
Export intensity 330 7.23 20.04 0 96.83
R&D intensity 330 0.95 1.99 0 14.56
Table 3. Tests for the exogeneity of instrumental variables.
Panel (A) Organizational reform Never (n = 455)
Reformer
(n = 192) t-test
Mean 5.887 5.821 0.066 (1.054)
Panel (B) Empowerment Never and without empowerment
(n = 455)
With empowerment
(n = 108) t-test
Mean 5.887 5.924 −0.036 (−0.462)
Panel (C) IT investment Never and without IT investment
(n = 455)
With IT investment
(n = 88) t-test
Mean 5.887 5.894 −0.007 (−0.076)
Note: t-statistics in are parenthesis;
Table 4. Effect of management practice on the log of TFP
Second-stage regression (dependent variable = log of total fact productivity)
(1) OLS (2) 2SLS (3) 2SLS (4) 2SLS
Management practice score 0.017 (1.31) 0.047** (2.14) 0.053** (2.12) 0.046** (2.54)
Export ratio 0.011** (2.38) 0.013** (2.49) 0.013** (2.53) 0.013** (2.53)
R&D ratio 0.050
(0.60) 0.038 (0.46) 0.036 (0.087) 0.039 (0.47)
Industry dummies Yes Yes Yes Yes
(Centered) R2 0.081 0.063 0.012 0.021
observations 330 330 330 330
First-stage regression (dependent variable = management practice scores)
Motivation
(regardless of performance)
5.063** (2.30) 6.678*** (2.86) 2.131 (0.93) Motivation (poor performance) 1.505 (0.61) 3.818 (1.51) −0.402 (−0.16)
Empowerment 5.966***
(9.00)
5.191*** (7.70)
IT investment 4.412***
(5.98)
2.999*** (4.21)
Export ratio −0.027
(−0.61)
−0.060 (−1.36)
−0.036 (−0.85)
R&D ratio 0.133
(0.26)
0.444 (0.84)
0.242 (0.47)
Industry dummies Yes Yes Yes
F-statistics [p-value]
43.31 [0.000] 26.57 [0.000] 37.93 [0.000] Wu-Hausman F test
[p-value]
2.172 [0.142] 1.890 [0.170] 1.545 [0.672] Hansen J Statistic
[p-value]
1.257 [0.534] 1.502 [0.472] 2.358 [0.126] Note: Robust t-ratios are in parentheses;
Appendix. Questionnaire of management practice scoring
This appendix details the survey and calculations of management practice scoring. It also presents the specific questionnaire in the survey related to instrumental variables.
I. Management Practice Scoring
Organizational Management
1. Permeation of management principles (vision)
(a) Does your company have management principles?
(b) Has your company changed organizational structure to enhance shareholder value? (c) Are the management principles supported by employees?
2. Setting target levels of organizational goals
(a) Are the settings for the divisional target levels determined each division not by the division above you?
(b) Are the target levels appropriately set as an achievable level? (c) Are target levels checked to ensure fairness between divisions? 3. Permeation of organizational goals
(a) Do all employees know about the goals?
(b) If goals exist on various levels (such as divisional and sectional goals), do all employees understand the level of priority of the goals?
(c) Do most employees well aware of target levels and accept that the target levels tap their motivation?
4. Degree to which organizational goals are achieved and checks on performance
(a) Are checks made to see how far goals have been achieved? Please give an example of how such checks are made.
(b) Are such checks made on a periodic basis? How frequently are such checks made? (c) Are additional checks made that are decided by the section or department involved
itself?
5. Permeation of degree to which goals are achieved, and results of checks on the performance
(a) Are the results of such checks made openly available within your division?
(b) Are the results of such checks made openly available not only within your division but also between relevant divisions?
(c) Is there any evaluation tool to ensure that the degree to which goals have been achieved at different divisions is fairly compared? Please give an example of evaluation tools (for example, utilizing common scales such as overtime hours). 6. Results of checks conducted when goals have not been achieved
(a) Is a meeting consisting of managerial staff and employees promptly held as soon as it is known that the goals were not achieved?
(b) After investigations, are points to revise spread throughout the division and to relevant divisions?
(c) Are problematic issues and countermeasures made thoroughly known throughout the relevant divisions, and if necessary, other divisions? Please give an example of problematic issue and countermeasures made known to relevant or other divisions. 7. Results of checks conducted when goals have been achieved
(a) When goals are achieved, are investigations made so that higher goals are set? (b) How long is it between the setting of higher goals and the implementation of those
goals?
(c) Are these measures institutionalized on a company-wide level?
Human Resource Management 1. Promotion system
(b) Does your company have additional system to increase employee motivation other than promotion-related and payment-related system? If it does, please give an example.
(c) Did the performance of the employees improve as a result of performance-based, promotion-related, and payment related system or other measures to enhance employee motivation (for example, improvement of employee morale or employee performance)?
2. Handing employees that perform poorly
(a) Are they handled in some specific way other than by giving them verbal warning? (b) Does that handling include measures that are implemented faster than the average
term of office?
(c) Are the measures implemented as soon as a problem is confirmed (before a routine rotation)?
3. Handing employees that perform well
(a) Is it made clear within the division that the employee’s performance is good, for example, by management praising employees at meetings?
(b) Is there a system to connect good performance to things such as financial reward or promotion?
(c) Was the motivation of the employees raised through introducing such system? 4. Evaluation the interpersonal skills of the mangers
(a) Do the managers give clear criteria such as the degree to which persons of a lower position should be nurtured?
(b) Is there an incentive system, such as a pay-related system, to reward managers that have nurtured excellent staff of a lower position?
(c) Did the motivation of the managers increase as a result of introducing such system? 5. Securing good manpower
(a) Does your company have a clear definition of the high performance and core employees, which is accepted by employees? Please describe high performance and core employees in your company.
(b) Are such excellent employees treated well compared with ordinary employees? Please give an example.
(c) Could your company prevent the loss of such excellent employees? 6. Nurturing human resources through training
(a) Is there training to improve the work skills of the employees on a periodic basis? How long is it spent on training in a year?
(b) There are two types of training. Training on an occupational ability basis is to acquire specialist capabilities that are required in each field. Assignment-based training is to acquire official certifications. Which of the two is your company’s focus?
(d) Do those training activities help to improve business results? Please give an example. Are the effects of those training activities adaptable to other companies?
7. Nurturing human resources through on-the-job-training (OJT)
(a) Is OJT performed on a daily basis? What percentage of the supervisor’s working time is spent on giving instructions to those in a lower position?
(b) Does OJT contribute to business results? Give an example. (c) Are the effects of OJT monitored?
8. Employees’ expertise
(a) Are employees rotated in a flexible schedule? Are there any cases that the probability that employees rotate in a fixed schedule such as 2–3 years is less than 50 percent. (b) To improve the expertise of the employees, are they assigned to a set position for a long time?
II. Management practice scoring in relation to instrumental variables.
The instrumental variables consist of the motivations for organizational reform, empowerment, and IT investment in the process of reform. The questions for each IV are detailed below.
1. Motivations for organizational reform
Why has your company undergone organizational reforms?
(a) It was to do with poor performance that current management practice cannot deal with.
(b) While it was nothing to do with poor performance, organizational reform was led by reforms of rival firms.
(c) While it was nothing to do with poor performance, organizational reform was suggested by customers.
(d) While it was nothing to do with poor performance, organizational reform was considered as preparations for future growth of our firm.
To distinguish the motivations for organizational reform, two dummy variables are used: motivation (poor performance) and motivation (regardless of performance). If a respondent selects 1(a), the variable for motivation (poor performance) is 1; otherwise, it is 0. If a respondent chooses either 1(b), 1(c), or 1(d), the variable for motivation (regardless of performance) is 1; otherwise, it is zero.
2. Empowerment
(a) When a company undergoes organizational reform, sometimes the employees’ decision -making authority is revised. In the case of your company, was decision--making authority given to those in a lower position as a result of the organizational reform?
(b) Were posts simplified in conjunction with decision-making authority being given to those in a lower position?
(c) As a result, was there a chance in the details of the job or the way of doing the job? (d) Please provide an example.
Empowerment ranges from one to four points.
Empowerment
= 1 if firms do not undergo organizational reform or if firms have undergone organizational reform and firms’ answers are no to 2(a) (reformers without any empowerment).
= 2
if firms have undergone organizational reform and firms’ answers are no to 2(b) or
if firms’ responses to 2(d) are “reject to provide examples,” “do not know,”“no response,”“no examples” (answers of these firms to 2(c) are considered as “no”)
= 3
if firms have undergone organizational reform and firms’ answers are yes to 2(a) and 2(b) but no to 2(c).
= 4 if firms have undergone organizational reform and firms’ answers are yes to 2(a), 2(a), 2(b), and 2(c).
3. IT investment
(b) Were the effects of IT investment shown between divisions or sections?
(c) Was IT system utilized between the company and the business partners and not just within the company?
(d) Did an opportunity to earn new profits as a result of the organizational reform based on the IT system? Please give an example.
IT investment scores range from one to four points.
IT investment
= 1 if firms have not undergone organizational reform and firms’ answers are no to 3(a).
= 2
if firms have undergone organizational reform and firms’ answers are yes to 3(a) but no to 3(b) or
if firms’ responses to 3(d) are “reject to provide examples,” “do not know,”“no response,”“no examples.”Those firms’ answers to 3(c) are considered to be “no.”
= 3 If firms have undergone organizational reform and firms’ answers are yes to 3(a) and 3(b) but no to 3(c).