Objectivizing the Subjective: Measuring
Subjective Wellbeing
Pillai N., Vijayamohanan and B. P., Asalatha
Centre for Development Studies
1 March 2013
Online at
https://mpra.ub.uni-muenchen.de/45005/
1
Objectivizing the Subjective:
Objectivizing the Subjective:
Objectivizing the Subjective:
Objectivizing the Subjective:
Measuring
Measuring
Measuring
Measuring Subjective
Subjective
Subjective
Subjective Wellbeing
Wellbeing
Wellbeing
Wellbeing
Vijayamohanan Pillai N.
Centre for Development Studies,
Trivandrum, India
B. P. Asalatha
Madras University,
Chennai, India
E-mail:
2
Objectivizing the Subjective:
Objectivizing the Subjective:
Objectivizing the Subjective:
Objectivizing the Subjective:
Measuring Subjective Wellbeing
Measuring Subjective Wellbeing
Measuring Subjective Wellbeing
Measuring Subjective Wellbeing
Vijayamohanan Pillai N.
B. P. Asalatha
Abstract
3
Objectivizing the Subjective:
Objectivizing the Subjective:
Objectivizing the Subjective:
Objectivizing the Subjective:
Measuring Subjective Wellbeing
Measuring Subjective Wellbeing
Measuring Subjective Wellbeing
Measuring Subjective Wellbeing
Vijayamohanan Pillai N.
B. P. Asalatha
1 Introduction
Wellbeing has always eluded definition, and the elusive definition, in turn, has denuded
the concept of an objective measure. Wellbeing, in the general sense of the condition of
faring well of an individual or group, is often represented in terms of the quality of life of
an individual or group, including not only income, but also education, physical and
psychic health, recreations, conducive environment, social belongingness, security, and
so on. In contrast to this has earlier stood the concept of standard of living, based only on
income, popularised by the mainstream economics in the name of basic needs approach.
The different objective and subjective indicators that go into the composition of quality
of life leave its definition and measurement elusive, despite its global recognition as a
policy goal (Costanza, et al. 2008). Attempts at an objective measure have brought out
two basic methodological alternatives. The first, objective, measure has come out as the
famous Physical Quality of Life Index, developed by the sociologist Morris David
Morris in the 1970s, based on the indicators of basic literacy, infant mortality, and life
expectancy, and supplanted now by the Human Development Index. The second one,
dealing with subjective wellbeing, focuses upon self-reported levels of happiness,
pleasure, fulfillment etc. (Diener and Lucas 1999; and Easterlin 2003).
The present paper seeks to review the available objective measures of subjective
wellbeing. What follows is presented in five sections. The next section discusses some of
4
objective indicators. Section 3 details the subjective approach to wellbeing in terms of
life satisfaction, represented by measures of global life-satisfaction, affect balance,
average domain satisfaction and income. Section 4 presents a list of variables which are
correlated with global reports of life satisfaction and happiness, such as smiling
frequency, sociability and extraversion, sleep quality, high income, and high income rank
in a reference group, active involvement in religion, self-reported health, age, sex,
education, etc. Section 5 then reports on the surveys of subjective wellbeing, such as the
World Values Survey, the General Social Survey, the Eurobarometer Survey, the Cantril
Self-Anchoring Scale, and the Gallup World Poll, and seeks to interpret the scores
received. The next section turns to a major concern of researchers in the field, which is
whether self-report instruments are valid, whether there are cases wherein people
might report that they are happy yet not truly experience high subjective well-being.
The section also discusses briefly the recent attempts to mesaure individual welfare in
terms of moment-to-moment affect in such approaches as Experience Sampling or the
Day Reconstruction Method.
2. Measuring Wellbeing
As Jean Drèze and Amartya Sen (1995) has critiqued, development economics has since
its beginnings had “an overarching preoccupation with the growth of real income per
capita” as the most common measure of aggregate human well-being. However,
criticisms of national income as a metric for social welfare have a long history and are by
no means confined to economists; for example, Robert F Kennedy (1925 – 1968; an
American Democratic politician) in a speech given at the University of Kansas on March
18, 1968 said:1
“If we believe that we, as Americans, are bound together by a common concern for each
other, then an urgent national priority is upon us. We must begin to end the disgrace of
this other America. And this is one of the great tasks of leadership for us, as individuals
and citizens this year. But even if we act to erase material poverty, there is another
greater task, it is to confront the poverty of satisfaction—purpose and dignity—that
1
5
afflicts us all. Too much and for too long, we seemed to have surrendered personal
excellence and community values in the mere accumulation of material things. Our
Gross National Product, now, is over $800 billion dollars a year, but that Gross National
Product—if we judge the United States of America by that—that Gross National Product
counts air pollution and cigarette advertising, and ambulances to clear our highways of
carnage. It counts special locks for our doors and the jails for the people who break them.
It counts the destruction of the redwood and the loss of our natural wonder in chaotic
sprawl. It counts napalm and counts nuclear warheads and armored cars for the police to
fight the riots in our cities. It counts Whitman's rifle and Speck's knife, and the television
programs that glorify violence in order to sell toys to our children. Yet the gross national
product does not allow for the health of our children, the quality of their education or the
joy of their play. It does not include the beauty of our poetry or the strength of our
marriages, the intelligence of our public debate or the integrity of our public officials. It
measures neither our wit nor our courage, neither our wisdom nor our learning, neither
our compassion nor our devotion to our country, it measures everything in short, except
that which makes life worthwhile. And it can tell us everything about America except
why we are proud that we are Americans.”
Gross national product (GNP) is the sum of all consumption, investment, and
government spending by a country’s nationals, whether within the national territory or
not. In 1953, the United Nations published “A System of Statistical Tables” that gives
clear, precise instructions for constructing national income accounts; these tables, with
some modifications, are still the standard for national income accounts today (Waring
1988). Since the 1990s, GNP has been supplanted by GDP as the most common
definition of national income (Ackerman et al. 1997). GDP measures all consumption,
investment, and government spending within a country, plus exports minus imports,
regardless of the citizenship of the consumers or investors. Many authors have noted
conceptual problems with using GDP or GNP per capita as a measure of human
well-being. Briefly, national income accounts:
1) only register monetary exchanges;
6
weapons, the production of which tends to lower social welfare;
3) count both addictions and cures, or “anti-bads,” like the costs of cleaning up
petroleum spills;
4) treat natural resources as free and limitless;
5) place no value on leisure-time;
6) ignore freedom and human rights; and
7) ignore the distribution of income within the society (Hicks and Streeten 1979;
UNDP 1990).
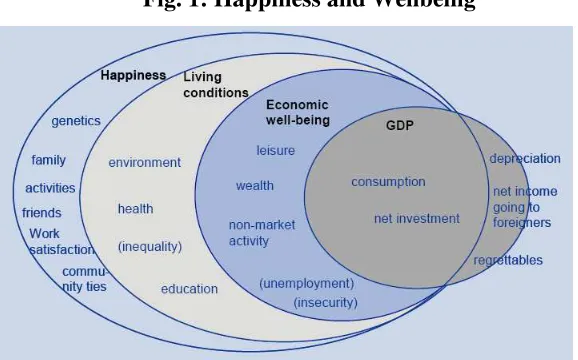
Figure 1 below illustrates the structure of the literature on well-being. The starting point
is GDP, in a net concept, net of capital consumption, income going to foreigners and
production of items that cause damage (e.g. pollution). What is then left of GDP (or a
subset of it) is the starting point for measures of economic well-being, including
non-market activity, the value of leisure and wealth minus the cost of unemployment and
income insecurity. But well-being also has non-economic dimensions: good health and
education, a clean environment and safe streets all contribute to individuals’ overall
[image:7.595.123.412.535.715.2]well-being. Finally, the ultimate goal of humans appears to be happiness (or life satisfaction).
Fig. 1: Happiness and Wellbeing
Note: Brackets indicate negative impact.
7
The capabilities theory of Sen and Nussbaum has branded down GDP per capita as an
inadequate measure and proposed, under the aegis of the UNDP, the human development
index and other indices as applied measures of social welfare. It should be noted that a
number of alternative measures were developed and used in practice even much before
that. For example, Nordhaus and Tobin (1972) developed the Measure of Economic
Welfare (MEW) to better understand the relationship between economic growth and
welfare. In the same year, the term ‘gross national happiness’ was coined by Bhutan’s
fourth Dragon King, Jigme Singye Wangchuck that led to the development of a
sophisticated survey instrument to measure the population’s general level of wellbeing.
Then followed the Japanese Net National Welfare (NNW) indicator in 1973, the
Economic Aspects of Welfare index (EAW) index of Zolatas in 1981, the Quality of Life
Index (QLI), developed by Carol Estwing Ferrans and Marjorie Powers in 1984, Daly
and Cobb (1989) Index of Sustainable Economic Welfare (ISEW), the Genuine Progress
Indicator (GPI) developed by the US-based lobby group ‘Redefining Progress’, the Index
of Economic Well-being (IEWB) developed by the Centre for the Study of Living
Standards (Osberg and Sharpe 1998), the National Wellbeing Index of the Australian
Centre on Quality of Life (since 2001), the Economic Living Standard Index (ELSI) of
the government of New Zealand (since 2002), the Happy Planet Index (HPI), an index of
human well-being and environmental impact, introduced by the New Economics
Foundation (in 2006), its own Measure of Domestic Progress (MDP) for the UK, and the
Legatum Prosperity Index, an annual ranking of 110 countries developed by the Legatum
Institute, to name a few.
Methodologically, income has been used as a proxy instead of direct measures for
opportunities and wellbeing because of the problems involved in measuring the private
nature of experience and making interpersonal comparisons. However, it is argued that if
people are not fully rational, their choices will not necessarily maximize their
experienced utility, and increasing further their opportunities, the material standard of
living, will not necessarily make them better off (Kahneman, 1994; Cass R. Sunstein and
Richard Thaler, 2004). Richard Easterlin in a number of studies has examined the
relationship between happiness and GDP both across countries and within individual
8
countries over the last fifty years but without any corresponding rise in reported
happiness levels: “In all societies, more money for the individual typically means more
individual happiness. However, raising the incomes of all does not increase the
happiness of all. The happiness-income relation provides a classic example of the logical
fallacy of composition—what is true for the individual is not true for society as a whole.
The resolution of this paradox lies in the relative nature of welfare judgments.
Individuals assess their material well-being, not in terms of the absolute amount of goods
they have, but relative to a social norm of what goods they ought to have” (Easterlin
1973). Layard (1980) puts it more succinctly: “a basic finding of happiness surveys is
that, though richer societies are not happier than poorer ones, within any society
happiness and riches go together.” Similar studies have also since been conducted by
psychologists (for example, Ed Diener, Marissa Diener, and Carol Diener 1995) and
political scientists (for example, Ronald Inglehart 1990).
There are three different phenomena to look at when examining the connection between
income and subjective well-being; rising GDP within a country, relative income within a
country, and differences in GDP between countries(Easterlin 1973). The paradox is the
seeming contradiction between the cross-section evidence on the relation between
income and happiness and the time-series evidence. The cross-section evidence is that
happiness and income are positively related. That is true on comparisons at a point of
time among income groups within a country. It is also true of comparisons at a point in
time of richer and poorer countries. The paradox is that when we look at what happens
within a country over time, as income goes up, happiness does not rise the way one
would expect it to on the basis of the cross-section.
More specifically, studies making comparisons between countries have come across a
principle called the ‘diminishing marginal utility of income’ (DMUI); they have found
not only a clear positive relationship between happiness and GNP per capita, but also a
curvilinear pattern; which suggests that wealth is subject to a law of diminishing
happiness returns (Veenhoven 1991). This implies that a R1,000 increase in real income
becomes progressively smaller, the higher the initial level of income, having less of an
impact on subjective well-being. Easterlin (1995) proved that the DMUI is true when
9
countries.
It is argued that once an individual rises above a ‘poverty line’ or ‘subsistence level’, the
main source of increased wellbeing is not income but other factors such as a good family
life, friends, etc. (see, for example, Robert E. Lane 2000). This ‘subsistence level’ could
be as low as US$10,000 per annum (as reported in Bruno S. Frey and Alois Stutzer
2002b and Darrin M. McMahon 2006). All these arguments are interpreted to imply that
at least for developed economies economic growth per se is of little importance and
should, therefore, not be the primary goal of economic policy (Andrew J. Oswald 1997).
Richard Layard (2005) goes as far as arguing that it should be happiness which is the
explicit aim of government intervention.
Theoretically, utility is what is maximized in consistent choice, a representation of
preferences which are simply choice-connected rankings of outcomes. According to the
axiomatic approach, individuals’ choices provide all the information required to infer the
utility of outcomes. Welfare judgments can be made by resorting to the Pareto criterion
and therefore no comparison of welfare levels among individuals is required. However,
as already implied, in contexts of bounded rationality, individual choices fail to
maximize experienced utility; direct measures of experienced utility become particularly
relevant in such contexts. It is now questioned whether utility can generally be derived
from observed choices. The same reservation applies to intertemporal choices when
individuals suffer from problems of self-control. Thus the exclusive reliance on an
objectivist approach in research is open to doubt, both theoretically and empirically. In
any case, it restricts the possibility of understanding and influencing human well-being.
Hence new ways are now pursued to approach individual welfare. Utility is again related
to the original, Benthamite meaning of utility as the hedonic quality of experience,
broadly construed to include satisfaction as well as pleasure. Moreover, advances in
psychology and neuroscience suggest that experienced utility and wellbeing can be
measured with some accuracy (Kahneman et al. 1999). Robust and interpersonally
consistent relationships have been observed between subjective measures of experience
and both specific measures of brain function and health outcomes. According to
Lyubomirsky et al. (2005) a part of happiness appears to be genetically determined
10
remainder by circumstances (income, climate, environment, stable democracy etc.).
Partly because of these findings, a large number of studies using subjective indicators of
happiness and life satisfaction have come up in recent years.
In many situations the choice-based and the experience- or survey-based concept of
utility coincide but there is also evidence indicating that they may systematically diverge
in some situations. Empirically, utility based on judgments of satisfaction and pleasure
can be captured by measures of subjective well-being. Note that subjective well-being is
the umbrella term for different measures that can be distinguished along two dimensions.
Regarding the first dimension, a common distinction is between cognition, i.e., the
evaluative or judgmental component of wellbeing (usually assessed with life
satisfaction), and affect, i.e., the pleasure-pain component of wellbeing (Diener 1984).
With regard to affect, two independent components of positive and negative affect are
differentiated. The second dimension distinguishes between measures that capture a
person’s level of subjective well-being and the duration in one rather than another mental
state. Because life satisfaction is a relatively stable construct, duration measures usually
refer to affect. A primary example of a duration measure is the U-index, which measures
the proportion of time an individual spends in an unpleasant state (Kahneman and Kruger
2006).
3. Measures of Wellbeing
Measurement scales used in the 1930s and 1940s took the form of checklists that
recorded behavioral and somatic symptoms of distress. Feelings of distress have long
been considered a nonspecific indicator of mental health; because distress is often a
stimulus to seek care, measures of distress represent a clinical orientation. However, the
scales stop short of making diagnostic classifications; they offer general screens. They
can also only indicate wellbeing in terms of the absence of distress, and so later gave
way to an approach that asked directly about positive and negative feelings of wellbeing.
The arguments in support of the symptom checklist held that it is more objective, and
that it more adequately conceals the intent of the measurement; this was formerly
deemed necessary because people were expected to be reticent about reporting their true
11
in the 1950s of the potential accuracy of subjective reports, led a movement in the United
States toward surveying feelings of happiness and emotional wellbeing. This trend also
reflected the theme of positive mental health, a concept that may be traced back to the
1947 World Health Organization (WHO) conception of health. These measures recorded
the affective responses to experience – the feeling states inspired by daily experience.
They approached psychological well-being largely as a cognitive process in which
people compare their perceptions of their current situation with their aspirations. This led
to approaching wellbeing in terms of life satisfaction, represented here by measures such
as the Life Satisfaction Index.
The literature in general identifies four measures of wellbeing: (1) Global
life-satisfaction; (2) Affect balance; (3) Average domain life-satisfaction; and (4) Income.
1. Global life-satisfaction.
The first measure is the global 11-point rating of life-satisfaction (e.g., Schimmack et al.,
2008). Often treated as a cardinal measure of utility, this is nearly exclusively used as a
measure of wellbeing in most researches. The reasons for its popularity are its high face
validity and the widespread use of life-satisfaction ratings in the wellbeing literature.
Moreover, life-satisfaction ratings have shown impressive validity, and many potential
biases have been shown to have relatively little effect on these ratings (Schimmack and
Oishi, 2005). However, this evidence does not suggest that life-satisfaction judgments
are the best measures of wellbeing, and some studies have revealed systematic biases in
life-satisfaction judgments (Schimmack et al., 2008).
2. Affect balance.
The second measure is an affective measure of wellbeing. Theoretical considerations and
pilot testing produced an affect balance measure based on four items. One item assesses
positive experiences (happy), whereas the other three items assess negative experiences
(angry, afraid, sad). The pilot study also suggested that subtracting the average of the
three negative items from the positive item produced a good measure of affect balance.
12
are consistent with findings in the psychological literature (Schimmack / Schupp /
Wagner, 2008).
3. Average domain satisfaction.
The third measure is an average of various domain satisfactions that are routinely
assessed in researches (health, work, housework, leisure time, dwelling, family).
Previous studies have shown high correlations between global life-satisfaction judgments
and judgments of average domain satisfaction (Andrews and Whitey, 1976; Schimmack,
Diener and Oishi, 2002; Schimmack and Oishi, 2005). This measure has two drawbacks.
First, it does not weigh domains by their subjective importance. Second, the measure
fails to capture aspects of wellbeing that are not covered by the domains included in the
survey. A main advantage of this measure is that it relies less on respondents’ ability to
summarize and weigh all relevant aspects of their lives in response to a single question
about satisfaction with life in general. Moreover, unweighted averages can be
surprisingly robust estimates of weighted averages (Andrews and Whithey, 1976;
Schimmack et al., 2002).
4. Income.
The fourth measure is income. Although psychologists do not regard income as a
measure of wellbeing, it is an important indicator in (welfare) economics. Briefly,
income is considered an important factor that influences wellbeing because it enhances
people’s opportunity to realize their preferences. However, economists are aware that
income is an imperfect indicator of wellbeing for a number of reasons. One important
reason is that not all preferences can be realized with money for ethical (e.g., it is illegal
to pay a contract killer) or logical (it is impossible to buy a loyal friend or unconditional
love) reasons. The second reason is that salaries could be negatively related to other
aspects of a job that influence preference realization. Finally, income is an imperfect
measure of spending and consumption, which are the more proximal predictors of
wellbeing. Although the relation between income and wellbeing is not perfect, a wide
variety of preferences can be realized better with more money (a better house, a shorter
13
help with chores, etc.). Not surprisingly, household income is consistently positively
related with global happiness and life-satisfaction ratings (Diener et al., 1999). Across
nations, income measured in GDP is a very strong predictor of average life-satisfaction
ratings (Deaton, 2008).
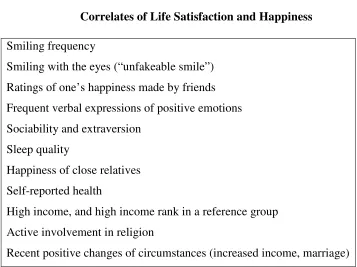
4. Correlates of Wellbeing
What makes people happy? Although people may define happiness in their own terms, in
general people mention similar things that make them happy (Easterlin 2002). Table 1
presents a list of variables which are correlated with global reports of life satisfaction and
happiness. Some visible signs of cheerfulness, such as smiling, are positively associated
with self-reported happiness. Surveys conducted in groups of countries have found that
the factors that people mostly mention are everyday life issues, to some extent, that they
control (Cantril 1965; Easterlin 2004; Frey and Stutzer 2002). Material conditions and
consumption are most prominently mentioned in these surveys. A fulfilling family life,
such as being married, having children and getting along with relatives is also an
important part. Personal and family health is another determinant. Job satisfaction and
personal character are also mentioned. Although international and domestic issues
(politics, war, and others) are rarely mentioned as determinants for wellbeing, studies
have found that political institutions have an influence on people’s happiness (Frey and
Stutzer 2002). Frey and Stutzer’s organization (2002) divides the determinants of
happiness into economic (i.e., income, unemployment, inflation and inequality) and
non-economic (i.e., personality, socio-demographic and institutional factors). Layard (2005)
highlights seven factors that have been shown to have the greatest influence on people’s
happiness: family relationships, financial situation, work, community and friends, health,
personal freedom, and personal values.
The strong association between temperament and subjective wellbeing does not
mean that events and circumstances are irrelevant to people’s subjective wellbeing. In
the first major review of happiness, Wilson (1967) shows that both personality and
demographic factors are correlated with subjective wellbeing. According to him, the
14
Table 1
Correlates of Life Satisfaction and Happiness
Sources: Diener and Suh (1999), Layard (2005) and Frey and Stutzer (2002).
worry-free, religious, married person with high self-esteem, job morale, modest
aspirations, of either sex and of a wide range of intelligence” (Wilson 1967).
Oreopoulos (2003) also finds that years of schooling are positively associated with
satisfaction, and that this result holds up after using features of compulsory schooling
laws as an instrumental variable for schooling to address the possibility of reverse
causation (that is, the possibility that greater life satisfaction may cause people to
complete more schooling). However, Campbell, Converse, and Rodgers (1976) find that
demographic and economic variables such as age, education, and income do not
account for much variance in reports of wellbeing in the context of Americans,
echoing earlier findings by Bradburn (1969) and others.
In the past 30 years, researchers have systematically cataloged the various correlates of
subjective wellbeing (Diener et al., 1999), with a number of replicable findings
emerging: (a) factors such as age, sex, and income are related to subjective wellbeing;
(b) these effects are usually small; and (c) most people are moderately happy, and thus,
demographic-economic factors tend to distinguish between people who are moderately Smiling frequency
Smiling with the eyes (“unfakeable smile”)
Ratings of one’s happiness made by friends
Frequent verbal expressions of positive emotions
Sociability and extraversion
Sleep quality
Happiness of close relatives
Self-reported health
High income, and high income rank in a reference group
Active involvement in religion
15
happy and those who are very happy (Diener and Diener, 1996).
Income, for example, is consistently related to subjective wellbeing in both
within-nation (e.g., Diener et al., 1993; Haring, Stock, and Okun, 1984) and
between-nation analyses (e.g., Diener et al., 1993); but at both the individual and the between-national
level, income change over time has little net effect on subjective wellbeing (Diener et
al., 1993; Diener and Suh, 1998). Goals and expectations must be taken into account to
understand the relation between income and subjective wellbeing; the benefits of a
rising income are offset if one’s material desires increase even faster than wealth.
Several studies, on the other hand, have found that rank in the income distribution or in
one’s peer group is more important than the level of income (Clark and Oswald, 1996;
Ferrer-i-Carbonell, 2005; Luttmer, 2005). Rayo and Becker (2005) propose a theory in
which peer comparisons and adaptation to circumstances are an integral part of the
“happiness function” as a result of an evolutionary process. Some studies also suggest
that wealth has a smaller impact on subjective wellbeing (SWB) than people generally
think, even though higher incomes do correlate substantially with life satisfaction reports
(Aknin, Norton and Dunn 2009). In this study Aknin and his colleagues asked the
participants from across the income spectrum to report their own happiness and to
predict the happiness of others and themselves at different income levels. In one study,
predicted happiness ranged between 2.4 and 7.9 and actual happiness ranged between 5.2
and 7.7. In the second study, predicted happiness ranged between 15 and 80 and actual
happiness ranged between 50 and 80. These findings show that people believe that
money does more for happiness than it really does (ibid.).
Similarly, there are substantial positive associations between health and SWB so that
people who rate their general health as ‘good’ or ‘excellent’ tend to experience better
SWB compared with those who rate their health as ‘fair’ or ‘poor’. A meta-analysis has
found that self-ratings of general health are more strongly related to SWB than physician
ratings of health (Okun, Stock, Haring, and Witter, 1984). The relationship between
health and SWB may be bidirectional. There is evidence that good subjective wellbeing
contributes to better health, and that interventions that are successful in improving
16
1984). For example, meditation and relaxation training have been found to increase
positive affect and to reduce blood pressure. However, the effect of specific types of
subjective wellbeing is not entirely clear. For example, how durable the effects of mood
and emotions on health are remains unclear. Whether some types of subjective wellbeing
predict health independently of others is also unclear (ibid.).
However, Wilson (1967) argues that researchers must be careful about the
conceptualization and measurement of independent variables, and concludes that
though physical health, for example, is correlated with subjective well-being, recent
findings qualify this conclusion: The relation depends on whether self-report or
objective ratings of health are assessed. Although self-reported health correlates
positively with subjective well-being (e.g., Okun, et al., 1984), the correlation is weak
when objective health ratings are examined (Watten, Vassend, Myhrer, Syversen,
1997). Subjective wellbeing influences the subjective perception of health, and this
inflates the correlation between subjective wellbeing and subjective health. It appears
that the way people perceive the world is much more important to happiness than
ob-jective circumstances.
Age and sex are related to subjective wellbeing, but these effects are small, and
de-pend on the component of subjective wellbeing being measured. For example, in an
international sample of 40 nations, Diener and Suh (1998) find that although pleasant
affect declines across age cohorts, life satisfaction and unpleasant affect show little
change. In two separate international samples consisting of approximately 40 nations
each, Lucas and Gohm (2000) find that sex differences in subjective wellbeing are
small (only about one fifth of a standard deviation difference), with women reporting
greater unpleasant and pleasant affect (though only significant differences in unpleasant
affect are replicated across both international samples). Based on these results, one
could not simply say that men are happier than women or that the young are happier
than the old. The conclusion depends on the component of subjective wellbeing that
is measured. Diener et al. (1999) argue that if theory in this area is to progress,
researchers must study the separable components of subjective wellbeing – ‘happiness’
17
Other demographic characteristics such as marital status and religious activity are
also positively correlated with subjective wellbeing; but the effects of marriage can
differ for men and women, and the effects of religious activity may depend on the
specific type of religiosity being assessed. Thus, the answer to whether particular
demographic factors increase subjective wellbeing is likely dependent on people’s
values and goals, personality, and culture.
In any event, measures of temperament and personality typically account for much more
of the variance of reported life satisfaction than do life circumstances. For example,
measures of psychological depression (such as acknowledging difficulty finding the
enthusiasm to get things done) are highly correlated with life satisfaction. Apparently, a
person’s subjective evaluation of his or her own wellbeing is to a significant extent a
personality trait. Identical twins separated immediately after birth, for example, show the
same concordance on happiness as on other traits for which a genetic basis is well
established, like height (Lykken and Tellegen, 1996).
Variables that are associated with low life satisfaction and happiness include: recent
negative changes of circumstances; chronic pain; and unemployment, especially if only
the individual was laid off. Gender is uncorrelated with life satisfaction and happiness.
The effects of age are complex – the lowest life satisfaction is apparently experienced by
those who have teenagers at home, and reported satisfaction improves thereafter.
This pattern of correlations has led Diener (1984) to conclude that the judgment of life
satisfaction is made by combining an imperfect assessment of the balance of affect (that
is, positive and negative feelings or emotions) in one’s life with an assessment of how
well one’s life measures up to aspirations and goals. Since the components of affect and
life assessment are potentially distinct, it is necessary to establish, for each correlate of
life satisfaction, whether the correlation is higher for one of the constituents of the
composite measure than for the other. The same question can be raised both with respect
to possible causes and to possible consequences of well-being. To answer such
questions, of course, it is necessary to have a separate measure of people’s affect over
18
5. Happiness Surveys
The questions most frequently asked in research using surveys of subjective wellbeing
elicit reports of global life satisfaction or happiness. In the World Values Survey (WVS),
for example, respondents in 81 countries are asked:
“All things considered, how satisfied are you with your life as a whole these
days”? Or
“Taking all things together, would you say you are: Very happy, Rather happy,
Not very happy, or Not at all happy.”2
The General Social Survey (GSS) similarly asks Americans:
“Taken all together, how would you say things are these days? Would you say
that you are very happy, pretty happy, or not too happy?”
The Eurobarometer Survey asks:
“On the whole, are you very satisfied, fairly satisfied, not very satisfied or not at
all satisfied with the life you lead”? And
“Taking all things together, how would you say things are these days – would
you say you’re very happy, fairly happy, or not too happy these days?”3
The Cantril Self-Anchoring Scale, developed by Hadley Cantril, an American researcher
of public opinion (1906–1969) asks:
“Please imagine a ladder with steps numbered from zero at the bottom to 10 at
the top.
2
www.worldvaluessurvey.org
3
19
The top of the ladder represents the best possible life for you and the bottom of
the ladder represents the worst possible life for you.
On which step of the ladder would you say you personally feel you stand at this
time? (ladder-present)
On which step do you think you will stand about five years from now?
(ladder-future)”
Similarly, the Gallup World Poll conducted in 130 countries has elaborated an index of
wellbeing based on the following questions:
“Please imagine a ladder with steps numbered from 0 at the bottom to 10 at the
top. Suppose we say that the top of the ladder represents the best possible life for
you and the bottom of the ladder represents the worst possible life for you. If the
top step is 10 and the bottom step is 0, on which step of the ladder do you feel
you personally stand at the present time?
Just your best guess, on which step do you think you will stand on in the future,
say 5 years from now?
Were you treated with respect all day yesterday?
Did you smile or laugh a lot yesterday?
Did you learn or do something interesting yesterday?
Did you experience the following feelings during a lot of the day yesterday?”4
Different measures of wellbeing provide different perspectives on the process by which
4
20
respondents reflect on or experience their lives. The Cantril Scale measures wellbeing
closer to the end of the continuum representing judgments of life or life evaluation
(Diener, Kahneman, Tov, and Arora, 2009). Research conducted across countries around
the world (Deaton, 2008) indicates substantial correlations between the Cantril Scale and
income. This contrasts with measures of feelings or affect which appear to be more
closely correlated with variables such as social time (Harter and Arora, 2008).
One distinct value of the Cantril Scale is the fact that a respondent can self-anchor
themselves based on their perspective. While every respondent will have their own
unique perspective, the patterns in the data suggest the scale can be meaningfully
grouped into at least three distinct categories as follows:
Thriving – wellbeing that is strong, consistent, and progressing. These respondents have
positive views of their present life situation (7+) and have positive views of the next five
years (8+). They report significantly fewer health problems, fewer sick days, less worry,
stress, sadness, anger, and more happiness, enjoyment, interest, and respect.
Struggling – wellbeing that is moderate or inconsistent. These respondents have
moderate views of their present life situation or moderate or negative views of their
future. They are either struggling in the present, or expect to struggle in the future. They
report more daily stress and worry about money than the thriving respondents, and more
than double the amount of sick days. They are more likely to smoke, and are less likely
to eat healthy.
Suffering – wellbeing that is at high risk. These respondents have poor ratings of their
current life situation (4 and below) and negative views of the next five years (4 and
below). They are more likely to report lacking the basics of food and shelter, more likely
to have physical pain, a lot of stress, worry, sadness, and anger. They have less access to
health insurance and care, and more than double the disease burden, in comparison to the
thriving respondents.
Early survey instruments usually posed a single question about people’s happiness or life
21
degree of validity. For example, Andrews and Withey (1976) find that global
questions about people’s overall evaluation of their lives yielded scores that
converged well with one another. As the field has matured, more multi-item scales
have appeared, with greater reliability and validity than the single-item instruments.
Lucas, Diener, and Suh (1996) demonstrate that multi-item life satisfaction, pleasant
affect, and unpleasant affect scales form factors that are separable from each other, as
well as from other constructs such as self-esteem. A number of happiness, affect, and
life satisfaction measures are now available (see Andrews and Robinson, 1992, for a
review).
6. Validity
A major concern of researchers in the field is whether self-report instruments are valid.
After all, people might report that they are happy yet not truly experience high
subjective well-being. When participants report on any aspect of global subjective
wellbeing, they must construct a judgment about their wellbeing. This constructed
judgment may not faithfully correspond to the average mood or level of satisfaction
experienced across many different moments. Thus, estimates of happiness and reports of
affect over time are likely to be influenced by a person’s current mood, his or her beliefs
about happiness, and the ease of retrieving positive and negative information.
Hence some researchers, equating individual welfare with moment-to-moment affect,
argue that individual welfare might be best measured by such approaches as Experience
Sampling or the Day Reconstruction Method. The former (Experience Sampling
Method) collects information on individuals’ actual experiences in real time in their
natural environments, and the Day Reconstruction Method asks people to reflect on how
satisfied they felt at various times during the day; it asks them to stop at certain times and
make notes of their experience in real time (right then, not later; right there, not
elsewhere), as developed by Larson and Csikszentmihalyi (1983) (see Stone et al., 1999;
Kahneman et al. 2004). At the momentary level, researchers now examine people’s
reports of moods, pleasures, pains, and satisfactions recorded online by using palm-sized
computers to signal people randomly. When signaled, respondents complete a survey
22
the most accurate estimate of subjective wellbeing because they are less distorted by
artifacts and biases.
While Thomas and Diener (1990) find only a modest match between people’s reports of
mo-mentary moods and their recall of those moods, Sandvik, Diener, and Seidlitz (1993) find
that the self-report measures converge with other types of assessment, including
expert ratings based on interviews with respondents, experience sampling measures in
which feelings are reported at random moments in everyday life, participants’ memory
for positive versus negative events in their lives, the reports of family and friends, and
smiling. Despite the positive psychometric qualities of global subjective well-being
measures, however, a multi-method battery to assess subjective wellbeing is
recommended when this is possible. Additional assessment devices based on memory,
informant reports, and experience sampling are likely to supplement the information
obtained from global measures and guard against response artifacts, and in some cases the
alternative measures may yield different answers about who is the happiest (e.g., Oishi,
2000).
Appendix 1: Measurement of Subjective Wellbeing –
Web based resources
1. Australian Centre on Quality of Life
http://acqol.deakin.edu.au/instruments/instrument.php
Index of a few hundred quality of life and well-being related scales. This site
gives a brief description of the scale, along with key references to scale
development and relevant psychometric research.
2. Positive psychology Centre, University of Pennsylvania
23
Useful measures linked from this site include:
Satisfaction with Life Scale (SWLS)
Psychological Well-being Scales
Subjective Happiness Scale (SHS)
3. Authentic Happiness web-site
http://www.authentichappiness.sas.upenn.edu
Scales are available for self-completion, but key references and copy right
information is given. Scales include those tapping into emotion, engagement,
meaning and life satisfaction. Useful measures available at this site include:
PANAS (Positive and Negative Affect Schedule)
CES-D
Fordyce Emotions Questionnaire
Satisfaction with Life Scale
Approaches to Happiness Scale
Some widely used recent measures
Mental health
Positive mental health
Warwick-Edinburgh Mental Well-being Scale (WEMWBS)
http://www.healthscotland.com/documents/1467.aspx
Still under development and psychometric testing.
Currently 14 positively worded items, each with 5 response categories.
24
Currently in the literature, including both hedonic and eudaimonic perspectives
Mental health scales, used within SWB literature
GHQ-12
http://www.webpoll.org/psych/GHQ12.htm
Originally consisted of 60 questions about mild somatic and psychological
symptoms, later condensed to 30- and 12-item questionnaires.
Patient Health Questionnaire (PHQ-9) Quick Depression scale
http://www.patient.co.uk/showdoc/40025272/
Center for Epidemiologic Studies Depression Scale (CES-D)
http://www.chcr.brown.edu/pcoc/cesdscale.pdf
20-item scale, 4 response options based on frequency of experiencing specified
emotional states during the last week.
Scored from 0 to 60.
Measures of affect
PANAS (Positive and Negative Affect Schedule).
10 positive affects (interested, excited, strong, enthusiastic, proud, alert, inspired,
determined, attentive, and active) and 10 negative affects (distressed, upset,
guilty, scared, hostile, irritable, ashamed, nervous, jittery, and afraid).
Participants are asked to rate items on a scale from 1 to 5.
25
Bradburn’s Affect Balance scale
10-item rating scale containing five statements reflecting positive feelings and
five statements reflecting negative feelings.
Respondents are asked by an interviewer to focus on feelings during the past few
weeks and indicate a positive (yes) or negative (no) response to each of the scale
items.
Positive affect is obtained by summing the 5 positive questions (scale of 0 to 5)
and negative affect by summing the negative questions. Affect Balance Scale is
scored by subtracting the negative from the positive and adding a constant of 5 to
avoid negative values.
Experience Sampling Method (ESM)
http://www.ncbi.nlm.nih.gov/pubmed/3655778
Subjects carry a beeper device that signals randomly. Each time the beeper
activates, subjects fill out a survey that typically includes questions asking what
the subject was doing, who they were with, and how the subject was feeling at the
time of the alarm.
Day Reconstruction Method (Kahneman and Kreuger)
http://sitemaker.umich.edu/norbert.schwarz/files/drm_documentation_july_2004. pdf
A hybrid approach in which respondents first revive memories of the previous
day by constructing a diary consisting of a sequence of episodes. Then they
describe each episode by answering questions about thesituation and about the
feelings that they experienced, as inexperience sampling.
26
Satisfaction with Life Scale (SWLS)
http://www.ppc.sas.upenn.edu/lifesatisfactionscale.pdf
5 item questionnaire, each with 7 response scales.
This scale has been extended to incorporate a time dimension by the Temporal
Satisfaction with Life Scale (TSWLS).
Global Quality of Life Assessment.
Domain satisfactions and domain-weighted life satisfaction.
Australian Personal Well-Being Index (PWI)
http://acqol.deakin.edu.au/instruments/wellbeing_index.htm
Includes a school and pre-school version.
Needs based, flourishing and multi-dimensional measures of well-being
Basic Psychological Needs Scale (Deci & Ryan)
http://www.psych.rochester.edu/SDT/measures/needs_scl.html
Family of scales, one that addresses needs satisfaction in general in ones life,
others than address needs satisfaction in specific domains (e.g. work,
interpersonal).
Original scale had 21 items concerning needs for competence, autonomy and
relatedness.
Some studies work with only 9 items (3 for each dimension).
27 http://www.authentichappiness.sas.upenn.edu
Life of meaning (6 questions), life of pleasure (6 questions), life of engagement
(6 questions).
Each with the response scale: 1 "Very much unlike me" to 5 "Very much like
me".
Scoring for each dimension is the average of the 6 questions.
WHO-QOL (100 & BREF)
http://www.who.int/substance_abuse/research_tools/whoqolbref/en/
WHO-QOL aimed to be an international cross-culturally comparable quality of
life assessment instrument.
WHOQOL-BREF instrument comprises 26 items, which measure the following
domains: physical health, psychological health, social relationships, and
environment.
The average of each domain is taken, giving a profile of 4 separate domain scores
Psychological Well-Being Scales (Ryff’s).
Six dimensions: autonomy, positive relations with others, purpose in life,
self-acceptance, environmental mastery and personal growth.
The original scale had 20 items contained within each of the 6 dimensions. This
has been reduced to 14 items per dimension, and more recently 3 items per
dimension.
CASP-19
28
Quality of life index for older people, developed from a needs based perspective
19 item Likert scaled index.
Questions on 4 domains: Control, Autonomy, Self-realisation and Pleasure.
Sum of all items (0 to 57)
European Social Survey. Module on well-being
http://www.cambridgewellbeing.org/Files/Well-being-Module_Jun06.pdf
A wide range of questions on feelings and functionings
Health-utility measures
EQ-5D
http://www.euroqol.org/
EQ-5D is a standardised instrument for use as a measure of health outcome.
The EQ-5D consists of 243 distinct health states across five dimensions
(mobility, self-care, usual activities, pain/discomfort and anxiety/depression),
each with three levels (no problem, moderate problem and severe problem).
The EQ-5D is often administered with a Visual Analogue Scale (VAS) or
‘feeling thermometer’ requiring a direction valuation of the individual’s health on
a scale from worst health imaginable to best imaginable.
Utility values for each state have been elicited from respondents using the EQ-5D
VAS technique in 8 European countries, and the TTO method has been used to
elicit values for 5 countries Denmark, Germany, Japan, Spain and the UK.
29
random sample of non-institutionalised adults throughout the UK (Dolan, 1997),
using the Time Trade Off (TTO) method. EuroQol values are anchored by ‘1’
representing full health and ‘0’ representing the state ‘dead’ with states ‘worse
than death’ bounded by ‘-1’.
SF-6D
http://www.shef.ac.uk/scharr/sections/heds/mvh/sf-6d
The SF-6D is a classification for describing health derived from a selection of
SF-36 items.
The SF-6D is composed of six multi-level dimensions. Any patient who
completes the 36 or the 12 can be uniquely classified according to the
SF-6D
The SF-6D describes 18,000 health states in total.
The SF-6D comes with a set of preference weights obtained from a sample of the
general population using the recognised valuation technique of standard gamble.
Members of the general population were asked to value a selection of health
states from which a model has been estimated to predict all the health states
described by the SF-6D
QWB
http://www.outcomes-trust.org/instruments.htm#QWB
An interviewer-administered general health related quality of life questionnaire
measuring symptoms, mobility, physical activity and social activity.
Scores can be translated into utility values for quality of adjusted life years. A set
of values for the QWB were derived using a VAS approach (anchored at ‘0’ for
death/worst possible and ‘100’ for optimum health) among a random sample of
30
HUI2 and HUI3
http://www.shef.ac.uk/scharr/sections/heds/mvh/hui2 http://www.healthutilities.com/hui3.htm
The Health Utilities Index (HUI) has two versions, HUI2 and HUI3 (Feeny et al.,
1995).
HUI3 defines 24,000 health states using seven attributes (sensation, mobility,
emotion, cognition, self-care, pain and fertility) with three to five levels per
attribute.
HUI2 defines 960,000 health states using eight attributes (vision, hearing, speech,
ambulation, dexterity, emotion, cognition and pain) with five to six levels per
attribute.
Both the HUI2 and HUI3 can be administered with a 15 item questionnaire.
The HUI3 scoring function is based on preference measurements obtained from a
small random sample of the general population in Hamilton, Ontario, Canada,
using Standard Gamble (SG) estimated from transformed VAS.
31
REFERENCES
Aknin, L.B., Norton, M.I., Dunn, E.W. (2009). "From wealth to well-being? Money
matters, but less than people think". The Journal of positive psychology4 (6): 523-527.
Andrews, F. M. and Withey, S. B. (1976): Social indicators of well-being: Americans’
Perceptions of Life Quality, Plenum Press, New York.
Argyle, M. (1987). The psychology of happiness. London: Methuen.
Aristotle (2000 [circa 4 BC]) Nicomachean Ethics, ed. and introd. R. Crisp (Cambridge:
Cambridge University Press.
Bentham, J. (1996 [1789]) An Introduction to the Principles of Morals and Legislation,
ed. J. Burns and H.L. A. Hart, introd. F. Rosen (Oxford: Clarendon Press).
Boarini, Romina, Asa Johansson and Marco Mira d’Ercole (2006). Alternative measures
of well-being. OECD Social, employment and migration working papers No. 33.
Bradburn, N. M. (1969). The structure of psychological well-being. Chicago: Aldine.
Brickman, P., and Campbell, D. T. (1971). Hedonic relativism and planning the good
society. In M. H. Appley (Ed.), Adaptation level theory: A symposium (pp. 287–302).
New York: Academic Press.
Brickman, P., Coates, D., and Janoff-Bulman, R. (1978). Lottery winners and accident
victims: Is happiness relative? Journal of Personality and Social Psychology, 36, 917–
927.
Campbell, A., Converse, P. E., & Rodgers, W. L. (1976). The quality of American life.
32
Clark, Andrew and Andrew Oswald. 1996. “Satisfaction and Comparison Income.”
Journal of Public Economics. 61:3, pp. 359–81.
Costanza, Robert et al. (2008) “An Integrative Approach to Quality of Life
Measurement, Research, and Policy”. S.A.P.I.EN.S. Vol. 1 (No. 1). Available at
http://sapiens.revues.org/169 (Accessed on 12 December 2012).
Daly, H. and Cobb, J., 1989. For the Common Good. Beacon Press, Boston.
Deaton, A. (2008): Income, health, and well-being around the world: Evidence from the
Gallup World Poll, Journal of Economic Perspectives 22 (2), 53 – 72.
Diener, Ed. 1984. “Subjective Well-Being.” Psychological Bulletin. 95:3, pp. 542–75.
Diener, E. (2000a). Subjective well-being: The science of happiness and a proposal for a
national index. American Psychologist, 55, 34-43.
Diener, E., and Suh, E. M. (1998). Subjective wellbeing and age: An international
analysis. In K. W. Schaie and M. P. Lawton (Eds.), Annual review of gerontology and
geriatrics (Vol. 17, pp. 304-324). New York: Springer.
Diener, E., Suh, E., Lucas, R., and Smith, H. (1999). Subjective well-being: Three
decades of progress. Psychological Bulletin, 125, 276302.
Diener, E., and Lucas, R. E. (1999). Personality and subjective well-being. In D.
Kahneman, E. Diener, and N. Schwarz (Eds.), Well-being: The foundations of hedonic
psychology (pp. 213- 229). New York: Russell Sage Foundation.
Diener, E., and Diener, C. (1996). Most people are happy. Psychological Science, 7,
181-185.
33
income and subjective well-being: Relative or absolute? Social Indicators Research,
28, 195-223.
Diener, E. and Suh, E. (1999). “National Differences in Subjective Wellbeing”. in:
Well-Being: The Foundations of Hedonic Psychology, edited by: Kahneman, D., Diener, E.,
and Schwarz, N., New York, Russel Sage Foundation.
Diener, E., Suh, E. M., Lucas, R. E., and Smith, H. L. (1999): Subjective well-being:
Three decades of progress, Psychological Bulletin 125 (2), 276 – 302.
Diener, E., Emmons, R. A., Larsen, R. J., and Griffen, S. (1985). The Satisfaction With
Life Scale. Journal of Personality Assessment, 49, 7175.
Diener, E, Marissa Diener, and Carol Diener. 1995. “Factors Predicting the Subjective
Well-Being of Nations.” Journal of Personality and Social Psychology, 69(5): 851–64.
Diener, Ed, Eunkook M. Suh, Richard E. Lucas and Heidi L. Smith (1999). Subjective
Well-Being: Three Decades of Progress. Psychological Bulletin 125(2): 276-302.
Diener, E.; Chan, M.Y. (1984). "Happy People Live Longer: Subjective Well-Being
Contributes to Health and Longevity". Applied Psychology: Health and Well-Being3: 1–
43.
Diener, E and Eunkook M. Suh. 1999. “National Differences in Subjective Well-Being,”
in Well-Being: The Foundations of Hedonic Psychology. D. Kahneman, E. Diener and
N. Schwarz, eds. New York: Russell-Sage, pp. 434–50.
Drèze, Jean and Sen, Amartya (1995) India: Economic Development and Social
Opportunity. Oxford University Press.
Doyal, L., and Gough, I. (1991). A Theory of Human Need. London: Macmillan.
34
(Winter), 3-10
Easterlin, Richard A.: 1995. ‘Will Raising the Incomes of All Increase the Happiness of
All?’ Journal of Economic Behavior and Organization, 27(1), (June), pp.35-48.
Easterlin R. (2003). “Explaining Happiness”. Proceedings of National Academy of
Science, 100 (19), 11 176–11 183.
Etzioni, A. (1988). The Moral Dimension; Toward a New Economics. New York: The
Free Press.
Ferrer-i-Carbonell, Ada. 2005. “Income and Well-Being: An Empirical Analysis of the
Comparison Income Effect.” Journal of Public Economics. 89:5-6, pp. 997–1019.
Frey, Bruno and Alois Stutzer. 2002. Happiness and Economics. Princeton: Princeton
University Press.
Frey, Bruno and Alois Stutzer (2002). “What Can Economists Learn from Happiness
Research?” Journal of Economic Literature, June, 40(2), pp. 402–35.
Frey, Bruno S., Matthias Benz and Alois Stutzer (2004). Introducing Procedural Utility:
Not Only What, But Also How Matters. Journal of Institutional and Theoretical
Economic 160(3): 377-401.
Goudzwaard, B., and de Lange, H. (1994). Beyond Poverty and Affluence; Towards a
Canadian Economy of Care. Toronto: University of Toronto Press.
Haring, M. J., Stock, W. A., and Okun, M. A. (1984). A research synthesis of gender and
social class as correlates of subjective well-being. Human Relations, 37, 645-657.
Hektner, J.M., Schmidt, J.A., Csikszentmihalyi, M. (Eds.). (2006). Experience Sampling
Method: Measuring the Quality of Everyday Life. Sage Publications, Inc.
35
Princeton University Press.
Kahneman, Daniel. 1994 “New Challenges to the Rationality Assumption.” Journal of
Institutional and Theoretical Economics, March, 150(1), pp. 18–36.
Kahneman, D. (1999). Objective happiness. In D. Kahneman, E. Diener, and N. Schwarz
(Eds.), Well-being: The foundations of hedonic psychology (pp. 3-25). New York:
Russell Sage Foundation.
Kahneman, Daniel and Krueger, Alan B. (2006). ‘Developments in the Measurement of
Subjective Well-Being’ Journal of Economic Perspectives, Volume 20, Number 1,
Winter : 3–24.
Kahneman, Daniel; Diener, E. and Schwarz, N., 1999 eds., Well-being: Foundations of
hedonic psychology. New York: Russell Sage Foundation Press,.
Kahneman, Daniel, Alan B. Krueger, David Schkade, Norbert Schwarz and Arthur Stone
(2004). Toward national well-being accounts. American Economic Review 94(2) Papers
and Proceedings, pp. 429-434.
Kahneman, Daniel, Ed Diener und Norbert Schwarz (eds.) (1999). Well-Being: The
Foundations of Hedonic Psychology. New York, NY: Russell Sage Foundation.
Kahneman, Daniel, Alan B. Krueger, David A. Schkade, Norbert Schwarz and Arthur A.
Stone (2004). A Survey Method for Characterizing Daily Life Experience: The Day
Reconstruction Method. Science 306(5702): 1776-1780.
Kelman, Mark (2005). Hedonic Psychology and the Ambiguities of "Welfare".
Philosophy and Public Affairs 33(4): 408-409.
Larson, R., and Csikszentmihalyi, M. (1983). "The experience sampling method". New
36
Layard, Richard. 1980. “Human Satisfaction and Public Policy.” Economic Journal 90,
no. 363: 737–50.
Layard, Richard. 2005. Happiness: Lessons from a New Science. London: Allen Lane
Layard, Richard (2006). Happiness and public policy: A challenge to the profession.
Economic Journal 116, pp. C24-C33.
Lucas, R. E., Diener, E., and Suh, E. (1996). Discriminant validity of well-being measures.
Journal of Personality and Social Psychology, 71, 616628.
Lucas, R. E., and Gohm, C. (2000). Age and sex differences in subjective well-being across
cultures. In E. Diener and E. M. Suh (Eds.), Subjective wellbeing across cultures.
Cambridge, MA: MIT Press.
Luttmer, Erzo. 2005. “Neighbors as Negatives: Relative Earnings and Well-Being.”
Quarterly Journal of Economics. 120:3, pp. 963–1002.
Lykken, David T. and Auke Tellegen. 1996. “Happiness is a Stochastic Phenomenon.”
Psychological Science. 7:3, pp. 186–89.
Lyubomirsky, Sonja, Kennon M. Sheldon and David Schkade (2005). Pursuing
happiness: The architecture of sustainable change. Review of General Psychology 9(2),
pp. 111-131.
Max-Neef, M. (1991). Human Scale Development: Conception, Application and Further
Reflections. New York: Apex Press.
McMahon, Darrin (2006). The Pursuit of Happiness: A History from the Greeks to the
Present. London: Allen Lane
37
Nelson, J.A. (1993). “The Study of Choice or the Study of Provisioning? Gender and the
Definition of Economics”. In M.A. Ferber and J.A. Nelson (Eds.), Beyond Economic
Man: Feminist Theory and Economics . (23-36). Chicago: University of Chicago Press.
Nordhaus, W. D. and J. Tobin (1972). Is Growth Obsolete?, In: Economic Growth,
National Bureau of Economic Research, General Series No. 96, New York, pp.1−80.
Norton, M.I., Dunn, E.W., and Aknin, L.B. (2009). From wealth to well-being: Spending
money on others promotes happiness. Invited talk at the Society for Personality and
Social Psychology, Tampa, FL
Nussbaum M. and J. Glover (1995). Women, Culture and Development: A Study of
Human Capabilities. Oxford, Oxford University Press.
Oishi, S. (2000). Culture and memory for emotional experiences: On-line vs.
retrospective judgments of subjective well-being. Unpublished doctoral dissertation,
University of Illinois, Urbana-Champaign.
Okun, M. A.; Stock, W. A.; Haring, M. J.; and Witter, R. A. (1984). "Health and
subjective well-being: a meta-analysis". The International journal of aging and human
development19: 111–132.
Oreopoulos, Philip. 2003. “Do Dropouts Drop Out Too Soon? Evidence from Changes in
School-Leaving Laws.” Mimeo, University of Toronto, March.
Osberg, Lars (1985) “The Measurement of Economic Well-being” in D. Laidler
(research coordinator), Approaches to Economic Well-being, Vol. 26, Research Studies
of the MacDonald Commission (Toronto: University of Toronto Press).
Osberg, Lars and Andrew Sharpe (1998) “An Index of Economic Well-being for