http://wrap.warwick.ac.uk/
Original citation:
Carter, P. J. (Philip J.), Steeghs, D. (Danny), 1972-, Marsh, T. R., Kupfer, T.,
Copperwheat, C. M., Groot, P. J. and Nelemans, G.. (2014) The AM Canum
Venaticorum binary SDSS J173047.59+554518.5. Monthly Notices of the Royal
Astronomical Society, Volume 437 (Number 3). pp. 2894-2900.
Permanent WRAP url:
http://wrap.warwick.ac.uk/59059
Copyright and reuse:
The Warwick Research Archive Portal (WRAP) makes this work of researchers of the
University of Warwick available open access under the following conditions.
This article is made available under the Creative Commons Attribution- 3.0 Unported
(CC BY 3.0) license and may be reused according to the conditions of the license. For
more details see
http://creativecommons.org/licenses/by/3.0/
A note on versions:
The version presented in WRAP is the published version, or, version of record, and may
be cited as it appears here.
Advance Access publication 2013 November 28
The AM Canum Venaticorum binary SDSS J173047.59
+
554518.5
P. J. Carter,
1‹D. Steeghs,
1T. R. Marsh,
1T. Kupfer,
2C. M. Copperwheat,
3P. J. Groot
2and G. Nelemans
2,41Department of Physics, University of Warwick, Coventry CV4 7AL, UK
2Department of Astrophysics/IMAPP, Radboud University Nijmegen, PO Box 9010, NL-6500 GL Nijmegen, the Netherlands
3Astrophysics Research Institute, Liverpool John Moores University, IC2, Liverpool Science Park, 146 Brownlow Hill, Liverpool L3 5RF, UK 4Institute for Astronomy, KU Leuven, Celestijnenlaan 200D, B-3001 Leuven, Belgium
Accepted 2013 October 28. Received 2013 October 2; in original form 2013 July 23
A B S T R A C T
The AM Canum Venaticorum (AM CVn) binaries are a rare group of hydrogen-deficient, ultrashort period, mass-transferring white dwarf binaries and are possible progenitors of Type Ia supernovae. We present time-resolved spectroscopy of the recently discovered AM CVn bi-nary SDSS J173047.59+554518.5. The average spectrum shows strong double-peaked helium emission lines, as well as a variety of metal lines, including neon; this is the second detection of neon in an AM CVn binary, after the much brighter system GP Com. We detect no calcium in the accretion disc, a puzzling feature that has been noted in many of the longer period AM CVn binaries. We measure an orbital period, from the radial velocities of the emission lines, of 35.2±0.2 min, confirming the ultracompact binary nature of the system. The emission lines seen in SDSS J1730 are very narrow, although double-peaked, implying a low-inclination, face-on accretiface-on disc; using the measured velocities of the line peaks, we estimatei≤11◦. This low inclination makes SDSS J1730 an excellent system for the identification of emission lines.
Key words: accretion, accretion discs – binaries: close – stars: individual: SDSS J173047.59+554518.5 – novae, cataclysmic variables – white dwarfs.
1 I N T R O D U C T I O N
The AM Canum Venaticorum (AM CVn) binaries are a class of ultracompact systems, characterized by their short orbital periods, which range from 5 to 65 min, and their hydrogen-deficient spectra. They consist of a white dwarf accreting helium-rich material from a (semi) degenerate companion. It is the degenerate nature of the mass donor that allows their periods to lie well below the believed minimum period (∼80 min) of hydrogen-rich cataclysmic variables (Rappaport, Joss & Webbink1982; G¨ansicke et al.2009). A recent review of the AM CVn binaries is given by Solheim (2010).
The evolution of AM CVn binaries is thought to be driven by gravitational wave radiation. Combined with the increasing period and decreasing mass ratio, this gives rise to a very strong depen-dence of the accretion rate, and hence their observed properties, on the orbital period. In the shortest period systems (Porb 10 min), the accretion stream likely impacts directly on to the surface of the accretor, and no accretion disc forms (Marsh & Steeghs2002; Roelofs et al.2010). Systems with orbital periods of∼10 to∼20 min possess an accretion disc that is in a stable ‘high’ state, and their spectra are dominated by helium absorption from the optically thick disc (O’Donoghue et al. 1994). For the longest period systems
E-mail:[email protected]
(Porb45 min), the disc is in a stable low state; photometry of these systems typically lacks orbital signatures, and their optical spectra are dominated by helium emission lines (Warner1995; Ruiz et al.
2001). In the intermediate period systems (20Porb45 min), the disc is unstable, and their appearance varies between that of the high-state and the low-high-state systems, analogously to the hydrogen-rich dwarf novae (Tsugawa & Osaki1997; Kotko et al.2012; Ramsay et al.2012).
The AM CVn binaries are an extremely important class of objects due to the strong low-frequency gravitational wave emission that governs their evolution (Roelofs et al.2006b; Stroeer & Vecchio
2006; Nelemans2009; Nissanke et al.2012). AM CVn binaries are a possible progenitor for Type Ia supernovae (SN Ia) via the ‘double detonation’ mechanism (e.g. Shen & Bildsten2009,2013) and may produce rare sub-luminous SN Ia-like events (Bildsten et al.2007; Brown et al.2011).
The first AM CVn binaries were discovered serendipitously in a variety of different surveys. This made it impossible to study their population and to derive fundamental quantities required for calibration of predictions from binary evolution theory. In the past ten years, dedicated surveys have tripled the number of known AM CVn binaries [samples based on outburst selection target systems with orbital periods in the 20–45 min range (Levitan et al.2011,
2013), whilst the samples based on the Sloan Digital Sky Survey (SDSS; York et al.2000) select low-state systems (Anderson et al.
C
The Authors 2013. Published by Oxford University Press on behalf of The Royal Astronomical Society. This is an Open Access article distributed under the terms of the C
at University of Warwick on January 23, 2014
http://mnras.oxfordjournals.org/
The AM CVn binary SDSS J1730
+
5545
2895
2005,2008; Roelofs et al.2005,2009; Rau et al.2010; Carter et al.
2013)]. These homogeneous samples have allowed the first detailed studies of the population and estimation of the AM CVn space density (Roelofs, Nelemans & Groot2007a; Carter et al.2013).
Characterization of the sample requires detailed follow-up obser-vations after the initial discovery, in order to determine the orbital period and confirm the ultracompact binary nature of these can-didate systems. Here, we present time-resolved spectroscopy of the candidate AM CVn binary SDSS J173047.59+554518.5 (here-after SDSS J1730), identified spectroscopically by Carter et al. (2013) amongst a colour-selected sample of objects from SDSS photometry.
2 O B S E RVAT I O N S A N D DATA R E D U C T I O N
We obtained optical spectroscopy of SDSS J1730 on 2012 May 21 with the Gemini Multi-Object Spectrograph (GMOS; Hook et al.
2004) at the Gemini North telescope on Mauna Kea, Hawaii. The observations consist of 54 spectra, obtained using the B600+ grat-ing with a 180 s exposure time. GMOS has three 2048×4608 e2v deep depletion CCDs, which were used in six amplifier modes. The resulting spectra cover the wavelength range 4120–6973 Å with a resolution of∼5.46 Å.
The GMOS observations used a 1.0 arcsec slit; 4×4 binning and ‘slow’ read-out mode were used to minimize the read-out noise.
We obtained a second, longer set of phase-resolved spectra of SDSS J1730 on 2012 July 13–15 on the William Herschel Telescope (WHT), situated on the island of La Palma, with the Intermediate dispersion Spectrograph and Imaging System (ISIS). These obser-vations consist of 163 spectra obtained with 300 s exposures using theR600Bgrating in the blue arm and theR600Rgrating in the red arm. The resulting spectra cover the wavelength range 3750–5260 Å and 5540–7125 Å, with a spectral resolution of∼2.43 Å in the blue arm and∼2.18 Å in the red arm.
All ISIS observations used 4×2 binning and a 1.2 arcsec slit. The detectors were used in ‘slow’ read-out mode to minimize the read-out noise. The slit was kept at a fixed position angle of 145◦.3 in order to observe both SDSS J1730 and a nearby com-parison star (SDSS J173050.53+554442.5, 44 arcsec south-east of SDSS J1730) simultaneously.
Bias subtraction was achieved using average bias frames con-structed from bias frames taken each night. Normalized flat-field frames were constructed by averaging a series of tungsten lamp flat-field frames obtained during each night; additionally, for the ISIS observations, spatial profile correction was achieved using nightly averaged twilight flat-fields.
Wavelength calibration was obtained from CuAr arc lamp ex-posures taken at the start, middle and end of the three hour GMOS observing block and CuNeAr arc exposures obtained every ∼40 min for the duration of our ISIS observations of SDSS J1730. Fourth-order polynomial fits to reference lines re-sulted in∼0.15 and∼0.05 Å rms residuals for the GMOS and ISIS spectra. Each exposure was wavelength calibrated by interpolating the solutions obtained from the two closest arcs in order to correct for instrument flexure.
[image:3.595.334.523.72.170.2]The comparison star spectra were used to correct the ISIS spec-tra of SDSS J1730 for time and wavelength-dependent slit losses. The individual comparison star spectra were divided by the master comparison star spectrum obtained at lowest air mass. These ratio spectra were fitted with a second-order polynomial, and the spectra of SDSS J1730 were corrected by dividing by the corresponding polynomial fit. The ISIS spectra were flux calibrated and corrected
Table 1. Log of our observations of SDSS J1730.
Date UT Exposure Exposures
time (s)
Gemini/GMOS
2012 May 21 10:45–13:34 180 54
WHT/ISIS
2012 July 13 22:21–03:16 300 54
2012 July 14 21:14–03:24 300 67
2012 July 15 23:09–03:28 300 42
for instrumental response using the spectrophotometric standard star BD+28 4211.
All spectra were reduced using optimal extraction as imple-mented in thePAMELA1code (Marsh1989), which also uses the STAR-LINKpackagesKAPPA,FIGAROandCONVERT. Spectra were wavelength and flux calibrated usingMOLLY.2 Our spectroscopic observations are summarized in Table1.
3 R E S U LT S
3.1 Average spectral features
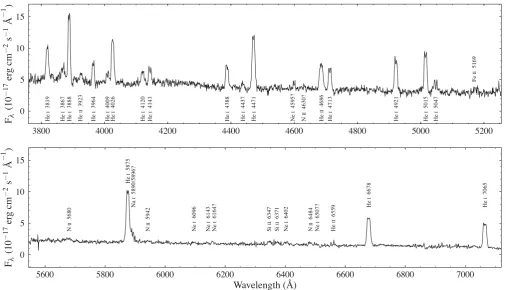
The average GMOS spectrum of SDSS J1730 is shown in Fig.1. It shows strong, narrow HeIemission lines as well as several HeII lines. Given the strength of the HeII5411 Å line, and the absence of Hγ, we associate the emission close to 6559 and 4859 Å with HeII and not with the hydrogen Balmer series. There is no clear sign of the accreting white dwarf in the spectrum.
Several lines of Fe, N, Si and Ne are also identified. Metal lines are often seen in quiescent AM CVn spectra (e.g. Roelofs et al.
2006a, 2009; Kupfer et al.2013; Levitan et al. 2013); however, neon has only previously been identified in GP Com (Marsh, Horne & Rosen1991; Nelemans et al.2010).
The ISIS spectrum (Fig.2) shows a blue continuum and reveals the double-peaked line profiles expected from the accretion disc. The red wing of the HeI5875 line shows contamination from an emission feature around 5893 Å which we identify as being caused by the Na D doublet. Roelofs et al. (2006a) reported similar blending in the spectra of SDSS J1240-0159 and V406 Hya. This feature is puzzling as any sodium in the disc should be largely ionized at the temperatures required to produce most of the emission lines observed (see Marsh et al.1991for further discussion).
Table2shows the equivalent width (EW) and full width at half-maximum (FWHM) of the prominent lines in the average spectra of SDSS J1730. The narrow emission lines that reveal their double-peaked nature clearly in the higher resolution ISIS spectra imply a low inclination. This also results in a low-radial-velocity amplitude, which makes the periodic motion of the binary difficult to measure. Carter et al. (2013) used the EW of the HeI5875 line to predict an orbital period of 40–55 min based on the known population of AM CVn binaries.
We fit the average flux-calibrated spectrum with a blackbody, masking the obvious emission lines, giving a continuum temper-atureT=12 700±100 K (see Fig. 3). We give here the formal
1
PAMELA is included in the STARLINK distribution ‘Hawaiki’ and later releases. The STARLINK Software Group homepage can be found at
http://starlink.jach.hawaii.edu/starlink.
2
MOLLY was written by T. R. Marsh and is available at
http://www.warwick.ac.uk/go/trmarsh/software.
at University of Warwick on January 23, 2014
http://mnras.oxfordjournals.org/
Figure 1. Normalized average spectrum of SDSS J1730 obtained with GMOS. The strong helium lines are prominent, in addition many weak metal lines are detected. The small gaps at 5055 and 6015 Å are due to gaps between the individual CCDs.
Figure 2. Average spectrum of SDSS J1730 obtained with ISIS. The prominent lines have been labelled.
uncertainty in the fit; note that this does not reflect the consider-able uncertainties in the contributions of the white dwarf and the disc to the continuum. The data were corrected for Galactic extinc-tion using theRV=3.1 prescription of Fitzpatrick (1999) and the
full Galactic reddening according to Schlegel, Finkbeiner & Davis (1998),E(B−V)=0.047. Without correction for extinction, we obtain a temperature of 11 600 K.
3.2 The spectroscopic period
To find the spectroscopic period, we measured the radial velocity variation of the HeIemission lines usingMOLLY. These lines, formed
in the disc, should approximately trace the motion of the accretor via the orbital motion of the accretion disc. For measurement of the orbital period, all we require is some signal in the radial velocities of the lines that varies on the orbital period.
Each line was fitted by a single Gaussian, with the initial values of the fit parameters determined from a fit to the average spectrum. The FWHM for each line was fixed to this value, whilst the velocity offset common to all lines and the height of each line were allowed to vary. We use the six strongest lines excluding HeI5875 (which causes a significant offset, probably due to contamination from the nearby Na feature) for the GMOS spectra and the 11 strongest HeI lines for the ISIS spectra. The fitting procedure thus yields, for
at University of Warwick on January 23, 2014
http://mnras.oxfordjournals.org/
[image:4.595.43.550.282.572.2]The AM CVn binary SDSS J1730
+
5545
2897
Table 2. EWs and FWHM of prominent lines.
Line GMOS ISIS
EWs (Å) FWHM (km s−1) EWs (Å) FWHM (km s−1)
HeI3819 – – −9.2±0.7 670±40
HeI3867 – – −4.6±0.7 970±130
HeI3888 – – −16.3±1.0 550±30
HeI3964 – – −4.4±0.7 480±60
HeI4026 – – −14.3±0.7 650±30
HeI4120 – – −3.4±1.0 630±150
HeI4143 −3.1±0.4 550±50 −5.0±0.8 670±80
HeI4388 −8.3±0.4 680±20 −9.2±0.7 620±30
HeI4437 −1.2±0.4 670±170 −1.7±0.6 600±170 HeI4471 −23.7±0.4 705±10 −24.4±0.7 660±20 HeII4686 −15.1±1.2 830±50 −13.7±1.3 730±50 HeI4713 −9.0±0.3 620±20 −10.3±0.7 610±30 HeI4921 −16.6±0.4 650±10 −17.6±0.8 620±20
HeI5015 −18.4±0.4 610±10 −22.6±0.9 590±20
HeI5047 ... ... −8.0±1.0 920±90
FeII5169 −0.9±0.2 470±70 −3.0±1.0 750±190
HeII5411 −1.7±0.3 860±100 – –
NII5680 −4.4±0.4 1050±70 −4.4±1.1 1200±200
HeI5875 −47.1±1.1 660±10 −55.8±1.3 640±10
NeI6096 −1.1±0.3 510±90 −1.1±0.6 500±200
SiII6347 −2.3±0.3 670±60 −3.3±0.7 570±100
SiII6371 −2.3±0.3 660±60 −3.7±1.0 820±160 NeI6402 −2.0±0.3 610±60 −3.0±0.9 630±150
NII6484 −2.3±0.3 490±50 −2.8±0.7 470±90
HeII6559 −2.8±0.2 730±50 −3.1±1.0 610±160 HeI6678 −34.8±0.6 590±10 −44.1±1.1 560±10
HeI7065 – – −48.9±1.8 540±10
[image:5.595.309.550.408.547.2]Note. The values marked ‘...’ could not be measured reliably. The values marked ‘–’ indicate that the line falls outside the wavelength coverage.
Figure 3. Flux-calibrated ISIS average spectrum of SDSS J1730 together with SDSS photometric fluxes (grey squares). The grey line overplotted represents a blackbody fitted to the spectrum,T=12 700±100 K. Data have been corrected for Galactic extinction.
each spectrum, a single value for the radial velocity, with a much greater precision than could be obtained for any single line. This allows us to detect the low-amplitude velocity variations exhibited by SDSS J1730.
We constructed a radial velocity curve from these measurements and calculated the Lomb–Scargle periodogram (Scargle1982); we assume that the strongest peak corresponds to the orbital period.
Figure 4. Lomb–Scargle periodogram calculated from the HeIradial ve-locities of SDSS J1730.
The radial velocities were then fitted with a circular orbit of the form,
V(t) = Ksin
2π(t−HJD0) Porb
+ γ, (1)
wherePorbis fixed to the value derived from the strongest peak in the periodogram.
We show the Lomb–Scargle periodogram calculated from the HeI radial velocities in Fig.4. A clear signal is seen around 40.86 cy-cle d−1, corresponding to a period of 35.2 min. As well as the obvious±1 cycle d−1aliases, there is a fine alias structure caused by the∼2 month offset between the Gemini and WHT observations. The HeIradial velocity curve, folded on this period, is shown in Fig.5. The parameters of the fits to equation (1), derived from the
at University of Warwick on January 23, 2014
http://mnras.oxfordjournals.org/
[image:5.595.47.287.411.582.2]Figure 5. Measured HeIradial velocities folded on a period of 35.2 min.
[image:6.595.45.281.57.180.2]The solid and dotted lines show the best-fitting radial velocity curve andγ velocity, the parameters are shown in Table3.
Table 3. Orbit parameters derived from radial velocity mea-surements. The orbital period is taken as the strongest peak in the periodogram and its uncertainty derived using the bootstrap method. The zero phase, velocity amplitude and systemic veloc-ity, and their corresponding uncertainties, result from the fit to equation (1).
Porb(min) HJD0 K(km s−1) γ(km s−1)
35.2±0.2 245 6068.9549(3) 14.2±1.1 −12.2±0.8
radial velocity measurements, are shown in Table 3. We take the zero phase, HJD0, as being defined by the blue to red crossing of the velocities.
We tried various sets of lines, finding that the exact choice has no effect on the period; we therefore used the maximum possible number of (strong) lines. The Lomb–Scargle derived period was also compared to the value derived using the phase dispersion mini-mization method (Stellingwerf1978), which gave consistent results. We cannot rule out some distortions of the systemic velocity due to the contamination of the HeI5875 line in the ISIS spectra; however, we find consistent values forγ when including or excluding this line, and so we include it for the ISIS radial velocity measurements in order to increase the signal to noise ratio.
The uncertainty on the period was estimated by carrying out 1000 bootstrap selections (Efron1979) of the radial velocity curve. For each subset, 217 radial velocities were selected from the full radial velocity curve, allowing for points to be selected more than once and the periodogram calculated, taking the strongest peak as the period. The standard deviation of these computed periods, 0.2 min, is taken as a measure of the uncertainty in the derived orbital period. We note that there is significant power in the±1 cycle d−1aliases seen in Fig.4, which correspond to periods of 34.4 and 36.1 min (see also the next section).
3.3 Dynamic spectrum
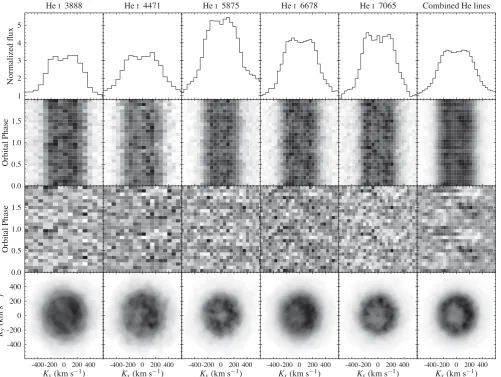
Trailed spectra for the strongest lines, folded on the orbital period, 35.2 min (40.9 cycles d−1), are shown in Fig.6. Some variability is evident in the trailed spectra, but the S-wave – commonly caused by the bright spot, formed by the impact of the accretion stream on to the outer disc – is clearly discernible only in the HeI6678, 7065 and combined HeIline trails. The trailed spectra are also displayed with the average line profile subtracted in order to enhance the variability. The corresponding Doppler tomograms (Marsh & Horne1988) give a similar picture of emission in the disc. A bright region or spot is visible in most of the lines shown. Since these maps were calculated
using the assumed zero phase, HJD0=245 6068.9549, the maps may be rotated due to the unknown phase shift between our zero phase and the true zero phase of the white dwarf.
Doppler maps created at the frequency of the strongest peak in the periodogram and on the daily aliases show a weak preference for the central frequency; however, we are unable to rule out the
±1 cycle d−1aliases due to the lack of a strong bright spot.
4 D I S C U S S I O N
We measure an orbital period Porb=35.2±0.2 min, confirming SDSS J1730 as an ultracompact binary. This puts SDSS J1730 in the longer period region of the outbursting AM CVn binary period distribution, and we would expect that the system would spend the majority of its time in a low state (with appearance similar to that observed here), with infrequent, longer duration outbursts, similar to those observed in V406 Hya (Porb=33.8 min; Roelofs et al.2006a) and SDSS J0129 (Porb=37.6 min; Kupfer et al.2013) (Ramsay et al.2012). We note that the Catalina Real-Time Transient Sur-vey light curve appears to show the decline from a single outburst during its 7 yr coverage (Drake et al.2009). The measured period is slightly shorter than that suggested by the EW of the HeI5875 emission line (Carter et al.2013), but does not indicate a significant deviation from the trend of EW increasing with orbital period.
Using double Gaussian fits to the emission lines, we find an average peak separation of 320 km s−1. The velocities of the two peaks in the line profile produced by an accretion disc are related to the Keplerian velocity at the outer radius of the disc and the inclination (Smak1981; Horne & Marsh1986). Thus, the velocities estimated for the peaks,±160 km s−1, can be used to constrain the inclination of the disc in SDSS J1730, with some assumptions about the masses of the two components, and the outer radius of the disc. In order to place a reasonable upper limit on the inclination, we adopt a primary mass,M1=0.6 M, and mass ratio,q=0.01. We take 80 per cent of the volume radius of the Roche lobe of the primary (Eggleton1983) as an estimate of the maximum disc radius, giving an inclinationi≤11◦.
The measured separation of the peaks in the line profiles also places an upper limit on the velocity of the donor,K2≤160 km s−1. If we assume that the measured radial velocity amplitude reflects the motion of the primary,K1, we obtain a mass ratio,q≥0.09. This is larger than typically found in AM CVn binaries with similar orbital periods (Roelofs et al.2005,2006a; Armstrong, Patterson & Kemp 2012and references therein; Kupfer et al. 2013), and we expect thatK1is in fact much smaller than our estimate. The radial velocity amplitude we obtained likely overestimatesK1due to contamination by the higher velocity S wave.
Bildsten et al. (2006) predict white dwarf surface temperatures in the range∼13 000–27 000 K for an AM CVn binary with an or-bital period of 35 min; the similar period systems V406 Hya and SDSS J1240−0159 both have estimated white dwarf temperatures of 17 000 K (Roelofs et al.2004; Bildsten et al.2006). Our estimate for SDSS J1730 is at the lower end of the expected range; however, at the orbital period of this system, the disc may contribute signif-icantly to the flux in quiescence (Bildsten et al.2006), especially with the disc being so close to ‘face-on’. The temperature of the ac-creting white dwarf may therefore be higher than this estimate from the continuum. The spectra of SDSS J1730 show no sign of helium absorption from the accretor, a feature that has been observed in several AM CVn binaries with orbital periods of 30–40 min (e.g. Roelofs et al.2006a). This would not be unexpected for a white dwarf with a temperature of 12 700 K, for which the disc would
at University of Warwick on January 23, 2014
http://mnras.oxfordjournals.org/
The AM CVn binary SDSS J1730
+
5545
2899
Figure 6. Average line profiles, phase-folded trailed spectra and Doppler maps for the strongest lines, and a combination of the eight strongest HeIlines. Here,
we use only the higher resolution ISIS spectra. The second row of trailed spectra have the average line profiles subtracted in order to enhance the variability.
easily hide the weak absorption lines; however, a hotter accretor would require that the disc is still relatively bright in comparison.
Metals are often detected in the quiescent spectra of AM CVn binaries and have been used to constrain the evolutionary history of some systems (Marsh et al.1991; Nelemans et al. 2010). In particular, the presence of nitrogen lines without the detection of carbon/oxygen would suggest a helium white dwarf donor (Nele-mans et al.2010). With NIIand NeIlines detected in the spectrum, we would expect to see strong carbon and oxygen features (Marsh et al.1991found that large N/C and N/O ratios were required to suppress these lines). Our spectral range does not extend far enough into the red to cover the wavelengths of many of the strongest car-bon, nitrogen and oxygen lines, so we cannot strongly constrain the N/C or N/O ratio with our data. That we see nitrogen lines but the CIIlines at 4267 and 6580 Å are missing implies an overabundance of nitrogen that likely rules out all but the least evolved helium star donors (Yungelson2008; Nelemans et al.2010).
Models of helium accretion discs with solar metal abundances predict that SiII6347 and 6371, FeII5169, and the CaIIH&K lines should be the strongest metal lines (Marsh et al.1991; Roelofs et al.
2005). Whilst the Si and Fe lines are clearly detected, there is no sign of Ca emission. This unexplained absence of calcium has been noted in several longer period AM CVn systems (e.g. Kupfer et al.2013), including the similar period system SDSS J1240−0159 (Roelofs
et al.2005). However, CaIIemission has been detected in the slightly shorter period systems PTF1 J0943+1029, PTF1 J0435+0029 (Levitan et al. 2013) and V406 Hya (Roelofs et al.2006a); the latter of which has a spectrum that otherwise appears remarkably similar to SDSS J1240. Kupfer et al. (2013) discuss this anomaly in more detail, suggesting that sedimentation or settling could explain the under abundance of calcium. With the exception of the peculiar AM CVn system SDSS J0804+616, there seems to be a sharp cut-off period for the appearance of calcium in AM CVn accretion discs. The low inclination of SDSS J1730 causes the emission lines to be very narrow, making their identification much easier. In most sys-tems, the broad double-peaked lines blend together, making it diffi-cult to determine which lines are present and their relative strengths. This makes SDSS J1730 an excellent target for a detailed abundance analysis, which has proved difficult in other AM CVn binaries. We encourageI-band spectroscopic observations in order to target the carbon, nitrogen and oxygen lines expected in this region that can reveal the prior evolution of the binary (Nelemans et al.2010).
5 C O N C L U S I O N
We have presented time-resolved spectroscopy of the AM CVn binary SDSS J1730, measuring an orbital period of
at University of Warwick on January 23, 2014
http://mnras.oxfordjournals.org/
35.2±0.2 min, confirming the ultracompact binary nature of the system.
The average spectrum shows strong double-peaked helium emis-sion lines, as well as a variety of metal lines, including neon, which has only been identified previously in GP Com. We detect no cal-cium in the accretion disc; this unexplained underabundance of calcium has been noted in the majority of the longer period AM CVn binaries.
We estimate the temperature of the continuum to be 12 700 ± 100 K using a blackbody fit. The absence of obvious underlying absorption in the average spectrum is consistent with an accreting white dwarf at this temperature; however, the disc is expected to make a significant contribution to the continuum flux at the orbital period of SDSS J1730, which likely affects this estimate (Bildsten et al.2006).
Using the measured peak velocities of the narrow double-peaked emission lines, we estimate an inclinationi≤11◦. This low inclina-tion makes SDSS J1730 an excellent system for the identificainclina-tion of emission lines and a good target for abundance analysis. With
I-band spectroscopy, we would be able to investigate the N/C and N/O ratios that reveal much about the prior evolution of AM CVn binaries (Nelemans et al.2010).
AC K N OW L E D G E M E N T S
We thank the anonymous referee for useful comments and sugges-tions. PJC acknowledges the support of a Science and Technology Facilities Council (STFC) studentship. DS and TRM acknowledge support from the STFC grant no. ST/I001719/1. T. Kupfer acknowl-edges support by the Netherlands Research School for Astronomy (NOVA). GN acknowledges an NWO-VIDI grant.
This work is based in part on observations made with the William Herschel Telescope operated on the island of La Palma by the Isaac Newton Group in the Spanish Observatorio del Roque de los Muchachos of the Instituto de Astrofsica de Canarias.
This work is also based in part on observations obtained under programme GN-2012A-Q-54 at the Gemini Observatory, which is operated by the Association of Universities for Research in Astronomy, Inc., under a cooperative agreement with the NSF on behalf of the Gemini partnership: the National Science Founda-tion (United States), the Science and Technology Facilities Council (United Kingdom), the National Research Council (Canada), CON-ICYT (Chile), the Australian Research Council (Australia), Min-ist´erio da Ciˆencia, Tecnologia e Inovac¸˜ao (Brazil) and Ministerio de Ciencia, Tecnolog´ıa e Innovaci´on Productiva (Argentina).
Funding for the SDSS and SDSS-II has been provided by the Alfred P. Sloan Foundation, the Participating Institutions, the Na-tional Science Foundation, the US Department of Energy, the National Aeronautics and Space Administration, the Japanese Monbukagakusho, the Max Planck Society and the Higher Ed-ucation Funding Council for England. The SDSS website is
http://www.sdss.org/.
This research has made use of NASA’s Astrophysics Data System and the NIST Atomic Spectra Database.
R E F E R E N C E S
Anderson S. F. et al., 2005, AJ, 130, 2230 Anderson S. F. et al., 2008, AJ, 135, 2108
Armstrong E., Patterson J., Kemp J., 2012, MNRAS, 421, 2310
Bildsten L., Townsley D. M., Deloye C. J., Nelemans G., 2006, ApJ, 640, 466
Bildsten L., Shen K. J., Weinberg N. N., Nelemans G., 2007, ApJ, 662, L95 Brown W. R., Kilic M., Allende Prieto C., Kenyon S. J., 2011, MNRAS,
411, L31
Carter P. J. et al., 2013, MNRAS, 429, 2143 Drake A. J. et al., 2009, ApJ, 696, 870 Efron B., 1979, Ann. Stat., 7, 1 Eggleton P. P., 1983, ApJ, 268, 368 Fitzpatrick E. L., 1999, PASP, 111, 63 G¨ansicke B. T. et al., 2009, MNRAS, 397, 2170
Hook I. M., Jørgensen I., Allington-Smith J. R., Davies R. L., Metcalfe N., Murowinski R. G., Crampton D., 2004, PASP, 116, 425
Horne K., Marsh T. R., 1986, MNRAS, 218, 761
Kotko I., Lasota J.-P., Dubus G., Hameury J.-M., 2012, A&A, 544, A13 Kupfer T., Groot P. J., Levitan D., Steeghs D., Marsh T. R., Rutten R. G. M.,
Nelemans G., 2013, MNRAS, 432, 2048 Levitan D. et al., 2011, ApJ, 739, 68 Levitan D. et al., 2013, MNRAS, 430, 996 Marsh T. R., 1989, PASP, 101, 1032
Marsh T. R., Horne K., 1988, MNRAS, 235, 269 Marsh T. R., Steeghs D., 2002, MNRAS, 331, L7 Marsh T. R., Horne K., Rosen S., 1991, ApJ, 366, 535 Nelemans G., 2009, Class. Quantum Grav., 26, 094030
Nelemans G., Yungelson L. R., van der Sluys M. V., Tout C. A., 2010, MNRAS, 401, 1347
Nissanke S., Vallisneri M., Nelemans G., Prince T. A., 2012, ApJ, 758, 131 O’Donoghue D., Kilkenny D., Chen A., Stobie R. S., Koen C., Warner B.,
Lawson W. A., 1994, MNRAS, 271, 910
Ramsay G., Barclay T., Steeghs D., Wheatley P. J., Hakala P., Kotko I., Rosen S., 2012, MNRAS, 419, 2836
Rappaport S., Joss P. C., Webbink R. F., 1982, ApJ, 254, 616
Rau A., Roelofs G. H. A., Groot P. J., Marsh T. R., Nelemans G., Steeghs D., Salvato M., Kasliwal M. M., 2010, ApJ, 708, 456
Roelofs G. H. A., Groot P. J., Steeghs D., Nelemans G., 2004, Rev. Mex. Astron. Astrofis. Conf. Ser., 20, 254
Roelofs G. H. A., Groot P. J., Marsh T. R., Steeghs D., Barros S. C. C., Nelemans G., 2005, MNRAS, 361, 487
Roelofs G. H. A., Groot P. J., Marsh T. R., Steeghs D., Nelemans G., 2006a, MNRAS, 365, 1109
Roelofs G. H. A., Groot P. J., Nelemans G., Marsh T. R., Steeghs D., 2006b, MNRAS, 371, 1231
Roelofs G. H. A., Nelemans G., Groot P. J., 2007a, MNRAS, 382, 685 Roelofs G. H. A., Groot P. J., Steeghs D., Marsh T. R., Nelemans G., 2007b,
MNRAS, 382382, 1643
Roelofs G. H. A. et al., 2009, MNRAS, 394, 367
Roelofs G. H. A., Rau A., Marsh T. R., Steeghs D., Groot P. J., Nelemans G., 2010, ApJ, 711, L138
Ruiz M. T., Rojo P. M., Garay G., Maza J., 2001, ApJ, 552, 679 Scargle J. D., 1982, ApJ, 263, 835
Schlegel D. J., Finkbeiner D. P., Davis M., 1998, ApJ, 500, 525 Shen K. J., Bildsten L., 2009, ApJ, 699, 1365
Shen K. J., Bildsten L., 2013, ApJ, preprint (arXiv:1305.6925) Smak J., 1981, Acta Astron., 31, 395
Solheim J., 2010, PASP, 122, 1133 Stellingwerf R. F., 1978, ApJ, 224, 953
Stroeer A., Vecchio A., 2006, Class. Quantum Grav., 23, 809 Tsugawa M., Osaki Y., 1997, PASJ, 49, 75
Warner B., 1995, Ap&SS, 225, 249 York D. G. et al., 2000, AJ, 120, 1579 Yungelson L. R., 2008, Astron. Lett., 34, 620
This paper has been typeset from a TEX/LATEX file prepared by the author.
at University of Warwick on January 23, 2014
http://mnras.oxfordjournals.org/