University of Warwick institutional repository:
http://go.warwick.ac.uk/wrap
A Thesis Submitted for the Degree of PhD at the University of Warwick
http://go.warwick.ac.uk/wrap/58401
This thesis is made available online and is protected by original copyright.
Please scroll down to view the document itself.
AUTHOR: Martine J. Barons DEGREE: Ph.D.
TITLE: What is the added value of using non-linear models to explore com-plex healthcare datasets?
DATE OF DEPOSIT: . . . .
I agree that this thesis shall be available in accordance with the regulations governing the University of Warwick theses.
I agree that the summary of this thesis may be submitted for publication. I agree that the thesis may be photocopied (single copies for study purposes only).
Theses with no restriction on photocopying will also be made available to the British Library for microlming. The British Library may supply copies to individuals or libraries. subject to a statement from them that the copy is supplied for non-publishing purposes. All copies supplied by the British Library will carry the following statement:
Attention is drawn to the fact that the copyright of this thesis rests with its author. This copy of the thesis has been supplied on the condition that anyone who consults it is understood to recognise that its copyright rests with its author and that no quotation from the thesis and no information derived from it may be published without the author's written consent.
AUTHOR'S SIGNATURE: . . . .
USER'S DECLARATION
1. I undertake not to quote or make use of any information from this thesis without making acknowledgement to the author.
2. I further undertake to allow no-one else to use this thesis while it is in my care.
DATE SIGNATURE ADDRESS
. . . .
. . . . . . . .
. . . .
What is the added value of using non-linear
models to explore complex healthcare
datasets?
by
Martine J. Barons
Thesis
Submitted to the University of Warwick
for the degree of
Doctor of Philosophy
Centre for Complexity Science
Contents
Acknowledgments v
Declarations vii
Abstract viii
Chapter 1 Introduction 1
1.1 Complex interventions . . . 1
1.2 Aims of this research . . . 13
Chapter 2 Literature Review 16 2.1 Classication for treatment allocation in back pain . . . 16
2.2 Non-linear relationships and machine learning for back pain . . . 21
2.2.1 Non-linear relationships . . . 22
2.2.2 Machine learning for back pain . . . 24
2.3 Cardiovascular Survival . . . 25
2.3.1 Primary prevention . . . 26
2.3.2 Secondary prevention . . . 27
2.3.3 Cardiac rehabilitation . . . 29
2.4 Articial Neural Networks for Survival . . . 38
2.4.1 The continuous-time approach . . . 39
2.4.2 A Bayesian approach . . . 42
Chapter 3 Data 44 3.1 Introduction to the Back Skills Training Trial Data . . . 44
3.1.1 Introduction . . . 44
3.1.2 Methods . . . 45
3.1.3 Missing values . . . 48
3.1.5 Discussion . . . 52
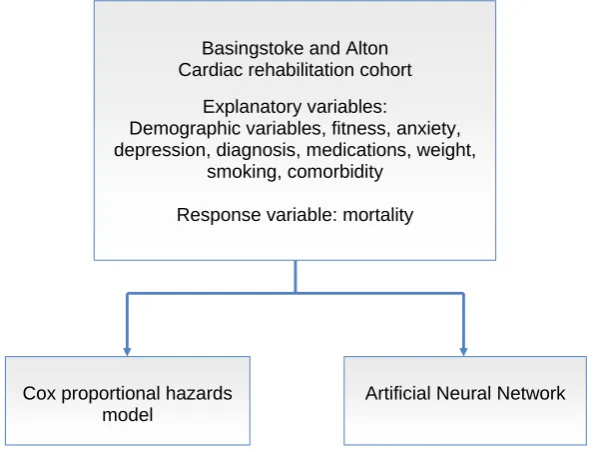
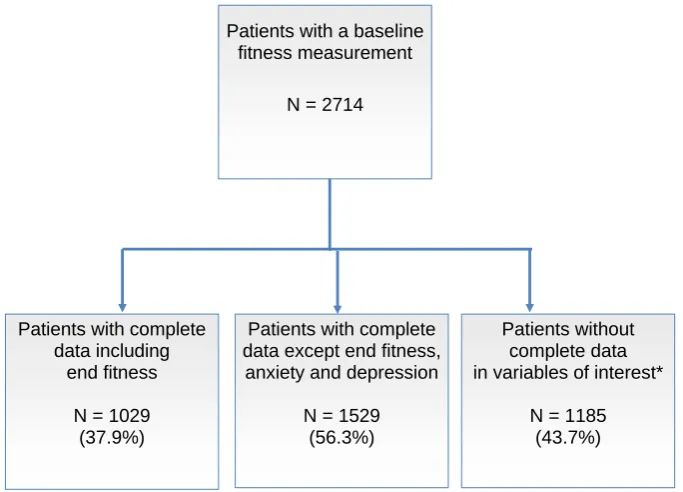
3.2 Introduction to Basingstoke and Alton Cardiac Rehabilitation data . . . 53
3.2.1 Introduction . . . 53
3.2.2 Method . . . 55
3.2.3 Missing values . . . 59
3.2.4 Previous results . . . 59
3.2.5 Discussion . . . 62
Chapter 4 Methods 1: Conventional Methods 64 4.1 Latent Class Analysis . . . 65
4.1.1 Introduction to latent class analysis . . . 66
4.1.2 Model selection . . . 68
4.1.3 Latent class analysis in R . . . 70
4.2 Survival Analysis . . . 71
4.2.1 Introduction to survival analysis . . . 71
4.2.2 Cox proportional hazards model . . . 75
4.3 Missing Data . . . 81
4.3.1 Introduction to analyses with missing data . . . 81
4.3.2 Imputation and multiple imputation . . . 83
4.3.3 Multiple imputation on the cardiovascular rehabilitation data 85 Chapter 5 Methods 2: Articial Neural Networks 87 5.1 Articial Neural Networks . . . 89
5.2 Articial Neural Networks for Survival Analysis . . . 93
5.3 Optimising the Network . . . 95
5.3.1 Minimising the error function . . . 95
5.3.2 Model complexity . . . 98
5.3.3 Cross validation . . . 99
5.3.4 The black box . . . 100
5.3.5 Applying the ANNs . . . 101
Chapter 6 Results 103 6.1 Analysis of BeST Back Pain Trial data . . . 104
6.2 Latent Class analysis of BeST Back Pain Trial data . . . 105
6.2.1 Principal ndings . . . 105
6.2.2 Introduction . . . 105
6.2.4 The models . . . 108
6.2.5 Patient characteristics for the three and four class models . . 109
6.2.6 Adjusting for other variables . . . 118
6.3 Articial Neural Network analysis of the BeST data . . . 124
6.3.1 Principal ndings . . . 124
6.3.2 Introduction . . . 124
6.3.3 Comparison metrics . . . 125
6.4 Analysis of the Basingstoke and Alton cardiac rehabilitation cohort data . . . 133
6.5 The Cox Model for Long-Term Survival After a Cardiovascular Event 134 6.5.1 Principal ndings . . . 134
6.5.2 Introduction . . . 134
6.5.3 Calculated variables . . . 135
6.6 Articial Neural Network for Modelling Long-Term Survival After a Cardiovascular Event . . . 154
6.6.1 Principal ndings . . . 154
6.6.2 Introduction . . . 154
6.6.3 Model t to data . . . 159
6.6.4 Model predictions compared . . . 161
Chapter 7 Discussion 175 7.1 Complexity Science . . . 175
7.2 Complexity in health care . . . 175
7.2.1 The Complexity challenge . . . 176
7.2.2 Complexity and clinical care . . . 177
7.2.3 Complexity in leadership and management . . . 177
7.2.4 Complexity and medical education . . . 178
7.2.5 Health as a complex system . . . 179
7.2.6 The complex individual . . . 179
7.3 Latent Class Analysis of BeST Back Pain Trial Data . . . 181
7.4 Articial Neural Network Analysis of the BeST Data . . . 184
7.5 The Cox Model for Long-Term Survival After a Cardiovascular Event 185 7.6 Articial Neural Network for Modelling Long-Term Survival After a Cardiovascular Event . . . 193
7.7.1 Can latent class analysis identify sub-sets of patients within a cohort of patients recruited to a clinical trial for non-specic
low back pain? . . . 195
7.7.2 Is it possible to use linear models and the classes identied by the latent class analysis to tailor interventions for non-specic low back pain to patients? . . . 196
7.7.3 How do the performances of the linear and non-linear mod-els compare for the prediction of patient outcomes following a cognitive behavioural approach intervention for non-specic low back pain? . . . 196
7.7.4 What is the potential for these linear and non-linear models to inform policy on the treatment of non-specic low back pain?197 7.7.5 Using a linear model, what predicts long-term survival after a cardiac event or procedure, at population level? . . . 198
7.7.6 Can a non-linear articial neural network be used to model long-term survival after a cardiac event or procedure? . . . . 198
7.7.7 How do linear and non-linear models compare in modelling the survival and hazard of a population who have experienced a a cardiac event or procedure? . . . 198
7.7.8 What is the potential for this research to inform policy for those who have experienced a a cardiac event or procedure? . 199 7.8 Future research . . . 199
7.8.1 BeST back pain trial . . . 199
7.8.2 Basingstoke & Alton cardiac rehabilitation . . . 202
7.9 Summary . . . 204
Chapter 8 Conclusion 206 Chapter 9 Appendix 241 9.1 Publications . . . 241
9.1.1 Published . . . 241
9.1.2 Submitted . . . 242
9.2 Diagnostic plots . . . 243
9.2.1 Survival models with imputed data . . . 243
9.2.2 Plots of the multiply imputed variable distributions . . . 252
Acknowledgments
No PhD thesis is completed in isolation and I am grateful for all my supportive friends and colleagues. You are too many to acknowledge individually, but I am grateful for each of you.
I acknowledge with enormous gratitude the support of my PhD supervisors Professor Frances Griths, Dr Nick Parsons and Professor Margaret Thorogood for lending me their expertise and giving freely of their time, patience, guidance and encourage-ment not only in my completion of this thesis and the associated research, but in the wider endeavour of becoming a research scientist, my public engagement activities and my involvement in professional bodies the IMA, IOP and RSS.
I would like to thank the sta and students at Warwick's Complexity Science doc-toral training centre for making it such a rich and invigorating place to work, with special thanks to its directors Professor Robin Ball and Professor Robert MacKay for their wisdom in designing and developing the centre, and for consistently warm personal encouragement throughout my MSc and PhD years.
I thank the Engineering and Physical Sciences Research Council (EPSRC) for fund-ing the doctoral trainfund-ing centre and my studentship. I also thank the centre, Warwick Medical School, the IMA and Warwick Statistics for additional conference funding.
data and its context, and for insightful comments on the research paper currently in preparation. I thank Professor Sallie Lamb for the use of the BeST trial data and for helpful comments on the research paper now submitted.
I express my gratitude to Professor Colin Reeves for helpful discussions and to him and Charles Johnston for supplying the MATLABR script oered in Reeves and
Johnston [2008].
I thank my father, Nigel Weaver, fellow PhD student Pádraig Mac Carron and Colin Reeves for careful proof reading of large parts of this thesis.
I cannot thank enough my husband, Chris, for his loving support, understanding and forbearance throughout the duration of my research studies as I established a new career after our sons had grown up. I thank our family Alex and Holly, Ed and Lauren, Greg and Amy for their support, encouragement and understanding and I thank Greg Barons for the production of Figure 5.1 using Bishop [1996].
I am eternally grateful to Jesus Christ who willingly grants to the undeserving, in-cluding me, more than we can ask or imagine.
This thesis was typeset with LATEX2ε1
1LATEX 2
εis an extension of LATEX. LATEX is a collection of macros for TEX. TEX is a trademark
Declarations
This thesis is submitted to the University of Warwick in support of my application for the degree of Doctor of Philosophy. It has been composed by myself and has not been submitted in any previous application for any degree.
The work I did using an articial neural network for exploring the BeST data in my MSc mini-project was a useful introduction the the data set and an opportunity to learn about machine learning techniques. None of that introductory work forms part of this thesis.
List of publications including submitted papers.
Martine J. Barons, Nick Parsons, Frances Griths, and Margaret Thorogood. A comparison of articial neural network, latent class analysis and logistic regression for determining which patients benet from a cognitive behavioural approach to treatment for non-specic low back pain. In IEEE Symposium on Computational Intelligence in Healthcare and e-health (CICARE) 2013, pages 7-11, 2013b.
Abstract
Health care is a complex system and it is therefore expected to behave in a non-linear manner. It is important for the delivery of health interventions to patients that the best possible analysis of available data is undertaken. Many of the conventional models used for health care data are linear. This research compares the performance of linear models with non-linear models for two health care data sets of complex interventions.
Logistic regression, latent class analysis and a classication articial neural network were each used to model outcomes for patients using data from a randomised con-trolled trial of a cognitive behavioural complex intervention for non-specic low back pain. A Cox proportional hazards model and an articial neural network were used to model survival and the hazards for dierent sub-groups of patients using an ob-servational study of a cardiovascular rehabilitation complex intervention.
The articial neural network and an ordinary logistic regression were more accurate in classifying patient recovery from back pain than a logistic regression on latent class membership. The most sensitive models were the articial neural network and the latent class logistic regression. The best overall performance was the articial neural network, providing both sensitivity and accuracy.
Survival was modelled equally well by the Cox model and the articial neural net-work, when compared to the empirical Kaplan-Meier survival curve. Long term survival for the cardiovascular patients was strongly associated with secondary pre-vention medications, and tness was also important. Moreover, improvement in tness during the rehabilitation period to a fairly modest `high tness' category was as advantageous for long-term survival as having achieved that same level of tness by the beginning of the rehabilitation period. Having adjusted for tness, BMI was not a predictor of long term survival after a cardiac event or procedure.
The Cox proportional hazards model was constrained by its assumptions to produce hazard trajectories proportional to the baseline hazard. The articial neural network model produced hazard trajectories that vary, giving rise to hypotheses about how the predictors of survival interact in their inuence on the hazard.
Table of Abbreviations
Abbreviation Meaning Explanation
AACVPR American Association of Cardiovascular
and Pulmonary Rehabilitation Page 56
ACE Angiotensin converting enzyme Page 28
AM Active management Page 45
ANN Articial Neural Network Page 89
ANOVA Analysis of Variance Page 18
BB Beta blockers Page 28
BeST The Back Skills Training Trial Page 44
BMI Body Mass Index Page 22
CBA Cognitive Behavioural Approach Page 45
CR Cardiac rehabilitation Page 59
EM Expectation maximisation Page 67
EQ-5D EuroQol Page 23
FA Fear avoidance Page 47
FABQ Fear Avoidance Beliefs Questionnaire Page 47
HADS Hospital Anxiety and Depression Scale Page 47
LBP Low back pain Page 45
LCA Latent Class Analysis Page 64
MAR Missing at random Page 83
MCAR Missing completely at random Page 83
MI Myocardial infarction Page 27
MLP Multi-layer perceptron Page 89
MMPI Minnesota Multiphasic Personality Inventory Page 18
MNAR Missing not at random Page 83
MVK Modied von Kor Page 46
NICE National Institute for Health and Clinical Excellence Page 17
PH Proportional hazards Page 76
PSE Pain self-ecacy Page 47
QALY quality-adjusted life year Page 46
QoL Quality of life Page 47
RCT Randomised controlled trial Page 17
RMQ Roland Morris Disability Questionnaire Page 46
SF12 Short Form 12 Page 47
Chapter 1
Introduction
1.1 Complex interventions
A complex intervention is conventionally dened as an intervention that has many parts which may work independently or interdependently (Campbell et al. [2000]). This thesis utilises data from two complex interventions which are described in detail in Chapter 3. This chapter introduces complex interventions and describes how they dier from other intervention types and how their development, implementation and evaluation are conducted using insights from complex adaptive systems concepts.
It is now accepted that many health care interventions are complex (Craig et al. [2008], Emsley et al. [2010], Lancaster et al. [2010], Burton [2012]). The con-trast with more simple interventions, such as a drug given to treat a single condition is that in clinical trials to establish ecacy, most sources of variability can be iden-tied and controlled for, either directly or by randomisation (Burton [2012], Hawe et al. [2004]). There is no sharp boundary between simple and complex interventions (Craig et al. [2008]). The greater the diculty in dening precisely what exactly the active ingredients of an intervention are and how they relate to each other, the greater the likelihood that you are dealing with a complex intervention (Craig et al. [2008]). Some highly complex interventions may comprise a set of individually com-plex interventions, such as the Sure Start intervention to support families with young children in deprived communities (Craig et al. [2008]).
The Medical Research Council identies 5 factors which make an intervention complex:
• Number and diculty of behaviours required by those delivering or receiving the intervention
• Number of groups or organisational levels targeted by the intervention
• Number and variability of outcomes
• Degree of exibility or tailoring of the intervention permitted
(Craig et al. [2008]).
In addition to interventions, health problems themselves can have dierent levels of complexity. Campbell et al. (Campbell et al. [2007]) illustrate this with the example of cardiovascular disease: High death rates in people with cardiovascular disease are aected by:
• Disease-Atherosclerosis, risk factors (cholesterol, blood pressure, smoking), co-morbidity
• Patient-Beliefs about lifestyle, adherence to treatment, and symptoms
• Practitioner-Accessibility, prescribing practices, practices in health promotion
• Health service-Availability of eective preventive and therapeutic care
• Policy-Policies on preventive services (tobacco control, diet, exercise, etc)
• Social context-Socioeconomic status, social support.
to physical suering, such as a cognitive behavioural approach to angina (Lewin et al. [2002]) or back pain (Lamb et al. [2010b]), or a cardiovascular rehabilitation intervention, which typically includes both psychological support and appropriate medication, exercise, and education (Turner [2007]). Since there are, by denition, many parts which may work independently or interdependently in a complex inter-vention, it can be dicult to design such an intervention such that it can be tested for ecacy and the successful parts or combinations identied. To this end, a panel of experts produced a framework for the design and evaluation of complex inter-vention in health in the year 2000 (Campbell et al. [2000]). They dene a 5-stage protocol, which need not be linear, where at each stage the ndings may inform the next or a reiteration of the previous stage. The 5 stages were:
• The preclinical stage for exploration of relevant theory
• Phase I modelling stage, for identifying the components of the intervention and their modes of eect.
• Phase II an exploratory trial where the insights from theory and modelling are tested
• Phase III the denitive randomised controlled trial, testing the complex inter-vention against an appropriate alternative
• Phase IV, the long-term implementation.
This framework was later criticised to be too close to the framework for a drug trial, which is usually a simple intervention. The framework was reviewed and updated in 2008 as experience of evaluating complex interventions accumulated and interest in the methodology had grown (Craig et al. [2008]). Several papers had identied limitations in the framework, recommending, for example, greater attention to early phase piloting and development work, a less linear model of evaluation process, in-tegration of process and outcome evaluation, recognition that complex interventions may work best if they are tailored to local contexts rather than completely stan-dardised, and greater use of the insights provided by the theory of complex adaptive systems (Craig et al. [2008]). However, the 2000 framework provides a useful way to organise an introduction to complex interventions and the issues that surround them.
Preclinical or theory phase
confounders and strategic design issues. Identifying evidence that an intervention might have the desired eect will include taking relevant evidence from outside health sciences (e.g. theory of organisational change) and may lead to adjustment of the hypothesis. Preliminary work can include simulation, qualitative testing through focus groups, etc. and case studies. Qualitative research can be used to ascertain the mechanism of ecacy and barriers to be overcome. A range of research methods can be used to collect evidence: systematic literature reviews, epidemiological research, and expert opinion to quantify the extent of the problem and identify the groups most at risk and the key modiable risks. For example, reasons for delayed presentation by patients with symptoms of lung cancer are poorly understood, so epidemiological and qualitative research is being undertaken to identify and quantify determinants and targets that may be amenable to intervention (Campbell et al. [2007]).
Conceptual modelling or mapping can clarify the mechanisms by which an in-tervention might achieve its aims. The process involves mapping out the mechanisms and pathways proposed to lead from the intervention to the desired outcomes, then adding evidence and data to this map. Modelling of the intervention both depends on, and informs, understanding of the underlying problem. The intervention must engage the target group and aect pathways amenable to change that are identied as important to the problem (Campbell et al. [2007]).
The term 'mediator' is commonly used for a variable on a causal pathway, and 'moderator' for a variable which modies the strength of part or all of a causal pathway. Complex interventions have, by denition, multiple components and are therefore characterised by complex treatment eect mechanisms with multiple medi-ators, with the possibility of moderators such as the background characteristics and environment of the patient.(Emsley et al. [2010]).
Phase I or Modelling phase
The second stage is Phase I when the intervention and the underlying mechanism by which they will inuence the outcome are identied. The purpose of this phase is to provide evidence that prediction of the relation between the components and the interaction between them can be made. Clearly, there is some overlap with the pre-vious phase in methodologies used to achieve this; simulated patients, for example, could be used in this phase, too. Preliminary surveys, focus groups and case studies can be used to dene components of the complex intervention and detailed descrip-tions of the setting or intervention variants can inform the design. Potential barriers can be identied through qualitative research, such as whether knowledge or lack of time or resources is the main barrier, and the intervention can be designed appro-priately. Some researchers identied barriers to patient participation that included concerns about information and consent; patient preferences for treatment and ad-ditional demands such as adad-ditional procedures. Barriers to clinician participation included lack of sta and training; concern about the impact on the doctor patient relationship; time constraints and diculties with the consent procedure (Lancaster et al. [2010]).
Phase II or Exploratory Trial
Phase II of this scheme is the exploratory trial in which a fully dened complex intervention is compared with a suitable alternative. For this, the protocol must be theoretically defensible, reproducible and adequately controlled. The study must also have appropriate statistical power. Lancaster et al (Lancaster et al. [2010]) provide a detailed discussion of statistical issues related to complex interventions in primary care, with particular emphasis on cluster randomised trials which are commonly used with complex interventions. Complex intervention trials often have designs with multiple parts and multiple routes through which an intervention can act and operate. Consequently there are larger number of covariates that may predict outcome, and which need to be considered to avoid confounding than would be found in a simple intervention for the same health problem (Lancaster et al. [2010]).
et al. [2010]).
Key objectives of a pilot study are:
• Test the integrity of the study protocol. This is especially important if multi-ple sites are to be involved. This includes evaluating the inclusion/exclusion criteria, determining if interim analyses are necessary.
• Sample size calculation. This is to obtain initial estimates, considering vari-ability and an estimate of intra-class correlation coecient if the main trial is to be cluster randomised.
• Recruitment and consent rates. This is important for planning the length of the study, the strategy for recruitment of practices and participants, how to explain the study in layman's terms, trial the readability of patient information and consent forms.
• Develop and test the implementation of the complex intervention. To deter-mine the optimal duration of delivery of the intervention, the ease of adherence, testing of materials, equipment and techniques, including if self-administration is possible, and whether support, such as an on-call help service is needed
• Determine the acceptability of the intervention to participants, assessors and funders, ascertain if there are any side eects and if costs are feasible and undertake pre-trial modelling of cost-eectiveness.
• Train sta in delivery and assessment procedures, determine inter-rater and intra-rater reliability if applicable, and carry out calibration of instruments. It is also important to trial the data collection, recording and data entry.
• Selection of most appropriate primary outcome measure, and determine if it would be useful to use more than one primary outcome measure or secondary outcome measures or biomarkers. Whether patient-reported outcomes are ap-propriate and reliable.
• Randomisation procedure implementation, including whether use of a 24 hour randomisation service is needed and its acceptability to participants.
• Prepare and plan data collection and monitoring procedures, covering databases, data entry, validation methods, backup, forms for monitoring adverse events and missing data minimisation strategies.
(Lancaster et al. [2010]).
The exploratory phase should ideally itself be randomised to allow assess-ment of the size of the eect. This initial assessassess-ment will provide a sound basis for calculating sample sizes for the main trial. Other design variables can also be estab-lished in an exploratory trial. Variability in individual level outcomes may reect higher level processes and sample sizes may need to be larger to take account of the extra variability and cluster randomised designs considered (Craig et al. [2008]). The ndings from a trial of a complex intervention are more generalisable if the trial takes place in the setting in which the eventual intervention is likely to be delivered and with the population likely to be oered the treatment.
In complex interventions, individual randomisation is often not possible, so cluster randomisation frequently is used (in which clusters (or groups) of individuals, rather than individuals themselves, are randomised.). This requires active partici-pation from general practices, nursing homes or households, for example, depending upon the unit of randomisation (Lancaster et al. [2010]). It is also often not pos-sible to conceal the allocation of the treatment from the patient, practitioner and researcher and the potential biases of unblinded trials need to be accounted for. A preference trial design is one where any patient who expresses a preference for one of the alternate treatment regimes is allocated to their preference and others at ran-dom, but results from a preference trial design can be hard to interpret. There is evidence that treatments patients prefer have greater eects (Adamson et al. [2008]). The CONSORT statements for individual and cluster randomised trials are helpful and informative for planning randomisation. They cover issues such as procedure, method and level of randomisation. The decision to randomise clusters requires justication because of the associated cost of the increased numbers of patients in-volved. The avoidance of potential contamination between individuals in dierent study arms is a common justication. It may also be the case that an individu-ally randomised trial is impossible or that a cluster randomisation would reect the manner in which an intervention would ultimately be delivered. (Lancaster et al. [2010]).
are two issues to consider for cluster randomised trials to optimise power: ensuring equal numbers of clusters and ensuring equal numbers of patients per treatment arm. In studies where few units of observation are randomised imbalances may lead to a reduction in study power. A design-stage alternative is to eliminate the occurrence of imbalance in chosen covariates by using a restricted randomisation method such as stratication by covariates when there are sucient randomisation units for this to be practicable (Lancaster et al. [2010]). Eldridge et al. (Eldridge et al. [2005]) give examples of dierent recruitment strategies and discuss what can be done to avoid bias in identifying and recruiting participants to cluster randomised trials, where recruitment may operate at a number of dierent levels (Lancaster et al. [2010]).
Care must be taken, therefore with eligibility criteria and recruitment of intervention sites and personnel: a trial of complex intervention needs to consider expertise of health professionals as well as investigations, drugs, treatment guidelines, arrangements for discharge and follow up and the organisation, management and skill mix of the unit where the intervention is delivered
Appropriate methods of analysis for individually randomised trials are based on standard methods of statistical analysis, which are well-documented. Whilst there are more complex issues to consider when analysing cluster randomised trials, where researchers have to account for groups of individuals within clusters (Lancaster et al. [2010]), neither of the complex interventions considered in this thesis were assessed through a cluster randomised trial, so details are not given here. Details of the analysis methods used are given in Chapter 4.
During Phase II, it is important to test for eects such as a learning curve, the feasibility of delivering the intervention in dierent places, consistency of delivery, and the acceptability of the intervention to both providers and patients. If evidence of a learning curve is found, adjustments should be made, such as a run-in period before recruitment to a trial to overcome confounding due to a learning curve in providers.
controlled trials. Relative attrition (attrition in the intervention group divided by the attrition in the control group) has been used as a measure of acceptability that allows the calculation of an overall eect estimate and the study of dierent levels of attrition based on the population of each trial (Lancaster et al. [2010]).
Suitable outcome measures should be ascertained by the exploratory trial. Outcomes can be measured at the individual level or at the level of a group or cluster, which in primary care research is usually the GP practice. In choosing the primary and secondary outcomes to be measured, it is vital that they are t for purpose, both theoretically and practically. An example of an interventions in primary care administered at the practice level might be the introduction of a universal parenting programme to prevent early childhood behavioural problems, with main outcomes concerning parenting, child behaviour and maternal mental health. In general, out-come measures need to be valid (i.e. shown to have face/concurrent/predictive valid-ity), to be repeatable (i.e. stable over time when the disease state is not changing), to be reproducible (i.e. when applied by dierent assessors), and to be objectively measured in situations where reporting may be unreliable (for example, self-reported smoking cessation with additional biochemical validation (Lancaster et al. [2010]).
The MRC guidance on developing and evaluating complex interventions states that researchers need to decide which outcomes are most important, which are sec-ondary, and how they will deal with multiple outcomes in the analysis. A single primary outcome and a small number of secondary outcomes are the most straight-forward for statistical analysis but may not represent the best use of the data or provide an adequate assessment of the success or otherwise of an intervention that has eects across a range of domains. It is important also to consider which sources of variation in outcomes matter and to plan appropriate subgroup analyses (Craig et al. [2008]).
All interventions need to be cost eective if they are to be used. Model building can be a cost-eective way of evaluating the likely quality-adjusted life-year (QALY) of an intervention from a complex intervention using data from a pilot study, which can also provide estimates of likely eectiveness and cost.
2.8% over a 12-month period. The major reason for this small eect was that less than a quarter of older people at risk of falling were assessed using their screening tool. Sensitivity analyses showed that the only scenarios that produced a substantial increase in the eect of the intervention were those in which all older people are assessed, and this was not cost-eective. They found that even if policy-makers were willing to spend ¿30,000 per QALY gained, there was only a 40% chance that the intervention would be cost-eective (Lancaster et al. [2010]). The value of well designed pilot or feasibility studies, prior to large multi-centre randomised controlled trials, is illustrated by the feasibility study for the UK Back pain, Exercise, Active management and Manipulation (UK BEAM) trial. The aim was to pilot all aspects of the trial including the intervention, to identify problems in design or execution, to investigate unresolved issues and to demonstrate that the main trial could full its aims, in terms of its design and implementation, and was therefore worthy of funding. Overall, the feasibility study demonstrated that the majority of methods and processes were successful. It identied where changes were required to the trial design or execution and highlighted unexpected problems, allowing further design changes before the start of the main trial. This study proved that pilot studies are vital, especially when evaluating complex interventions, for providing planning information and identifying unanticipated issues in advance of expensive, complex trials (Lancaster et al. [2010]).
Using the information from the exploratory trial, the optimum intervention is developed, possibly in a variety of versions, and consideration given to consistency of delivery and whether there is evidence of improved performance of the intervention over time. A suitable control intervention and outcome measures will have been found.
Phase III the denitive trial
implemented and received in dierent ways (Oakley et al. [2006]). For example, the RIPPLE (randomised intervention of pupil peer-led sex education) study was a cluster RCT designed to investigate whether peer delivered sex education is more eective than teacher delivered sessions at decreasing risky sexual behaviour. By integrating process and outcome data, the ability to interpret results according to empirical evidence was maximised (Oakley et al. [2006]).
With most (simple) interventions, integrity is dened as having the "dose" delivered at an optimal level and in the same way in each site. Complex intervention thinking denes integrity of interventions dierently. The issue is to allow the form to be adapted while standardising the process and function (Hawe et al. [2004]). If standardisation is taken to mean that all the components of an intervention are the same in dierent sites, this treats a complex intervention as if it were a sim-ple intervention. An alternative way of thinking about standardisation is that the xed aspects of the intervention are the essential functions (the steps in the change process that the elements are purporting to facilitate or the key functions that they are meant to have) and the variable aspect is their form in dierent contexts. In this way an intervention evaluated in a pragmatic, eectiveness, or real world trial would not be dened haphazardly. In evaluations seeking to identify active ingre-dients within a complex intervention, strict standardisation may be required and controls put in place to limit variation in implementation, but some interventions are designed to be adapted to local circumstances. In complex interventions, the function and process of the intervention should be standardised not the components themselves. This allows the form to be tailored to local conditions and could im-prove eectiveness. Intervention integrity is then dened as evidence of t with the theory or principles of the hypothesised change process. For example, in a trial of a school based intervention to promote health and wellbeing, schools were encouraged to use a standardised process to develop strategies which suited them rather than adopt a xed curriculum, resulting in widely varied practice between schools (Hawe et al. [2004]). Reports of such studies should include a detailed description of the intervention to enable replication, evidence synthesis, and wider implementation.
Phase IV, the long-term implementation
un-common, such studies can be highly informative.
Summary
In summary, the process of developing and evaluating a complex intervention has several phases, which may not follow a linear sequence. Experimental designs are pre-ferred to observational designs in most circumstances, but are not always practicable. Complex interventions may work best if tailored to local circumstances rather than being completely standardised. Understanding processes is important but does not replace evaluation of outcomes (Craig et al. [2008]). Trials of complex interventions are of increasing importance because of the drive to provide the most cost eective health care. Although such trials pose substantial challenges to investigators, the use of an iterative phased approach that harnesses qualitative and quantitative meth-ods should lead to improved study design, execution, and generalisability of results (Campbell et al. [2000]).
Another denition
One of the more recent developments in the consideration of complex interventions in heath care is the greater use of the insights provided by the theory of complex adaptive systems (Shiell et al. [2008]). Shiell et al. state that although it is rarely delineated, complexity in healthcare has two meanings. In the rst it is a property of the intervention, and in the second it is a property of the system in which the intervention is implemented. The rst view of complexity, that complex intervention is "built up from a number of components, which may act both independently and inter-dependently" makes it hard to dene the "active ingredients" and to be sure which component or combinations of components is more important. This is the more often used denition and the one used above.
the context for change e.g. the ban on smoking in public places (Shiell et al. [2008]). The rst empirical evidence to support the argument that complex interven-tions are interveninterven-tions in complex systems was provided by Burton (Burton [2012]). One testable property of complex systems is the presence of characteristic heavy-tailed statistical distributions. Such distributions appear to be ubiquitous in nature and have also been found in healthcare systems. These distributions are very dier-ent from the Gaussian (normal) distribution which characterises the distribution of simple eects. If complex interventions are truly interventions in complex systems the eect sizes of these interventions should be expected to show a heavy-tailed distribution, typical of those seen in other complex systems (Burton [2012]).
The eect sizes of a range of complex interventions collected and processed by the methodologically rigorous Cochrane review group was used to reduce the chance that the distribution of eect sizes found was due to the inclusion of methodologically weak studies with high risk of bias. When tting these data, Burton found the eect sizes had heavy tailed distributions typical of those seen in classical complex systems, supporting the notion of complex interventions as interventions in complex systems (Burton [2012]).
Under either denition, complex interventions oer the possibility of tailoring interventions to patients, and methodological techniques for the analysis of data from complex interventions is needed. This thesis explores dierent methods for analysing data from two distinct complex interventions.
1.2 Aims of this research
appropriately (Nabney [2002]). This means these models have the full capability required for modelling non-linear relationships between variables.
Two exemplar data sets were used, one from each of two common study types in health research, namely the randomised controlled trial and the observa-tional cohort study. Each data set contains information about patients' responses to a complex intervention.
In order to achieve the aims of this research, one goal was to build on the population-level information provided by the standard analysis in the Back Skills Training Trial (BeST) of a cognitive behavioural approach to low back pain (Lamb et al. [2010b]) and investigate whether non-linear models enable individual tailoring to be possible for this treatment. i.e. to discover whether it is feasible to predict which patients will benet from the treatment. If so, this has potential to inform clinical decision making when recommending treatment for an individual presenting with low back pain. The accuracy of predictions of both linear an non-linear mod-els were compared to test the hypothesis that allowing for non-linear relationships among the explanatory variables leads to improvements in performance in modelling this complex system.
Another goal was to ascertain what predicts long-term survival after a car-diac event or procedure using data from a cardiovascular rehabilitation population. A linear and non-linear model was each tted using the same explanatory variables and compared to ascertain which gave a better t to the population survival curve. The two models were then be assessed for their performance to predict hazards for groups of people with the same values of the explanatory variables. By comparing plots that dier in just one covariate, interrelations between the covariates were hy-pothesised.
In order to achieve the research aim, a number of specic objectives were formulated:
• Can latent class analysis identify sub-sets of patients within a cohort of patients recruited to a clinical trial for non-specic low back pain?
• Is it possible to use linear models and the classes identied by the latent class analysis to tailor interventions for non-specic low back pain to patients?
the prediction of patient outcomes following a cognitive behavioural approach intervention for non-specic low back pain?
• What is the potential for these linear and non-linear models to inform policy on the treatment of non-specic low back pain?
• Using a linear model, what predicts long-term survival after a cardiac event or procedure, at population level?
• Can a non-linear articial neural network be used to model long-term survival after a cardiac event or procedure?
• How do linear and non-linear models compare in modelling the survival and hazard of a population who have experienced a cardiac event or procedure?
• What is the potential for this research to inform policy for those who have experienced a cardiac event or procedure?
Chapter 2
Literature Review
This literature review is divided into four sections, each being mirrored by a section in the results chapter. The rst section is an overview of classication of patients for the allocation of treatments for back pain, and discusses a variety of approaches to classication. The second section explores the use of Articial Neural Networks (ANNs) to classify patient outcomes. The next section gives and overview of what is known about long and short term survival in cardiac patients, focusing on the covariates that predict survival in those two time scales, and the nal section explores the use of ANNs for survival analysis.
The purpose of this literature overview is to provide background for the research question and an indication of where the question ts with the existing literature. It also provides background for the analysis decisions and the interpretation of the results. A thorough search has been made for the latest reviews and studies, however this overview is not claimed to be a systematic review in the formal sense.
2.1 Classication for treatment allocation in back pain
ways of classifying those seeking treatment so that classes of patients can be matched to interventions in order to maximize treatment eect (Kent et al. [2010]). Many dierent classications have been developed, including biopsychosocial classications (McCarthy et al. [2004]), but there is little consensus on their use (Kent and Keating [2005]). For non-specic low back pain of greater than 6 weeks duration, the UK National Institute of Health and Clinical Excellence (NICE) has suggested patient preference should guide the choice of treatment from a range of eective interventions (NICE [2009]). The Latent Class Analysis (LCA) of the BeST data aimed to provide additional guidance for patients and clinicians as whether or not to consider the use of a cognitive behavioural approach (Lamb et al. [2010b], Barons et al. [2013a]).
The next section describes studies which did not appear in this review either because they were published later, or were excluded from the review because they are not clinical classications but statistical partitioning of data.
Delitto's classication-based treatment approach (Hebert et al. [2011]) was compared with usual care in an RCT of 156 patients with sub-acute and chronic back pain, split 74 to classication and 82 to usual care (Apeldoorn et al. [2012]). Classication-based treatment was direction-specic exercise, spinal manipulation or stabilization exercises. Delitto's classication is also based on therapist observa-tions, and the Apeldoorn study found no statistically signicant dierences between treatment groups. In an observational study, an association between cluster and subjective pain intensity was found in patients who had participated in a chronic pain-management programme (Chapman and Pemberton [1994]). 122 Patients were followed up 6-66 months later and classied into 7 groups using the Minnesota Mul-tiphasic Personality Inventory (MMPI) using repeated measures analysis of variance (ANOVA). Clusters were also associated with occupation in univariate ANOVA. In a cohort of 301 LBP patients, a hypervigilant sub-group was identied using a standardised clinical examination with good between-therapist agreement and used by physiotherapists (McCarthy et al. [2011]). This means of identication of dis-tinct patient sub-type is accompanied by a suggestion that the hypervigilant might be targeted, but this was not tested. Distinguishing between neuropathic and non-neuropathic pain using the PainDETECT questionnaire with 145 patients in sec-ondary care with 3 to 12 months of LBP did not predict treatment response to a usual care only intervention, but did predict prognosis - those patients with neu-ropathic pain had more pain, more limited activity and poorer self-rated health at baseline, 3 and 12 months (Morso et al. [2011]).
A variety of work has been published using statistical methods for partition-ing data sets of patients with low back pain.
standard 9-dimensions (S-Score) and in a modied 10-dimensions (F-Score) which was formed by an alternative division of response scales. The SCL-90 was admin-istered at baseline and at follow-up 2 weeks to one month later and compliance to whatever treatment was recommended for the individual was recorded as a di-chotomous variable. The optimal clustering using the S-Score was 3 clusters for each gender, whilst using the F-score the optimal was 3 clusters for males and 4 for females. The mean scores within each cluster on each of the score was reported. The clusters were numbered by size and 37% of males and 48% of females changed cluster number between scoring schemes. No links of cluster allocation to outcome were tested, and there were no reliability studies. In addition, 65% of the cohort was unemployed with 90% of those attributing their work status to the back pain. A k-means algorithm was used to divide MMPI scores into 5 clusters for a cohort of 401 patients (60% female) with chronic LBP (McCreary [1985]). The intital clus-tering was performed on 271 cases, the remaining 130 reserved for cross-validation. Outcome was improvement in pain intensity during the previous week evaluated at baseline and follow-up 6 months to one year later (54% response rate). The same cluster characteristics were found in the cross-validation set. Treatment was a tai-lored combination of rest, exercises, advice and analgesic medication; the authors do not say how the tailoring diered. The ability to predict improvement in pain intensity from cluster membership was superior in males, and one particular clus-ter predicted both poor (below average) improvement in pain intensity for men and good (above average) improvement in pain intensity for women, although the au-thors concede that the small numbers in the separate-gender analyses may make the results unstable. They concluded that a larger percentage of men showed severe psychological disturbances and poor response to medical treatment.
The k-means clustering algorithm was used in an adapted form to learn a division of 21 patients into those who did and did not experience signicant pain reduc-tion of LBP using dynamic transcutaneous electrical nerve stimulareduc-tion (DTENS) (Akhmadeeva et al. [2010]). The algorithm was trained on 74 clinical and paraclin-ical factors including health-related quality of life and the results of psychologparaclin-ical testing. For an independent cohort of 35 patients who all experienced signicant pain reduction, the algorithm was able to able to predict signicant pain reduction for 70% and possible pain reduction for the remaining 30%. Since the algorithm was not tested on patients whose outcome was little no pain reduction, no assessment of its use in the general population can be made.
pa-tients (n=170, 82 & 124; Langworthy and Breen [1997]). A technique of sequential testing of squared Euclidean distance was employed to construct dendograms to identify clusters. (A dendogram is a tree diagram used to illustrate the arrangement of the clusters produced by hierarchical clustering.) Two clusters was found to be optimal in all three cohorts and these corresponded to patients with constant pain and patients with cyclic pain (i.e. that is worse at certain times of the day) in each cohort. None of the demographic features (age, sex, social class and job status) was association with cluster membership. The clusters were not used to inform treatment decision.
as-signed randomly 2:1 to intervention and control (Hill et al. [2011]). In the control group, treatment decisions were made on the basis of the physiotherapists' clinical judgment, without knowledge of a participant's STarT Back Tool classication. In the intervention group, the high risk patients received support for psychosocial barri-ers to recovery in addition to the physiotherapy for symptoms and function received by the medium risk group. All groups in the intervention received advice, a copy of The Back Book, information about exercise facilities and saw a a 15-min educational video entitled `Get Back Active'. There was a larger improvement in RMQ scores in the intervention group at 4 and 12 months, and the cost was lower (Whitehurst et al. [2012]). The tool is published on the web and is free to download. Some prac-titioners in the UK and elsewhere have declared themselves to be users and describe the treatment they use. (STarT [accessed 18/05/13])
Many studies have used classication techniques to distinguish between cat-egories of patients with low back pain, and a few have used such classications to inform treatment regimens. In the few cases where an attempt was made to asso-ciate classication with outcome, only pain intensity was considered, and not back pain disability as measured by tools like the RMQ. In the one case where RMQ was used as an outcome, a new back screening tool was being tested and the treat-ment was related to items that could potentially be modied by treattreat-ment options in primary care. Very few studies have used classications dened solely by patient questionnaires and just one has used the factors interventions may tackle as the basis for classication. The conclusion of the 2011 systematic review largely still stands; there continues to be a need for classication which directs treatments. In particu-lar, research that increases understanding of the complex interaction within people, within complex interventions and between people and the interventions, would be very benecial, particularly in decision support, design of interventions and tailoring interventions to patients.
2.2 Non-linear relationships and machine learning for
back pain
2.2.1 Non-linear relationships
Previous studies on non-specic low back pain have found non-linear relationships between physical activity and back pain.
In a cross-sectional survey of employees in two Swiss national companies undertaken between 1996 and 1998, frequency of physical activity per week during leisure time had a signicant but non-linear relationship to back pain (Lee et al. [2005]). Par-ticipation was 41% of all employees giving 10,321 participants (6,251 = 60.6% male, mean age 39.9±10.8 years and 4,070 = 39.4% female, mean age 37.9±11.3 years). Using both a self-administered questionnaire and physical tness tests, this study assessed participants' general constitution, physical problems, back pain, work en-vironment, stress, smoking habits and physical activity. Participants were asked whether they performed physical activity (running, cycling, aerobics, etc.) in their leisure time at least once a week and on how many days a week. The number of days (one to seven times per week) was taken as an indicator for physical activity. A t-ness test was carried out under the supervision of doctors and nurses who visited the various branches of both companies and assessed endurance, exibility, upper body strength and abdominal musculature, which was then compared with the normal range of the healthy population for those age groups. 4,945 (48%) reported having had mild back pain in the previous 4 weeks, and 696 (7%) reported having suered from severe back pain. The severe back pain group comprised 340 (48.9%) women and 356 (51.1%) men; the percentage of men was statistically signicantly higher. No association between body mass index (BMI: weight in kilogrammes divided by (height in metres)2) and back pain was found. In univariate analyses, exibility,
upper body strength, abdominal strength, age (especially over 55 years), smoking category, and the sum of the stress factors were statistically signicant. Stress factor scores for smokers, non-smokers and ex-smokers were signicantly dierent. Fre-quency of physical activity per week had a signicant but non-linear relationship to back pain: no or little activity (none to two times a week), but also intensive phys-ical activity (six to seven times a week), was associated with back pain. However, moderate activity (three to four times a week) was associated with less back pain (χ2=30.86, P<0.001). A similar relationship was found for intense back pain and
physical activity (χ2=31.78, P<0.001). In multivariate analyses, back pain
A previous, similar workplace cross-sectional study had uncovered an inter-action between ergonomic work variables and poor psychosocial work environment (a composite of workload, work content and social support, Linton [1990]). In this study, a relationship between regular exercise and back pain was not found, but back pain was not categorised or clearly dened by minimum pain intensity or du-ration, and the authors admit that this may have masked the eect. Heavy lifting, monotonous work, uncomfortable posture, vibration, age, workload, work content and social support was each associated with low back pain. In addition, an inter-action between psychosocial environment and each of monotonous work, lifting and posture was found to be of greater signicance than the constituent variables alone. Furthermore, the relationship between age and psychosocial factors was found to be nonlinear, with the under-30 and over-50 age groups more strongly aected by psychosocial environment than the intermediate age groups.
EuroQol (EQ-5D) measures health-related quality of life and is composed of 5 dimen-sions, each with 3 levels and a visual analogue scale. To account for the dierences between national characteristics, the scoring of the 5 dimensions is calibrated by cal-culating specic national coecients in the linear model that relates the dimension levels with the visual analogue scale to produce a single-number summary. Using a cohort of 633 patients with low back pain, the Spanish version of EQ-5D was shown to give statistically dierent model coecients for those with LBP than the gen-eral population (Zamora et al. [2007]). It was also shown that a non-linear model (in which the regression coecients noticeably indicated the presence of non-linear eects in the dierent dimensions of the EQ-5D instrument) gave a more accurate prediction of the visual analogue scale from the scores of the 5-dimensions.
2.2.2 Machine learning for back pain
Articial Neural Networks (ANNs) belong to a class of learning methods that de-veloped separately in the distinct elds of statistics and articial intelligence, based on essentially identical models and are described in detail on page 89. They can be represented by a network diagram like Figure 5.1, and their architecture is described by the number of layers, and the number of units in each layer e.g., 6-3-2 is a 3 layer network with 6 input units (explanatory variables), 3 hidden units (units in the single hidden layer) and 2 output units (response variables). The transfer or activation function is the function applied to the weighted sum of the inputs to a unit to provide the output of the layer.
behaviour, thoughts of suppression). Accuracy was 83% with sensitivity 78% and specicty 97%, with no reported validation. The authors conclude that this could aid the early detection of risks for chronicity which could lead to improved cognitive, be-havioural and emotional management of patients to aid the avoidance of chronicity. Another 3-layer ANN (378-n-5, n not given) was used to classify patients referred to surgical spine clinic into one of 5 diagnoses using pain drawings used routinely as a diagnostic tool (Sanders and Mann [2000]). Types of pain were marked on a human outline and a clinician examined the patterns to see if they follow a dermatomal pattern, a segmented eld of skin innervated by a spinal nerve. The drawings were digitised using a video camera and segmented into 85 regions derived from low back pain dermatomes and gross anatomical regions. The number of pixels with a pain mark was normalised by the number of pixels in the region. Training was carried out on 200 samples and testing on 50, and overtting avoided by early stopping. The ANN sensitivity was 49% which was statistically equivalent to the physicians (51%) and was a statistically signicantly improvement over discriminant analysis (46%). The authors conjecture that low number of cases and an inadequate image capture might explain the disappointing sensitivity.
ANNs have been employed to aid diagnosis of genuine back pain, to assess risk of chronicity and to diagnose the origin or type of back pain. No literature has been found that uses ANNs to predict the outcome of a specic treatment for back pain based on baseline measurements of the patient characteristics that the inter-vention was designed to tackle. Similarly, no literature has been found addressing the usefulness of ANN prediction of outcome to tailor treatments to patients.
2.3 Cardiovascular Survival
There are a number of factors known to be associated with the development of cardiovascular disease (CVD). A recent study, based on the Framingham Ospring cohort, assessed the eect of risk factors measured at baseline on the long term (30-year) risk of developing hard cardiovascular disease (hard CVD is used to mean coronary death, myocardial infarction and fatal and non-fatal stroke) in those free of CVD and cancer at baseline examined using Cox regression (Pencina et al. [2009]). In a secondary model full CVD was used as outcome. Considering the extensive length of follow-up and the potential bias due to the competing risk of non-cardiovascular mortality in the prediction of long-term risk, the estimates were adjusted for the competing risk of non-CVD mortality as those who die of non-cardiovascular causes are ineligible for development of CVD events. Standard CVD risk factors (male sex, age, systolic blood pressure, anti-hypertensive treatment, total and HDL cholesterol, smoking and diabetes) were highly signicant in the multivariate model. BMI was weakly signicant in the nal model, but in a simplied oce-based risk model in which BMI replaced the lipids it was highly signicant along with all other risk fac-tors. In time-dependent analysis updating all variables approximately every 4 years, all standard risk factors remained signicantly related to the hard CVD outcome with hazard ratios similar to those obtained in 30-year risk models. BMI lost its entire impact in time-dependent model. The authors conclude that this nding il-lustrates how the eect of BMI is mediated through other risk factors: it was present in 30-year risk model when the follow-up is extended for a long period from the base-line but then it impacted the individual risk factors, and after controlling for this impact in time-updated models, BMI lost its signicance.
2.3.1 Primary prevention
Primary prevention is preventing illness in someone who does not currently have the illness. There is no single cause for coronary heart disease, although a cluster of risk factors has been identied which make individuals more prone to developing it. Some are unalterable, such as being male or inheriting a family history, but other known risk factors such as smoking, depression, raised cholesterol and sedentary lifestyle can be modied.
synthe-sise estimates stratied by age, gender, and area deprivation quintiles for the English population aged 25 and older between 2000 and 2007. IMPACT is an epidemiological model used to explain the contributions of population-level risk factor changes (inci-dence reduction) and uptake of evi(inci-dence-based treatments (case fatality reduction) to the change in CHD deaths between two points in time. This model suggested that approximately half the recent CHD mortality fall in England was attributable to im-proved treatment uptake. This benet occurred evenly across all social groups. The single largest contribution to the overall CHD mortality decrease came from a popu-lation fall in systolic blood pressure amongst those not on hypertensive medications with relatively small gains from hypertension therapies. Furthermore, moderate de-clines in smoking levels were actually greater in deprived areas (Bajekal et al. [2012]). A recent Cochrane review into the reduction and alteration of fat in the diet (Hooper et al. [2012]) concluded that total mortality and cardiovascular mortality were unaf-fected by reduction of fat in the diet; there was a small reduction in cardiovascular risk on modication of dietary fats but not reduction in total fats.
The most successful CVD primary prevention strategies have been reduction in smok-ing and blood pressure and uptake of medications.
2.3.2 Secondary prevention
Secondary prevention is used to mean methods to diagnose and treat existent disease in early stages before it causes signicant morbidity.
While many studies have reported on the eects of treatment on short term case fatality (Gale et al. [2008], Vale et al. [2011b], Greenhalgh et al. [2010], Nordmann et al. [2005], Elfstrom et al. [2012], Mikhail [2005], Kodama et al. [2009], Singh [2003]) there is much less evidence published on factors associated with the long term sur-vival (greater than 5 years) of individuals who have experienced a coronary event (e.g. myocardial infarction, MI, heart attack) or procedure (e.g. coronary artery bypass graft, CABG, percutaneous coronary intervention, PCI) (Grundtvig [2012], Grundtvig et al. [2011], Hannan [2012], Kavanagh et al. [2002]) and predictors of long- and short-term survival dier (Filardo et al. [2012], Fox et al. [2008], Shahian et al. [2012]). This review investigates what is know about risk factors for short and long term survival for such individuals.
of early survival in CABG patients over the age of 65 do not aect long-term sur-vival, but late mortality is increasingly associated with chronic diseases and health behaviours (Shahian et al. [2012]). Patients who were dened as having limited functional status before undergoing CABG did not have a dierent long-term all-cause mortality from those who did not (Cervera et al. [2012]). Patients undergoing CABG or valve surgery and who have prolonged stay in intensive care also have poorer long-term survival (Elfstrom et al. [2012]). The change in denition of MI which was introduced in 2000 (Antman et al. [2000], Thygesen et al. [2012]), diag-nosed many more patients with MI than under the previous denition. However, the long-term survival of patients diagnosed with MI under either scheme is not signicantly dierent (Grundtvig [2012]). Fitness as measured peak oxygen intake,
V O2 max, (most accurate measure of exercise capacity) was found to be a
predic-tor of long-term mortality of both men and women; even moderate tness conferred a 50% reduction in cardiac mortality (Kavanagh et al. [2002], Kavanagh et al. [2003]).
Statins are a class of drugs used to lower cholesterol levels by inhibiting the enzyme HMG-CoA reductase, which plays a central role in the production of choles-terol in the liver. Statins have gained a pivotal role in the primary and secondary prevention of coronary artery disease, and are thought to improve perioperative outcomes in patients undergoing cardiac surgery. A recent Cochrane review (Li-akopoulos et al. [2012]) identied eleven randomised controlled trials with a total of 984 patients undergoing cardiac surgical procedures, and found that preoperative statins reduced postoperative atrial brillation and was associated with a shorter stay in the intensive care unit. Statins failed to inuence short-term perioperative mortality and there was no reduction in MI. Early statin treatment (initiation within 14 days) for patients with acute coronary syndrome (ACS) reduced the occurrence of unstable angina at 4 months following ACS, but did not reduce death, MI or stroke up to 4 months following ACS (Vale et al. [2011a]).
in men and women. The highest absolute benet from beta-blockers was found in people who were over 50 years of age, with a higher heart rate at study entry, with a history of MI, angina pectoris, hypertension, or treatment with digitalis, and with transient signs or symptoms of mechanical or electrical failure in the early phases of MI (Skinner and Cooper [2011]). The same review advised that ACE inhibitors should be considered for secondary prevention in all patients after acute MI with left ventricular systolic dysfunction and in high-risk patients without left ventricular systolic dysfunction. It further suggested that after CABG, ACE inhibitors should be initiated with caution in low-risk patients without left ventricular dysfunction. The benets of ACE inhibitors in very low-risk patients with a previous MI and without left ventricular dysfunction may warrant further investigation. If this ad-vice is followed, those taking ACE inhibitors are those at increased risk.
2.3.3 Cardiac rehabilitation
Following a cardiac event or procedure, patients are routinely referred to Cardiac rehabilitation (CR, Bethell et al. [2009]). Cardiac rehabilitation is the process by which patients with cardiac disease are encouraged and supported to achieve and maintain optimal physical and psychosocial health and is a complex intervention consisting of three core elements: education, exercise training and psychological support (Heran et al. [2011], Jollie et al. [2009], Bethell and Mullee [1990], Bethell et al. [1983], Bethell et al. [2009], Plüss et al. [2008], Taylor et al. [2004], Turner et al. [2003], Turner et al. [2002], Unal et al. [2004], West et al. [2011]). In this section, literature describing what is known about the various elements of cardiac rehabilitation, especially long-term eects, is discussed.
The education element of cardiac rehabilitation
A recent review of the education element of CR concluded that there is some evi-dence to suggest that education may improve health-related quality of life, and that it may reduce costs by reducing subsequent use of health care, but there was no strong evidence of an eect of education on all-cause mortality, cardiac morbidity or hospitalisation (Brown et al. [2011]).
Depression and anxiety in psychological rehabilitation
is not causal (Dickens et al. [2007]).
A LCA of the course of depression symptoms found that there is a class of pa-tients whose risk of a new cardiovascular risk is raised (Kaptein et al. [2006]). Scores on the Beck Depression Inventory for 475 patients (385 men [80%], 90 women, mean age 60.6 years) who had MI were assessed during hospitalisation and at 3, 6, and 12 months. The prevalence of depressive symptoms was 22.7% during hospitalization. The analysis identied 5 classes: no depressive symptoms (56.4%), mild depressive symptoms (25.7%), moderate and increasing depressive symptoms (9.3%), signicant but decreasing depressive symptoms (4.6%), and signicant and increasing depres-sive symptoms (4.0%). Participants in this last class had a statistically signicantly higher risk of a new cardiovascular event compared with those without depressive symptoms. Controlling for baseline cardiac status and sociodemographic data did not alter the association; tness was not measured and there was no long-term folow-up.
Depression predicted failure to complete cardiac rehabilitation (Casey et al. [2008], Turner [2007]).
Exercise in cardiac rehabilitation
Exercise-based cardiac rehabilitation has been found to reduce overall mortality, car-diovascular mortality and hospital admissions in the short and medium term. The vast majority of studies have less than two years follow-up, and only three had longer than ve years follow up. These three studies are described in this section.
The National Exercise and Heart Disease Project examined whether a supervised ex-ercise programme improved 19-year survival in 30- to 64-year-old male MI patients (Dorn et al. [1999]). This 3-year multi-centre randomised clinical trial was conducted in the United States from 1976 to 1979 and involved 651 men with neither hyper-tension nor signicant comorbidity and with a ability to exercise at an intensity level ≥ 3 metabolic equivalents (METs) and a supine resting diastolic blood
pres-sure<100 mm Hg. After completion of a 6-week, low level exercise program run-in