Ranking Human and Machine Summarization Systems
Peter Rankel
University of Maryland College Park, Maryland [email protected]
John M. Conroy
IDA/Center for Computing SciencesBowie, Maryland [email protected]
Eric V. Slud
University of Maryland College Park, Maryland [email protected]Dianne P. O’Leary
University of Maryland College Park, Maryland [email protected]Abstract
The Text Analysis Conference (TAC) ranks summarization systems by their average score over a collection of document sets. We in-vestigate the statistical appropriateness of this score and propose an alternative that better distinguishes between human and machine evaluation systems.
1 Introduction
For the past several years, the National Institute of Standards and Technology (NIST) has hosted the Text Analysis Conference (TAC) (previously called the Document Understanding Conference (DUC)) (Nat, 2010). A major theme of this conference is multi-document summarization: machine summa-rization of sets of related documents, sometimes query-focused and sometimes generic. The sum-marizers are judged by how well the summaries match human-generated summaries in either auto-matic metrics such as ROUGE (Lin and Hovy, 2003) or manual metrics such as responsiveness or pyra-mid evaluation (Nenkova et al., 2007). Typically the systems are ranked by their average score over all document sets.
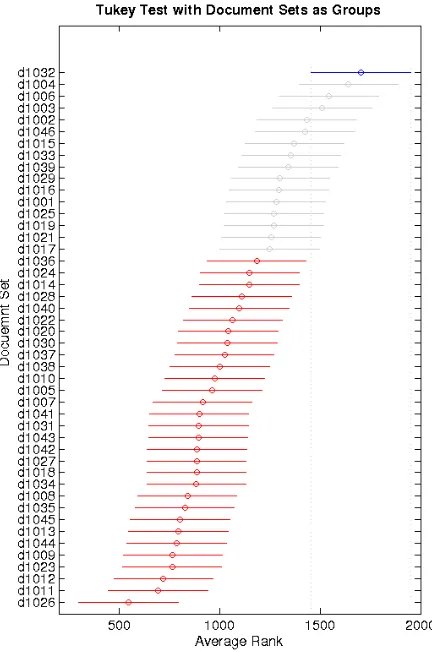
[image:1.612.317.533.266.592.2]Ranking by average score is quite appropriate un-der certain statistical hypotheses, for example, when each sample is drawn from a distribution which differs from the distribution of other samples only through a location shift (Randles and Wolfe, 1979). However, a non-parametric (rank-based) analysis of variance on the summarizers’ scores on each docu-ment set revealed an impossibly smallp-value (less
Figure 1: Confidence Intervals from a non-parametric Tukey’s honestly significant difference test for 46 TAC 2010 update document sets. The blue confidence interval (for document set d1032) does not overlap any of the 30 red intervals. Hence, the test concludes that 30 document sets have mean significantly different from the mean of d1032.
Figure 2: Overall Responsiveness scores.
Figure 3: Linguistic scores.
Figure 4: Pyramid scores.
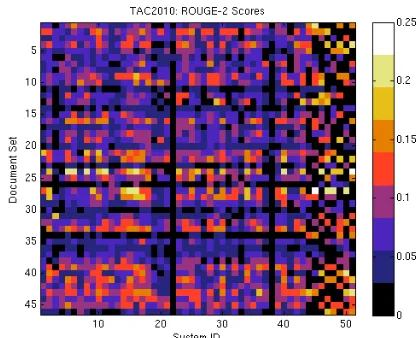
Figure 5: ROUGE-2 scores for the TAC 2010 update summary task, organized by document set (y-axis) and summarizer (x-axis). The 51 summarizers fall into two distinct groups: machine systems (first 43 columns) and humans (last 8 columns). Note that each human only summarized half of the document sets, thus creating 23 missing values in each of the last 8 columns. Black is used to indicate missing values in the last 8 columns and low scores in the first 43 columns.
than 10−12 using Matlab’s kruskalwallis 1), providing evidence that a summary’s score is not independent of the document set. This effect can be seen in Figure 1, showing the confidence bands, as computed by a Tukey honestly significant differ-ence test for each document set’s difficulty as mea-sured by the mean rank responsiveness score for TAC 2010. The test clearly shows that the summa-rizer performances on different document sets have different averages.
We further illustrate this in Figures 2 – 5, which show the scores of various summarizers on vari-ous document sets using standard human and au-tomatic evaluation methods (Dang and Owczarzak, 2008) of overall responsiveness, linguistic quality, pyramid scores, and ROUGE-2 using color to indi-cate the value of the score. Some rows are clearly darker, indicating overall lower scores for the
[image:2.612.95.299.485.667.2]maries of these documents, and the variances of the scores differ row-by-row. These plots show qualita-tively what the non-parametric analysis of variance demonstrates statistically. While the data presented was for the TAC 2010 update document sets, similar results hold for all the TAC 2008, 2009, and 2010 data. Hence, it may be advantageous to measure summarizer quality by accounting for heterogeneity of documents within each test set. A non-parametric paired test like the Wilcoxon signed-rank is one way to do this. Another way would be paired t-tests.
In the paper (Conroy and Dang, 2008) the authors noted that while there is a significant gap in perfor-mance between machine systems and human sum-marizers when measured by average manual met-rics, this gap is not present when measured by the averages of the best automatic metric (ROUGE). In particular, in the DUC 2005-2007 data some systems have ROUGE performance within the 95% confi-dence intervals of several human summarizers, but their pyramid, linguistic, and responsiveness scores do not achieve this level of performance. Thus, the inexpensive automatic metrics, as currently em-ployed, do not predict well how machine summaries compare to human summaries.
In this work we explore the use of document-paired testing for summarizer comparison. Our main approach is to consider each pair of two summa-rizers’ sets of scores (over all documents) as a bal-anced two-sample dataset, and to assess that pair’s mean difference in scores through a two-sample T or Wilcoxon test, paired or unpaired. Our goal has been to confirm that human summarizer scores are uniformly different and better on average than ma-chine summarizer scores, and to rate the quality of the statistical method (T or W, paired or unpaired) by the consistency with which the human versus machine scores show superior human performance. Our hope is that paired testing, using either the stan-dard paired two-sample t-test or the distribution-free Wilcoxon signed-rank test, can provide greater power in the statistical analysis of automatic metrics such as ROUGE.
2 Size and Power of Tests
Statistical tests are generally compared by choosing rejection thresholds to achieve a certain small
prob-ability of Type I error (usually asα = .05). Given multiple tests with the same Type I error, one prefers the test with the smallest probability of Type II error. Since power is defined to be one minus the Type II error probability, we prefer the test with the most power. Recall that a test-statistic S depending on available data-samples gives rise to a rejection re-gionby defining rejection of the null hypothesisH0
as the event{S≥c}for acutoff orrejection
thresh-oldcchosen so that
P(S≥c) ≤ α
for all probability laws compatible with the null hy-pothesis where the (nominal) significance level α is chosen in advance by the statistician, usually as α = .05. However, in many settings, the null hy-pothesis comprises many possible probability laws, as here where the null hypothesis is that the under-lying probability laws for the score-samples of two separate summarizers are equal, without specifying exactly what that probability distribution is. In this case, the significance level is an upper bound for the attainedsizeof the test, defined assupP∈H0 P(S≥ c), the largest rejection probability P(S ≥ c) achieved by any probability law compatible with the null hypothesis. The power of the test then depends on the specific probability law Qfrom the consid-ered alternatives inHA. For each suchQ, and given a threshold c, the power for the test atQis the re-jection probabilityQ(S ≥ c). These definitions re-flect the fact that the null and alternative hypothe-ses arecomposite, that is, each consists of multiple probability laws for the data. One of the advan-tages of considering adistribution-free two-sample test statistic such as the Wilcoxon is that the proba-bility distribution for the statisticSis then the same for all (continuous, or non-discrete) probability laws P ∈ H0, so that one cutoff cserves for all ofH0
with all rejection probabilities equal toα.2
Two test statistics, say S and S˜, are generally compared in terms of their powers at fixed alterna-tivesQin the alternative hypothesisHA, when their respective thresholdsc, c∗have been defined so that the sizes of the respective tests, supP∈H0 P(S ≥
c) and supP∈H0 P( ˜S ≥ c∗), are approximately equal. In this paper, the test statistics under consid-eration are – in one-sided testing — the (unpaired) two-sample t test with pooled sample variance (T), the paired two-sample t test (Tp), and the (paired) signed-rank Wilcoxon test (W); and for two-sided testing, S is defined by the absolute value of one of these statistics. The thresholds c for the tests can be defined either by theoretical distributions, by large-sample approximations, or by data-resampling (bootstrap) techniques, and (only) in the last case are these thresholds data-dependent, or random. We explain these notions with respect to the two-sample data-structure in which the scores from the first sum-marizer are denoted X1, . . . , Xn, where n is the number of documents with non-missing scores for both summarizers, and the scores from the second summarizer are Y1, . . . , Yn. Let Zk = Xk − Yk denote the document-wise differences between the summarizers’ scores, and Z¯ = n−1Pn
k=1Zk be their average. Then the paired statistics are defined as
Tp = pn(n−1) ¯Z/( n X
k=1
(Zk−Z¯)2)1/2
and
W = n X
k=1
sgn(Zk)R+k
where R+k is the rank of |Zk| among |Z1|, . . . , |Zn|. Note that under both null and
alter-native hypotheses, the variatesZk are assumed in-dependent identically distributed (iid), while under H0, the random variablesZkare symmetric about0. The t-statisticTpis ‘parametric’ in the sense that exact theoretical calculations of probabilitiesP(a < Tp < b)depend on the assumption of normality of the differencesZk, and when that holds, the two-sided cutoffc = c(Tp) is defined as the 1−α/2 quantile of thetn−1distribution withn−1degrees
of freedom. However, when n is moderately or very large, the cutoff is well approximated by the standard-normal1−α/2quantilezα/2, andTp
be-comes approximately nonparametrically valid with this cutoff, by the Central Limit Theorem. The Wilcoxon signed-rank statistic W has theoretical cutoffc = c(W)which depends only onn, when-ever the dataZkare continuously distributed; but for
largen, the cutoff is given simply as pn3/12·z
α/2.
When there are ties (as might be common in discrete data), the calculation of cutoffs and p-values for Wilcoxon becomes slightly more complicated and is no longer fully nonparametric except in a large-sample approximate sense.
The situation for the two-sample unpaired t-statistic T currently used in TAC evaluation is not so neat. Even when the two samplesX={Xk}n
k=1
and Y = {Yk}n
k=1are independent, exact
theoret-ical distribution of cutoffs is known only under the parametric assumption that the scores are normally distributed (and in the case of the pooled-sample-variance statistic, that Var(Xk) = Var(Yk).) How-ever, an essential element of the summarization data is the heterogeneity of documents. This means that while {Xk}n
k=1 can be viewed as iid scores when
documents are selected randomly – and not neces-sarily equiprobably – from the ensemble of all pos-sible documents, the Yk and Xk samples are
de-pendent. Still, the pairs{(Xk, Yk)}nk=1, and there-fore the differences{Zk}nk=1, areiidwhich is what
makes paired testing valid. However, there is no the-oretical distribution for T from which to calculate valid quantilescfor cutoffs, and therefore the use of the unpaired t-statistic cannot be recommended for TAC evaluation.
What can be done in a particular dataset, like the TAC summarization score datsets we consider, to ascertain the approximate validity of theoretically derived large-sample cutoffs for test statistics? In the age of plentiful and fast computers, quite a lot, through the powerful computational machinery of thebootstrap(Efron and Tibshirani, 1993).
The idea of bootstrap hypothesis testing (Efron and Tibshirani, 1993), (Bickel and Ren, 2001) is to randomly sample with replacement (the rows with non-missing data in) the dataset {(Xk, Yk)}nk=1 in
such a way as to generate representative data that plausiblywouldhave been seen if two-sample score data had been generated from two equally effec-tive summarizers with score distributional charac-teristics like the pooled scores from the two ob-served summarizers. We have done this in two dis-tinct ways, each creating 2000 datasets with n paired scores:
it-erations (in our case 2000), define a new dataset{(Xk0, Yk0)}n
k=1by independently
swap-ping Xk and Yk with probability 1/2. Hence, (Xk0, Yk0) = (Xk, Yk)with probability1/2and (Yk, Xk)with probability1/2.
HB Hybrid MC/Bootstrap. For each of 2000 iterations, create a re-sampled dataset {(X00
k, Yk00)}nk=1 in the following way. First,
sample n pairs (Xk, Yk) with replacement from the original dataset. Then, as above, randomly swap the components of each pair, each with1/2probability.
Both of these two methods can be seen to gener-ate two-sample data satisfyingH0, with each
score-sample’s distribution obtained as a mixture of the distributions actually generating theX andY sam-ples. The empirical qth quantiles for a statistic S = S(X,Y) such as |W| or |Tp| are estimated from the resampled data asFˆ−1
S (q), whereFˆS(t)is simply the fraction of times (out of2000) that the statistic S applied to the constructed dataset had a value less than or equal tot. The upshot is that the
1− α empirical quantile for S based on either of these simulation methods serves as a data-dependent cutoff c attaining approximate size α for all H0
-generated data. The MC and HB methods will be employed in Section 4 to check the theoretical p-values.
3 Relative Efficiency of
W
versus
T
p Statistical theory does have something to say about the comparative powers of paired W versus Tp statistics. These statistics have been studied (Ran-dles and Wolfe, 1979), in terms of their asymp-totic relative efficiencyfor location-shift alternatives based on symmetric densities (f(z−ϑ)is a location-shift of f(z)). For many pairs of parametric and rank-based statisticsS,S˜, includingW andTp, the following assertion has been proved for testingH0at significance levelα.
First assume the Zk are distributed according to some density f(z −ϑ), where f(z) is a symmet-ric function (f(−z) = f(z)). Next assumeϑ = 0 underH0. Whenngets large the powers at any
al-ternatives with very smallϑ = γ/√n, γ 6= 0, can be made asymptotically equal by using samples of
sizenwith statisticSand of sizeρ·nwith statistic ˜
S. Hereρ = ARE(S,S˜)is a constant not depend-ing onnorγ but definitely depending onf, called
asymptotic relative efficiencyofSwith respect toS˜. (The smaller ρ < 1is, the more statisticS˜is pre-ferred among the two.)
Using this definition, it is known (Randles and Wolfe 1979, Sec. 5.4 leading up to Table 5.4.7 on p. 167) that the Wilcoxon signed-rank statistic W provides greater robustness and often much greater efficiency than the paired T, with ARE which is0.95 withfa standard normal density, and which is never less than0.864for any symmmetric densityf. How-ever, in our context, continuous scores such as pyra-mid exhibit document-specific score differences be-tween summarizers which often have approximately normal-looking histograms, and although the alter-natives perhaps cannot be viewed as pure location shifts, it is unsurprising in view of the ARE theory cited above that the W and T paired tests have very similar performance. Nevertheless, as we found by statistical analysis of the TAC data, both are far su-perior to the unpaired T-statistic, with either theoret-ical or empirtheoret-ical bootstrapped p-values.
4 Testing Setup and Results
To evaluate our ideas, we used the TAC data from 2008-2010 and focused on three manual metrics (overall responsiveness, pyramid score, and lin-guistic quality score) and two automatic metrics (ROUGE-2 and ROUGE-SU4). We make the as-sumption, backed by both the scores given and com-ments made by NIST summary assessors3, that
au-tomatic summarization systems do not perform at the human level of performance. As such, if a statis-tic based on an automastatis-tic metric, such as ROUGE-2, were to show fewer systems performing at human level of performance than the statistic of averaging scores, such a statistic would be preferable because
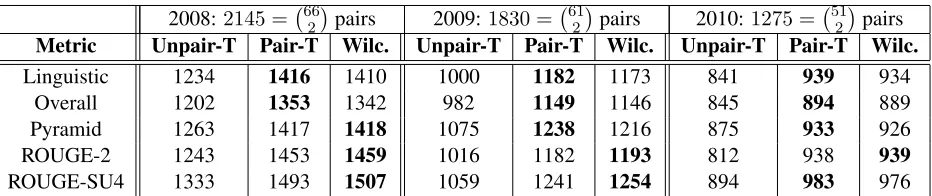
2008:2145 = 662pairs 2009:1830 = 612pairs 2010:1275 = 512pairs
Metric Unpair-T Pair-T Wilc. Unpair-T Pair-T Wilc. Unpair-T Pair-T Wilc.
Linguistic 1234 1416 1410 1000 1182 1173 841 939 934
Overall 1202 1353 1342 982 1149 1146 845 894 889
Pyramid 1263 1417 1418 1075 1238 1216 875 933 926
ROUGE-2 1243 1453 1459 1016 1182 1193 812 938 939
[image:6.612.81.547.65.163.2]ROUGE-SU4 1333 1493 1507 1059 1241 1254 894 983 976
Table 1: Number of significant differences found when testing for the difference of all pairs of summarization systems (including humans).
2008:464 = 58×8pairs 2009:424 = 53×8pairs 2010:344 = 43×8pairs
Metric Unpair-T Pair-T Wilc. Unpair-T Pair-T Wilc. Unpair-T Pair-T Wilc.
Linguistic 464 464 464 424 424 424 344 344 344
Overall 464 464 464 424 424 424 344 344 344
Pyramid 464 464 464 424 424 424 344 344 344
ROUGE-2 375 409 402 323 350 341 275 309 305
ROUGE-SU4 391 418 414 354 378 373 324 331 328
Table 2: Number of significant differences resulting from8×(N−8)tests for human-machine system means or signed-rank comparisons.
of its greater power in the machine vs. human sum-marization domain.
For each of these metrics, we first created a score matrix whose (i, j)-entry represents the score for summarizerjon document seti(these matrices gen-erated the colorplots in Figures 2 – 5). We then per-formed a Wilcoxon signed-rank test on certain pairs of columns of this matrix (any pair consisting of one machine system and one human summarizer). As a baseline, we did the same testing with a paired and an unpaired t-test. Each of these tests resulted in a p-value, and we counted how many were less than .05and called these the significant differences.
The results of these tests (shown in Table 2), were somewhat surprising. Although we expected the nonparametric signed-rank test to perform better than an unpaired t-test, we were surprised to see that a paired t-test performed even better. All three tests always reject the null hypotheses when human met-rics are used. This is what we’d like to happen with automatic metrics as well. As seen from the table, the paired t-test and Wilcoxon signed-rank test offer a good improvement over the unpaired t-test.
The results in Table 1 are less clear, but still posi-tive. In this case, we are comparing pairs of machine summarization systems. In contrast to the human vs.
machine case, we do not know the truth here. How-ever, since the number of significant differences in-creases with paired testing here as well, we believe this also reflects the greater discriminatory power of paired testing.
We now apply the Monte Carlo and Hybrid Monte Carlo to check the theoretical p-values reported in Tables 1 and 2. The empirical quantiles found by these methods generally confirm the theoreti-cal p-value test results reported there, especially in Table 2. In the overall tallies of all compar-isons (Table 1), it seems that the bootstrap results (comparing only W and the un-paired T) make W look still stronger for linguistic and overall re-sponsiveness versus the T; but for the pyramid and ROUGE scores, the bootstrap p-values bringT slightly closer toW although it still remains clearly inferior, achieving roughly 10% fewer rejections.
5 Conclusions and Future Work
performance of summarization systems. We pro-posed a non-parametric test, the Wilcoxon signed-rank test, as a robust more powerful alternative to the t-test. We estimated the statistical power of the t-test and the Wilcoxon signed-rank test by calcu-lating the number of machine systems whose per-formance was significantly different than that of hu-man summarizers. As huhu-man assessors score ma-chine systems as not achieving human performance in either content or responsiveness, automatic met-rics such as ROUGE should ideally indicate this dis-tinction. We found that the paired Wilcoxon test significantly increases the number of machine sys-tems that score significantly different than humans when the pairwise test is performed on ROUGE-2 and ROUGE-SU4 scores. Thus, we demonstrated that the Wilcoxon paired test shows more statistical power than the t-test for comparing summarization systems.
Consequently, the use of paired testing should not only be used in formal evaluations such as TAC, but also should be employed by summarization devel-opers to more accurately assess whether changes to an automatic system give rise to improved perfor-mance.
Further study needs to analyze more summariza-tion metrics such as those proposed at the recent NIST evaluation of automatic metrics, Automati-cally Evaluating Summaries of Peers (AESOP) (Nat, 2010). As metrics become more sophisticated and aim to more accurately predict human judgements such as overall responsiveness and linguistic qual-ity, paired testing seems likely to be a more power-ful statistical procedure than the unpaired t-test for head-to-head summarizer comparisons.
Throughout our research in this paper, we treated each separate kind of scores on a document set as data for one summarizer to be compared with the same kind of scores for other summarizers. How-ever, it might be more fruitful to treatallthe scores as multivariate data and compare the summarizers that way. Multivariate statistical techniques such as Principal Component Analysis may play a construc-tive role in suggesting highly discriminating new composite scores, perhaps leading to statistics with even more power to measure a summary’s quality.
ROUGE was inspired by the success of the BLEU (BiLingual Evaluation Understudy), an
n-gram based evaluation for machine translation (Pa-pineni et al., 2002). It is likely that paired testing may also be appropriate for BLEU as well and will give additional discriminating power between ma-chine translations and human translations.
References
Peter J. Bickel and Jian-Jian Ren. 2001. The Bootstrap in Hypothesis Testing. InState of the Art in Statistics and Probability Theory, Festschrift for Willem R. van Zwet, volume 36 ofLecture Notes– Monograph Series, pages 91–112. Institute of Mathematical Statistics. John M. Conroy and Hoa Trang Dang. 2008. Mind the
Gap: Dangers of Divorcing Evaluations of Summary Content from Linguistic Quality. In Proceedings of the 22nd International Conference on Computational Linguistics - Volume 1, COLING ’08, pages 145–152, Stroudsburg, PA, USA. Association for Computational Linguistics.
Hoa T. Dang and Karolina Owczarzak. 2008. Overview of the tac 2008 update summarization task. In Pro-ceedings of the 1st Text Analysis Conference (TAC), Gaithersburg, Maryland, USA.
B. Efron and R. J. Tibshirani. 1993. An Introduction to the Bootstrap. Chapman & Hall, New York.
Chin-Yew Lin and Eduard Hovy. 2003. Automatic Eval-uation of Summaries Using N-gram Co-Occurrences Statistics. In Proceedings of the Conference of the North American Chapter of the Association for Com-putational Linguistics, Edmonton, Alberta.
National Institute of Standards and Technology. 2010. Text Analysis Conference, http://www.nist.gov/tac. Ani Nenkova, Rebecca Passonneau, and Kathleen
McK-eown. 2007. The Pyramid Method: Incorporating Human Content Selection Variation in Summarization Evaluation. ACM Transactions on Speech and Lan-guage Processing, 4(2).
Kishore Papineni, Salim Roukos, Todd Ward, and Wei-Jing Zhu. 2002. BLEU: a Method for Automatic Evaluation of Machine Translation. InProceedings of the 40th Annual Meeting on Association for Computa-tional Linguistics, ACL ’02, pages 311–318, Strouds-burg, PA, USA. Association for Computational Lin-guistics.
R.H. Randles and D.A. Wolfe. 1979. Introduction to the Theory of Nonparametric Statistics. Wiley series in probability and mathematical statistics. Probability and mathematical statistics. Wiley.