Abstract – This paper presents how spatial data mining is achieved using spatial clustering. The study utilized partitive clustering technique such as K-Means and Self-Organizing Map Algorithms in Artificial Neural Network to map landslide hazard areas using the datasets of eight causative landslide indicators such as slope gradient, vertical displacement, drainage density, the rate of weathering, lithology, ground stability, soil type, and vegetation. Each technique has limitations and concentrates only on particular kind of computation. Based on the result, vertical displacement and slope gradient are the two major aspects that trigger the landslide and dominate in all factors. With these techniques, landslide hazard zone are identified. Hence, the model can map the areas under study and can be a tool to visualize the identified causative factors of landslides.
Keywords: artificial neural network, landslide hazard zonation, k-means, partitive clustering, self-organizing map
I. INTRODUCTION
ANDSLIDE is one of the major natural disasters in the world which causes economic damage and loss of life. The Philippines is known to be a landslide prone nation, making the country the fourth most exposed to landslide after Indonesia, India, and China [1]. At the same time, the country is also among the richest in mineral resources, a deadly mix [1]. The country needs continuous monitoring of high-risk areas and a more comprehensive study on the causes and effects of the landslide.
Since mining is booming in the Philippines, small scale mining (SSM) activities exist in some areas of Surigao del Norte province. SSM practices involve deep tunneling such as sinking and drifting, trenching, and hydraulic mining in the mountains. These happenings are documented. Due to the inherent digging of soil and sluicing involved in SSM, water siltation, erosion, and land degradation are issues of environmental destruction [2]. There also have been unreported incidents of fatalities due to the landslide caused by unregulated SSM activities [3]. Miners and their families who live at the peak of mountains in mining areas are directly affected by this. To avoid such phenomenon to happen, a landslide
Manuscript received January 8, 2016; revised January 29, 2016. M.A. dela Cerna is an IAENG member and a faculty of the Information Technology Division, Surigao State College of Technology, Surigao City 8400, Philippines (email: [email protected]).
E.A. Maravillas is with the College of Computer Studies in Cebu Institute of Technology-University, Cebu City 6000, Philippines (e-mail: [email protected]).
hazard investigation is significant. Natural disasters can be avoided or prevented through the use of information and technology available. A review of landslide hazard zonation emphasizes the importance of assessment (qualitative) and evaluation (quantitative) of hazards from landslides [5][6].
Researchers who studied about landslide have applied a model for predicting landslide hazard. Some of them use probabilistic models. Various models used are the logistic regression [15], neuro-fuzzy [8], fuzzy logic [9], geographic information system [9][10], self-organizing map [12] and artificial neural network models [15]. Artificial neural networks (ANN) have broad applicability to real-world business problems. In fact, they have been successfully applied in many industries [14]. Since neural networks are best for identifying patterns or trends in data, they are well suited for prediction or forecasting including sales forecasting, industrial process control, customer research, data validation, risk management [15][16] and target marketing [17]. The Kohonen self-organizing maps (SOM) as part of the unsupervised learning algorithm of ANN has been applied as a clustering algorithm of high dimensional data, as well as an alternative tool to classical multivariate statistical techniques [18]. SOM algorithm is also employed as a tool for eco-morphological investigation concerning the life history of fish [19], as model for post-fire hydrologic and geomorphic hazards [20], as a tool for forecasting the reservoir inflow during typhoon periods [16], and for visualizing the topical structure of the medical sciences [21]. On the other hand, the K-means clustering algorithm is presented for image segmentation based on an adaptive approach [22], landslide detection [7] and spatial prediction for landslide hazard [13]. As evidenced by the above lists of references, modeling utilizing SOM and K-Means have recently been applied to a broad range of geo-environmental fields.
With the advent of technology, some studies have invented software to map landslide risk associated with improper environmental practices. However, with SSM activities, they are less likely monitored, and there is a lack of existing profiling and mapping of the occurrence. The
continued investigation into the occurrence and
implications of geohazards, about the mining explorations, led to specific mitigation studies and establishing relevant prevention mechanisms.
Thus, in this study, it aims to identify landslide areas and apply clustering techniques to group the areas susceptible to landslide and assess the geo-environmental factors in the preparation of landslide hazard zonation. The latter is a significant step towards landslide hazard and risk management. The partitive clustering-based technique is used to achieve landslide hazard zonation in the small scale mining areas of Surigao del Norte. It clusters using two kinds of algorithms the K-Means and the Self-organizing
An Application of Partitive Clustering
Algorithm for Landslide Hazard Zonation
Monalee A. dela Cerna, Member, IAENG and Elmer A. Maravillas
Map for visualization of landslide hazard. The method will be useful in aiding the government in their decision making for disaster risk management and control.
II.METHODS
The study employed the partitive clustering based techniques in artificial neural networks using K-Means and Self-organizing Map algorithms. The researchers developed the system in the .Net Framework using Microsoft Visual Studio 2010 as the integrated development environment and running on Windows 8 Operating System. Visual C# used as the programming language for implementation. The datasets used to test the algorithm are the primary data from the comprehensive survey conducted. Data are imported from Microsoft Excel or Notepad and interpreted by the K-Means and SOM for clustering.
A. Location of the Study
[image:2.595.313.537.68.259.2]Surigao del Norte is a province of the Philippines located in the Caraga region of Mindanao between 125º15’ to 126º15’ east longitude and 9º18’ to 10º30’ north latitude [23]. It is bounded on the north and east by the Pacific Ocean, on the south by the provinces of Agusan del Norte and Surigao del Sur, and on the west by the Surigao Strait. The province has abundant mineral reserves including gold, iron, manganese, silica, cobalt, copper, chromite, limestone, silver and among the world's largest nickel deposits [23]. The province falls under the tropical climate type and prone to brief afternoon downpours and thunderstorms [23]. Most of the active mining areas are located in moderate to steep rugged terrain underlain by volcanic rocks and terrace gravel deposits and structurally controlled along Philippine fault line. Figures 1 and 2 show the map of Surigao del Norte and the panoramic views of some identified landslide prone mining areas respectively.
Fig. 1. Map of Surigao del Norte, Philippines
Fig 2. Panoramic view of some mining areas (a) GoldDustSlide1, Magsaysay, Placer; (b) BrazilSlide2, Sitio Brazil, Mat-i, Surigao City, (c) CansayongSlide2, Brgy. Cansayong, Malimono; (d) SanPedroSlide2, Brgy. San Pedro, Alegria
B. Data Preparation
The primary data are gathered from the comprehensive survey in the mining areas. The eight causative factors are considered in this study. The following indicators that may cause landslide hazard are: slope gradient (SG), which classes are flat and undulating (FU), moderately sloping (MS), hilly and moderately steep (HS), and steep (SP).
For vertical displacement (VD), the classifications are shallow (SH), moderate (MV), deep (DP), and very deep (VD). On the other hand, for drainage density (DD), it has low (LD) moderate (MD), high (HD), and very high (VD) classes. While, for the rate of weathering (RW), the classes are from slightly weathered (SW), moderately weathered (MW), highly weathered (HW), to completely weathered (CW).
The lithology (LI) in the areas are andesite porphyry, diorite, agglomerate, hydrothermal breccia, sandstone, siltstone, alluvium, terrace gravel and ultramafic which tend to be weakly fractured/weathered (WF), moderately fractured/weathered (MF), highly weathered/fractured and delighting structure (HF), and highly fractured and highly weathered with tension cracks/or landslide scarp (VF).
The ground stability (GS) classes are Stable with no identified landslide scars, it is either old, recent or active (ST), Soil creep and other indications for possible landslide occurrence are present (SC), Inactive landslides evident; tension cracks present (IL) and Active landslides are evident with tension cracks, bulges, terracettes, seepage are present (AL).
For soil type (ST), the classes are Silts and Clays (50% or more of material is smaller than No. 200 sieve size) with liquid limit of 50% or greater (SG), Silts and Clays (50% or more of material are lower than No. 200 sieve size) with liquid limit of less than 50% (SL), Sands (SD), and Gravels (GV) based on the Unified Soil Classification System [4]. In vegetation (VE), the classes are Primary Growth (PG), Secondary Growth (SG), and Tertiary Growth (TG).
The rate of the slope gradient, vertical displacement, and drainage density uses the actual quantitative rate while the
a b
[image:2.595.49.265.547.713.2]rate of weathering, lithology, ground stability and soil type since it is in qualitative type indicators, their classes use an ordinal number (1,3,6,9) likewise in vegetation (1,5,9) which has only three classes. Table I presents the rate of landslide hazard parameters.
TABLE I
RATE OF LANDSLIDE HAZARD PARAMETERS
Indicators Classes Rate Indicators Classes Rate
SG
FU 0° - < 8°
LI
WF 1
MS 8° - < 18° MF 3
HS 18° -< 26° HF 6
SP 26° -<= 90° VF 9
VD
SH <2 m
GS
ST 1
MV 2-9 m SC 3
DP 10-25 m IL 6
VD >25 m AL 9
DD
LD 0-1 drainage
ST
SG 1
MD 2-4 drainages SL 3
HD 5-10 drainages SD 6
VD >10 drainages VG 9
RW
SW 1
VE
PG 1
MW 3 SG 5
HW 6
TG 9
CW 9
C. Application of K-Means Clustering Algorithm for Landslide Hazard Zonation
This study uses the multivariate statistical analysis of the interaction of the factors. In this, landslide hazard zonation compares each data layer of a causative factor to the existing landslide distribution. Weights of the landslide causative factors are assigned based on landslide density. K-Means clustering is a significant statistical method used in landslide hazard zoning.
The K-means algorithm commences by placing K points at random locations in space. Then perform the following steps iteratively: (1) assign it to a cluster with the nearest centroid, and (2) move each centroid to the mean of the instances assigned to it. The algorithm continues until no instances change cluster membership.
This algorithm attempts to minimize the intra-cluster variance. The algorithm converges to a local minimum; therefore different initializations will result in different clustering. K-means does not guarantee that similar instances will end up in the same cluster. It is a method of vector quantization, initially pattern from signal processing that is famous for cluster analysis in data mining. K-Means aims to partition n observations into k clusters in which each observation fit into the cluster with the nearest mean; that serves as a prototype of the group. Below are the steps of using the K-Means algorithm.
1. Initialize the K weight vectors, e.g. to randomly chosen examples. Each weight vector represents a cluster. 2. Assign each input example x to the cluster c(x) with the
nearest corresponding weight vector refer to equation 1. (1)
3. Update the weights: See equation 2.
(2)
4. Increment n by 1 and go until no noticeable changes of weight vectors occur.
D. Application of Self-Organizing Map Algorithm for Landslide Hazard Zonation
Multivariate statistical analysis for landslide hazard zonation considers relative contribution of each thematic data layer to the total landslide susceptibility and use for the classification or clustering of hazard for the given area. Self-Organizing Map is the method used for landslide hazard zoning.
Prof. Teuvo Kohonen introduced the self-organizing map in 1982 also known as Kohonen feature map. SOM is under unsupervised neural network for clustering tool of high-dimensional and complex data. The self-organizing map provides a high-dimensional input space of clustering data in most cases a two-dimensional, output space. This output space is in a rectangular grid of units, a representation that is easily understandable for its users due to its analogy 2-D maps. Each of the units on the map is assigned a weight vector, which is of the same dimensionality as the vectors in the input space [11].
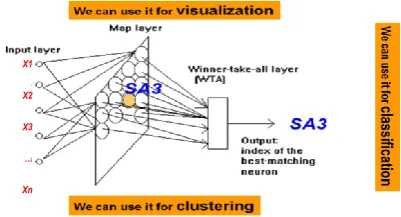
The universal application of a self-organizing map (SOM) of Kohonen is for mapping n-dimensional input vectors to two-dimensional neurons or maps. This map describes the variations in the information of the input data, and the topology of the original data is preserved on the SOM through the connection of the input vectors which shares common features of the similar or neighboring neurons. This is motivated by the feature of the human brain wherein the neurons are organized in one or multi-dimensional lattice. The neurons compete among themselves to be activated according to a competitive learning scheme. The weight vector associated with winning neuron is only updated in the scheme winner-takes-all.
Typically, the SOM algorithm performs some successive iterations until the reference vectors associated with the neuron of a two-dimensional map represent, as much as possible, the input patternsthat are closer to those neurons. The aim is to learn a feature map from the spatially continuous input space, in which the input vectors live, to the low dimensional spatially discrete output space, which is formed by arranging the computational neurons into a grid. Figure 3 illustrates the concept of SOM.
Fig. 3. Block diagram of Self-Organizing Map
The stages of the SOM algorithm that achieves this can be summarized as follows:
1. Initialization. Choose random values for the initial weight vectors wj.
) n ( w x min arg
c(x) j j
j cluster to assigned examples
of number the
with
/ )
1 (
j c(x) such that x
j
j j
n
n x n
w
X1
X2
X3
…
[image:3.595.313.514.597.705.2]2. Sampling. Draw a sample training input vector x from the input space.
3. Matching. Find the winning neuron that has weight vector closest to the input vector. To determine the best matching unit, one method is to iterate through all the nodes and calculate the Euclidean distance between each node's weight vector and the current input vector. The node with a weight vector closest to the input vector is tagged as the best matching unit. See Equation 3, the Euclidean distance is given as:
deuc(x, w) = 𝑛𝑖=1 (3)
where x is the current input vector and w is the node's weight vector.
4. Updating. Apply the weight update equation. See equation 4.
(4)
where hi(x) is a Gaussian neighborhood and is the learning rate ƞ.
5. Continuation. Keep returning to step 2 until the feature map stops changing.
E. System Architecture
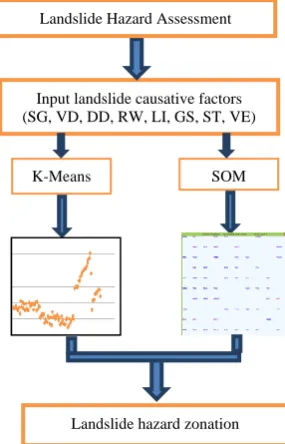
[image:4.595.315.541.97.432.2]Figure 4 illustrates the architectural design which has two functions; landslide hazard assessment and landslide hazard zonation. The datasets for the eight causative factors are used to input into the system, and it will be simulated using the two types of a partitive clustering algorithm, the K-Means and Self-organizing Map. A sort of testing for the system was done to provide a robust and accurate result after coming up a decision what type of landslide hazard rate to assert for each mining areas.
Fig. 4. System architecture
III.SIMULATION AND RESULTS
This part presented the running output of the two clustering algorithms. Table II shows the number of
[image:4.595.94.237.483.705.2]identified landslide areas wherein areas fall on their corresponding classes.
TABLE II
IDENTIFIED SMALL SCALE AREAS AND ITS CLASSES Indicators Classes Number of identified landslide areas
SG
FU 0
MS 3
HS 6
SP 90
VD
SH 1
MV 63
DP 26
VD 9
DD
LD 69
MD 28
HD 0
VD 2
RW
SW 0
17 82 0 MW
HW CW
LI
WF 0
0 0 99 MF
HF VF
GS
ST 0
0 0 99 SC
IL AL
ST
SG 42
31 16 10 SL
SD VG
VE
PG 0
19 80 SG
TG
Based on the result, as shown in Table II, there are 90 identified areas in a steep slope, while 63 areas are in moderate vertical displacement. In drainage density, 69 areas are low in drainages while 82 identified areas are highly weathered.
Lithology which plays a role as slip surface wherein rock composed of sandstone is more exposed to erosion so as to more susceptible to landslide. All of the mining areas are highly weathered and highly fractured. Most of these are sandstone; terrace gravel; highly fractured and highly weathered siltstone; andesite porphyry; ultramafic; agglomerate; diorite; hydrothermal breccia with tension cracks/or landslide scarp. Likewise, in ground stability, active landslides are evident in all areas with tension cracks, bulges, terracettes, seepage are present. As such, it is also an indirect indicator of slope stability, but this will also contribute to slope instability with a particular condition to landslide since mining exists in the areas.
In soil types, there are also 42 identified areas under the class of silts and clays (50% or more of material is smaller than No. 200 sieve size) with a liquid limit of 50% or greater. These are elastic silt and elastic silt with sand, likewise in vegetation 80 identified areas are in tertiary growth.
The zonation for landslide hazards is clustered into four (4) to represent for low, moderate, high, and very high regions. Figure 5 shows a demonstration of C# program that uses the k-means algorithm to cluster the data. The output from K-Means clustering program is provided in
x(n)- ( )
) ( ) ( ) ( ) 1
(n w n n h( ) d( ) w n
wj j ix ix j j
Input landslide causative factors (SG, VD, DD, RW, LI, GS, ST, VE)
SOM K-Means
Landslide hazard zonation Landslide Hazard Assessment
(xi-wi)
Table III, which presents the numerical output data to interpret the similarity and dissimilarity within clusters. The eight variables are tested which reveal four major clusters. It can be shown in cluster 1 that the higher value of soil type will contribute to the higher susceptibility rate of vegetation and rate of weathering. This further concludes that the increase rate of soil type enhances the effect of weathering and vegetation. However, considering the slope gradient and drainage density, cluster 1 indicates that the soil type and the said variables inversely vary. It follows that those with a higher value of soil type has the lesser value of slope gradient which also have a tendency of low drainage density.
[image:5.595.317.527.241.405.2]While in cluster 3 vertical displacement has the highest value whereas the rate of weathering, soil type, and vegetation have the lowest value. This implies that vertical displacement indirectly varies from the rate of weathering, soil type, and vegetation. In effect, the area with high vertical displacement is the one with a lesser rate of weathering, soil type, and vegetation.
Fig. 5 shows a demo of C# program that uses the k-means algorithm to cluster the data
TABLE III CLUSTER CENTROIDS
Variable Cluster1 Cluster2 Cluster 3 Cluster4 Grand centroid
SG 22.4286 64.3095 62.0833 38.9677 50.1818
VD 5.6071 8.9524 34.1667 8.6129 11.4293
DD 0.9286 1.6667 1.7500 2.0645 1.6970
RW 5.7857 5.3571 5.0000 5.7097 5.4848 LI 9.0000 9.0000 9.0000 9.0000 9.0000 GS 9.0000 9.0000 9.0000 9.0000 9.0000 ST 4.6429 2.5238 2.3333 3.6774 3.1616 VE 9.0000 7.8571 7.0000 8.8710 8.2323
As seen in Table III, the vertical displacement obtained the highest mean of 34.1667 which is in Cluster 3 and centroid of 11.4293. In the same way, among all the factors, vertical displacement is the most diverse from its centroid, and so, it is the primary factor that affects the landslide hazard susceptibility. Moreover, the slope gradient obtained the highest mean of 64.3095 which is in Cluster 2 and centroid of 50.1818; this means that the slope gradient is the second most diverse from its centroid, and so, it is the secondary factor that affects the landslide hazard susceptibility.
Another approach that aids in the interpretation of the maps provided that particular external information like class labels is to plot the labels on the organized map. The
distribution of the samples of each class, plotted on the map may also help in the interpretation process.
Figure 6 is a representation for visualizing the SOM output to determine the clustering of the data. There are 16 barangays from the different six towns of the province engage in SSM activities. Ninety-nine landslide areas observed during the comprehensive survey. Cansayong Slide 1 has been pushed to the top right of the highest mean in all of the eight causative factors, and this probably results to most elevated affected landslide area. While Layab Slide 6 has a decrease in mean value, has been pushed to the bottom left. Directly below on the bottom right-hand corner, Tugonan Slide 1 obtains the highest score in drainage density. The remaining neurons live between these extremes, with a landslide hazard zone occupying the center ground.
Fig. 6. Simulation of SOM algorithm to cluster the data
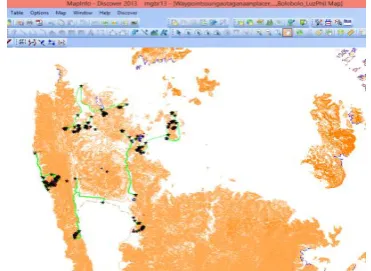
[image:5.595.46.280.301.465.2]In this paper, the top 12 landslide areas are presented. The following are Cansayong Slide 1 in Brgy. Cansayong, Malimono; Gold Dust Slide 1 in Brgy. Magsaysay, Placer; Ellaperal Slide 5 in Brgy. Ellaperal, Placer;Brazil Slide 2 in Brgy. Mabini, Surigao City; Tapian-Slide 7, Slide 10, Slide 3, Slide 6, Slide 5, Slide 1 in Brgy. Tapian, Mainit; San Pedro Slide 2 in Brgy. San Pedro, Alegria; and Alipao Slide 1 in Brgy. Alipao, Alegria. Figure 7 point out the geographic location of the landslides identified areas in SSM.
Fig. 7. Geographic location of the identified landslide areas in small scale mining
[image:5.595.330.516.552.687.2]means that the algorithm does not always find the minimum value of the total sum of squares within a cluster. While in SOM, it uses a more local rule, the neighborhood functions wherein locations of the neurons are tuned become ordered, and a meaningful coordinate system for the input features created on the lattice. Thus, SOM forms the required topographic map of the input patterns. Neurons are visualized as changing in positions in the weight space as learning takes place. However, it caused overlapping if real data is used to test since there can have the same rate. Moreover, a test is also conducted in which the output from the K-means is used to feed into the SOM environment. Findings will not accord since this two algorithm concentrates on a particular kind of computation.
Findings assert that the mining areas are in high to very highly hazard to a landslide. These identified causative factors of the landslide are naturally occurring. One or two factors may be present in an area, but unregulated SSM activities can make the mining sites susceptible to landslides as the consequence of miner’s activities. In fact, unregulated SSM activities can cause the presence of the eight causative factors of landslides.
IV.CONCLUSION
This paper concludes that the model can map the areas and can be used as tools to visualize the identified causative factors of the landslide. The performance of the two partitive clustering algorithms differs since K-Means is sensitive to initialization. It depends on initializing patterns according to statistical information calculated from data. SOM provides a more robust learning, yet visual inspection has to be done carefully because it needs a prior checking of the topology preservation property of the trained map before starting the visual inspection. The performance of clustering algorithms depends on the topology of data. The advanced multivariate techniques using partitive clustering method are proving to be useful in spatial prediction of landslides with a great extent of precision. Performance analysis of the K-Means depends a lot on a priori knowledge (K) and is very stable while Self-Organizing Map has stability and convergence which assured in the principle of self-ordering but slow and many iterations needed for convergence likewise computationally intensive.
REFERENCES
[1] IRINnews.org, "PHILIPPINES: Artisanal mining compounds landslide risk,” Date of Access: August 9, 2013, Retrieved from http://www.irinnews.org/report/94629/philippines-artisanal-mining-compounds- landslide-risk, 2012.
[2] T. Hentschel, F. Hruschka, M. Priester, “Global Report on Artisanal and Small-Scale Mining,” 2002, http//pubs.iied.org/pdfs/G00723. [3] D. Petley, “Mining-related landslides in the Philippines,”
http://blogs.agu.org/landslideblog/2011/04/28/mining-related-landslides- in-the-philippines/2011.
[4] Unified Soil Classification System, Date accessed: February 8, 2015, Retrieved from http://gozips. uakron .edu/~mcbelch/ documents/ UnifiedSoilClassification.pdf.
[5] F. Guzzetti, “Landslide Hazard and Risk Assessment. Concepts, Methods and Tools for the Detection and Mapping of Landslides, for Landslide Susceptibility Zonation and Hazard Assessment, and for Landslide Risk Evaluation,” Earth Sciences, 2014, Retrieved from
https://itunes.apple.com/au/book/landslide-hazard-risk-assessment/id944699313?mt=13.
[6] S.D. Pardeshi1, S.E. Autade, and S.S. Pardeshi, “Landslide hazard assessment: recent trends and techniques,” Pardeshi et al.
SpringerPlus. 2:523 doi:10.1186/2193-1801-2-523. http://www.springerplus.com/content/ 2/1/523, 2013.
[7] P.V. Gorservski, P.E. Gessler, P. Jankowski, “Integrating a fuzzy k-means classification and a Bayesian approach for spatial prediction of landslide hazard,” J Geograph Syst, (2003), 5:223-251DOI: 10.1007/s10109-003-0113-0, Retrieved from http://link.springer.com/article/
[8] F. Sdao, D.S. Lioi, S. Pascale, S. Caniani and I.M. Mancini, “Landslide susceptibility assessment by using a neuro-fuzzy model: a case study in the Rupestrian heritage rich area of Matera,” Nat. Hazards Earth Syst. Sci., 13, 395–407, 2013.
[9] P. Kayastha, “Application of fuzzy logic approach for landslide susceptibility mapping in Garuwa sub-basin, East Nepal,” Front. Earth Sci. 6(4): 420–432, 2012.
[10] P. Kayastha, S.M. Bijukchhen, M.R. Dhital, and F. De Smedt, “GIS Based Landslide Susceptibility Mapping using a Fuzzy Logic Approach: A Case Study from Ghurmi-Dhad Khola Area, Eastern Nepal,” Journal Geological Society of India, Vol. 82, September 2013, pp.249-261.
[11] R.A. Mayer, T.S. Aziz, A.G. Rauber, “Visualizing Class Distribution on Self-Organizing Maps,” 2011.
[12] M.J. Friedel, “Modeling hydrologic and geomorphic hazards across post-fire landscapes using a self-organizing map approach,” Environmental Modeling & Software, Volume 26, Issue 12, December 2011, pp. 1660-1674.
[13] T.R. Martha, N. Kerle, C.J. van Westen, V. Jetten, K.V. Kumar, “Segment Optimization and Data-driven Thresholding for Knowledge-based Landslide Detection by Object-based Image Analysis,” Geoscience and Remote Sensing, IEEE Transactions on (Volume:49, Issue: 12 ), 2011, DOI: 10.1109/TGRS.2011.2151866 [14] A. Vella and C. Vella, “Neural Networks,” University of London
International Programmes, 2009, www.londoninternational.ac.uk [15] D.T. Bui, T.A. Tuan, H. Klempe, B. Pradhan, and I. Revhaug,
“Spatial Prediction Models for Shallow Landslide Hazards: A Comparative Assessment of the Efficacy of Support Vector Machines, Artificial Neural Networks, Kernel Logistic Regression, and Logistic Model Tree,” 2015, http://link.springer.com/article/10.1007/s10346-015-0557-6. [16] G.F. Lin, T.C. Wang, and L.H. Chen, “A Forecasting Approach
Combining Self-Organizing Map with Support Vector Regression for Reservoir Inflow during Typhoon Periods,” Advances in Meteorology, Volume 2016, 2016, Article ID 7575126, 12 pages. http://www.hindawi.com/journals/amete/ 2016/7575126/abs/. [17] I. Stamova, H. Akca and G. Stamov, “Qualitative Analysis of
Dynamic Activity Patterns in Neural Networks,” Journal of Applied
Mathematics, Volume Article ID 208517, 2 pages, 2010,
http://dx.doi.org/10.1155/2011/208517. http://www.hindawi.com/ journals/jam/2011/208517/
[18] S.A. Sayad, “Self-Organizing Map (SOM),” Bahen Centre Information Technology, Toronto, Ontario, Canada, 2010.
[19] T. Russo, M. Scardi, and S. Cataudella, “Applications of Self-Organizing Maps for Ecomorphological Investigations through Early Ontogeny of Fish,” PLoS ONE 9(1):e86646.doi:10.1371/ journal.pone. 0086646, 2014.
[20] M.J. Friedel, “Modeling Hydrologic and Geomorphic Hazards Across Post-Fire Landscapes Using a Self-organizing Map Approach,” doi:10.1016/j.envsoft.2011.07.001, 2011, http://www. sciencedirect.com/science/article/pii/S1364815211001629.
[21] A. Skupin, J.R. Biberstine, and K. Borner, “Visualizing the Topical Structure of the Medical Sciences: A Self-Organizing Map Approach,” DOI: 10.1371/journal.pone.0058779, 2013.
[22] A.S.B. Samma and R.A. Salam, “Adaptation of K-Means Algorithm for Image Segmentation,” World Academy of Science, Engineering and Technology 50, 2009. http://citeseerx.ist.psu.edu/ viewdoc/download?doi=10.1.1.193.2635&rep=rep1&type=pdf. [23] Monalee A. dela Cerna, and Elmer A. Maravillas, "Landslide Hazard