ìTùpB in figur
'Young people, you are Europe's future and hope. Europe is your hope and future.'
Jacques Delors, President of the Commission of the European Communities
Preface
It is my pleasure to introduce a brochure that is somewhat different from the traditional publications of the Statistical Office of the European Communities (Eurostat).
'Europe in figures' provides the reader with some 60 pages of data on how the European Community functions and its socioeco nomic situation. Europe's position is thrown into relief, in a broader context, by comparison with the corresponding data for the United States and Japan.
The target here is mainly the younger reader, and with this in mind Eurostat has endeavoured to achieve a method of presenta tion that minimizes the technical aspect but is based, at all times, on the application of rigorous statistical principles. Hence the systematic definition of all the concepts deemed to warrant a mention in the text.
With achievement of the internal market on the 1992 horizon, I would be gratified if this collection of basic data were to enhance its readers ' understanding of Europe and all that Europe stands to gain.
/■j&^áÁAJLÍljí
S. RONCHETTI
EUROPE IN
FIGURES
Table of contents
THE EUROPEAN COMMUNITYι of Europe The Single Europea The institut
THE ENVIRONMENT AND POPULATION
Eurostat would like to thank the following for their contribu tions towards the photographic illustration of this publication: the Photography Club of the European Communities' Cultural Association, the European Parliament, OCFE, Eurosense Belfo top NV and Messrs B. Langevin, J. Lewerenz, W. Suys and H. Wilhelm.
Graphic design and layout: WIBOWerbung/D. Konrad
Luxembourg: Office for Official Publications of the European Communities, 1988
ISBN 92-825-7306-0
Catalogue No: CA4786907ENC
© ECSCEECEAEC, BrusselsLuxembourg, 1987
With the exception of the photographic illustrations, repro duction is permitted, provided no financial gain is involved and the source is acknowledged.
Printed in the FR of Germany
s
10 11 12 13 14
Population structure Demographic trendi Education
The labour market Employment
Unemployment trends Unemployment structure
ECONOMICS AND FINANCE
PRODUCTION
18 Agriculture St met ut 19 Crop production 20 Animal production
21 Agriculture Accounts and price;
22 Energy
23 Industry: its importance 24 Industry: its bases 25 Industry: its products
Services
EXTERNAL RELATIONS
K S S * "
1 0" " ^ ^ 43011
.2920Lu»ÄS"uuÄ
ymon..
L2The European Community is 30 years old. On 25 March 1957, in Rome, the representatives of six countries (Belgium, the Federal Republic of Germany, France, Ita-ly, Luxembourg and the Nether-lands) signed two Treaties estab-lishing the European Economic Community. The adventure was about to begin.
The dream of a united Europe is an old one, but it took the de-struction of the Second World War to prompt the Heads of State or Government to take steps to-wards achieving that aim. Plans foundered on the rocks of 'supra-nationality' and the various countries baulked at delegating authority. In 1949, the Council of Europe was set up in Strasbourg, but it was not given the authority to cope with the urgent political and economic matters of the time.
It was Jean Monnet's ideato build Europe brick by brick, by modest but concrete achievements which would lead to real solidarity bet-ween countries. Instead of being created by decree, Europe would be constructed stage by stage.
The French Minister for Foreign Affairs, Robert Schuman, took over the idea. On 9 May 1950, he put the proposal to all the coun-tries concerned and negotiations began. On 18 April 1951, in Paris, the 'Six' signed the Treaty estab-lishing the European Coal and Steel Community, the ECSC. This was the 'leap into the unknown' in the building of Europe.
In 1957, the 'Six' completed a fur-ther stage by deciding to develop all economic activity on a joint basis. On 25 March, in Rome, they signed two Treaties giving birth to the European Economic Com-munity (EEC) and Euratom. The long-term objective was the union of the peoples of Europe. But first of all, a 'common market' had to be set up, where workers, goods and capital could circulate freely.
Just over 10 years later, on 1 July 1968, the customs union came in-to being. All cusin-toms duties bet-ween the six countries were ab-olished and a common tariff was adopted to be applied to other countries. The previous year, an identical system of taxes on
Photographs:
(1) Oh 9 May 1950, in the Salon de l'Horloge at the Foreign Affairs Ministry in Paris, Robert Schuman launches his challenge:
(2) On 27 January 1972, the EEC is enlarged. Prime Minister Edward Heath signs the Treaty of Accession of the United Kingdom in Brussels.
(3) On 28 May 1979, in Athens, the Greek Prime Minister, Mr Karamanlis, signs his country's acces-sion. Now they are Ten.
goods and services, VAT (value-added tax), had been introduced in all six countries.
Then came enlargement. In 1973, the Europe of Six became the Europe of Nine with the arrival of Denmark, Ireland and the United Kingdom. In 1981, they became Ten, when Greece joined, and on
1 January 1986, Twelve, with the entry of Spain and Portugal.
At the same time, joint activities were launched in new sectors. The common agricultural policy was set up in 1962, followed by
action in the fields of energy, re search, the environment, edu cation, consumer protection and the Community fisheries policy.
The European Social Fund (Euro pean fund for employment and vocational training), set up in 1960, was followed in 1975 by the ERDF (European Regional Deve lopment Fund), designed to help regions in difficulty. In March 1979, the EMS (European Mon etary System) was created to in troduce a degree of currency sta bility. This gave rise to the ECU (European currency unit), the European unit of account. Finally, in June 1979, the European Par liament was elected for the first time by universal suffrage.
But new boundaries had still to be crossed. In February 1986, the Twelve signed the 'Single Euro pean Act', to enable the Com munity to meet the challenges of the future.
The last 30 years have been mar ked by crises, debates and quar rels, but we have come a long way since the time when conflicts were settled by cannon fire. Jean Monnet won his bet: from one concrete decision to another, the European Community is achiev ing solidarity.
The growth of the Community
195B = EUR 6
D
1973 = EUR 9
S3 11 SB
DK IRL UK
r~.S
1981 =EUR 10
1986 = EUR 12
Ε Ρ
THE SlNfJtf
SPEAN ACT
For the citizens of the European Community to wake up on the morning of 1 January 1993 in a frontierless Europe - such is the next major objective of the con-struction of Europe laid down by the Single European Act.
Meeting in Luxembourg in De-cember 1985 the European Coun-cil (the Heads of State or Govern-ment) decided to give new impe-tus to European integration by drawing up a Single European Act, which was signed in Febru-ary 1986 and came into force on 1 July 1987, 30 years after the signature of the Treaty of Rome established the European Com-munity.
The Single Act is a new treaty whose aim is to bring the Com-munity into line with the needs of the 1990s by creating a truly fron-tierless internal market with a population of 320 million: the biggest in the world.
The concern for reality which masterminded the construction of Europe also guided the indivi-duals who signed the Single Act. The Commission set out more than 300 measures which must be taken before the last obstacle is removed. More than a quarter of them have already been adopted, and when the last comes into force at the end of 1992, the Com-munity will have taken a further step forward.
In the vast new internal market the citizens of the Twelve will be able to live and work in the coun-try of their choice, regardless of what job they do; tourists and tra-vellers will be able to use their cards in any country in the Com-munity, business will have a far wider market, greater profitability and greater opportunities for job-creation. Freedom of movement
will be total, for goods, for capi-tal, and for the individual.
The Single Act also represents political progress. In place of unanimous decisions, qualified majority voting (see table) will enable the Twelve to speed up de-cision making in many areas.
The Twelve are also committed to moving towards European politi-cal cooperation with regard to foreign policy, and to coordina-ting their individual positions as regards security.
The Single Act explicitly covers research and technological deve-lopment, which have already proven their worth: industrial ap-plications for lasers, new manu-facturing technology for micro-chips, renewable energy sources, etc.
It also covers the European Monetary System, the reduction of the disparities between the various regions and of the leeway of the least-favoured regions, and certain social policy measures.
Environmental protection be-comes an explicit aim of the Com-munity, with a prevention policy and the 'polluter pays' principle.
The Twelve have undertaken to harmonize working conditions and health and safety at work pro-visions. The Commission itself must continue to promote the dialogue between the two sides of industry on a European scale inaugurated by the current Presi-dent, Mr Jacques Delors.
Qualified majority voting in the Council of Ministers
(
D
F I G B
E
Β
GR
NL
Ρ DK
IRL
L
Country
Germany
France
Italy
United Kingdom
Spain
Belgium Greece Netherlands
Portugal Denmark
Ireland Luxembourg
Total
Qualified majority
Votes
10
10
10 10
8
5 5 5 3 3
3
2
THC
INSTI
T
UTI0N
S
The European Community is more than just another interna-tional organization. At the same time as Member States have kept their identity and their own authority, they have created the means of dialogue and decision-making: the Council of Ministers, the Parliament, the Court of Jus-tice, the Economic and Social Committee and, most original of all, the driving force: the Euro-pean Commission (see next chapter).
The Council of Ministers is the es-sential decision-making body of the Community. It comprises the 12 Ministers for Agriculture, For-eign Affairs, Finance, etc. de-pending on the subject under dis-cussion. In turn each Member State assumes the Presidency of the Council for six months. The Commission takes part in the work of the Council and may at any time amend or withdraw its proposal.
The Council of Ministers lay down Community policy in all fields. Its most important decisions must be unanimous, but some may be by qualified majority.
The ministers' work is prepared by the Coreper - the Committee of Permanent Representatives -which comprises the ambassa-dors of the Member States to the Community, together with their advisers. The Coreper is a key ele-ment in discussions between gov-ernments of Member States and with the Commission. It is the Council's factotum.
The European Council sets the broad guidelines for Community policy. It comprises the Heads of State or Government of the Member States (assisted by their Ministers for Foreign Affairs) and the President of the Commission, and meets at least twice a year. It is the European Council which provides the real drive: the cre-ation of the European Monetary System, the Single Act, etc.
The European Parliament has been elected by direct universal suffrage since 1979. It comprises 518 members (MEPs) elected from the 12 Member States by a system in which account is taken of relative population (see table). MEP groups are formed by polit-ical tendency and not by nation-ality (see table).
In comparison with national par-liaments the powers of the Euro-pean Parliament are limited. Sin-ce the Single Act came into forSin-ce, Parliament may on certain condi-tions amend the Commission's proposals to the Council of Min-isters, thus influencing the con-tent of European law.
The Parliament watches over the full range of the Commission's work, and can even demand the resignation of the Commission -though this requires a two-thirds majority of Members' votes.
In addition, Parliament has a cer-tain amount of control over the budget: it may increase certain expenditure in the budget sub-mitted for approval by the Com-mission, but it cannot enact new sources of revenue.
The institutions of the European Community
Luxembourg. Its task is to inter pret the European constitution and other European enactments in cases of dispute. The Court comprises 13 judges and six ad vocates-general appointed for six years by common agreement of the Member States. Their inde pendence is guaranteed.
European judges may annul na tional decisions and legislation which are incompatible with the provisions of the Treaties.
Any State, Community institution or individual may appeal to the
Court. The Court can also rule in cases submitted by national courts when litigation involves Community law. Its judgments are binding on all courts in all Member States.
The Economic and Social Com mittee, which is made up of rep resentatives of trade unions and professional bodies, gives its opi nion on the proposals made by the Commission.
The Court of Auditors monitors the execution of the Community's budget.
Π Ο Γ 5 Π Π Ο Π Ο Τ 5 ϋ Ο Ο ο © 0 0 0 0
Ü Ü Ö Ü Ü Ü Ü O U Ü Ü Ü O O Q O O O
13 judges 6 advocatesgeneral Court of Justice
17 * 12
tøS
European Commission Council of Ministers
518
European Parliament
Economic and Social Committee
XXX
For coal and steel affairs: Consultative Committee
« φ 12
o Court of Auditors
How a decision is taken in the European Community
INITIATION AND
IMPLEMENTATION OPINION
^ Ç v
DECISION SUPERVISION JUDICIAL
ADDRESSEE «
EUROPEAN PARLIAMENT .OPINION OPINION,
5^
COMMISSION proposal
3^
ζ χOPINION OPINION^ ECONOMIC AND SOCIAL COMMITTEE
i Ç S
COURT OF JUSTICE Directive COUNCIL
Member States
Regulation/Decision ^
Private firms
Photographs:
(1) The Berlaymont. in Brussels, headquarters of the European Commission.
THE
COM
MISSION
The European Commission is the Community's powerhouse, and its executive. Independent of Member States' governments, it is answerable only to the Euro-pean Parliament in its power to initiate and execute policy.
There are 17 Members of the Commission: two each from France, Germany, Italy, Spain and the United Kingdom, and one from each of the other Member States. They are totally indepen-dent of their country of origin and are appointed for four years. Each Member has particular responsibilities, but the Com-mission's decisions are colle-giate. Its current president is Jacques Delors.
The Commission's role in initiat-ing policy makes it the only Com-munity institution capable of drafting Community laws. Its pro-posals are submitted to the Coun-cil of Ministers, the Parliament and the Economic and Social Committee. In 1985 the Commis-sion submitted 694 proposals to the Council of Ministers, covering agriculture, energy, research, etc.
The Commission implements the decisions reached by the Council of Ministers, and the various Community policies. In coal and steel, nuclear energy and compe-tition it also has additional pow-ers laid down in the Treaties. With a mandate from the Council of Ministers the Commission can negotiate trade agreements with non-member countries, and man-age agricultural markets.
The Commission draws up the budget, which it submits to the Council of Ministers and to Par-liament, and manages the Com-munity funds and common poli-cies (agriculture, regional deve-lopment, and employment). The Commission's administrative de-partments are located in Brussels and Luxembourg.
Lastly, it is the Commission's task to ensure that the Community rules and the principles of the common market are respected. It is the watchdog of the Treaties, and can take to the Court of Jus-tice any Member State which fails to fulfil its obligations.
Special responsibilities of the Members of the Commission Karl-Heinz Narjes **
Industrial affairs Information technology Research and science Joint Research Centre
Lorenzo Natali**
Cooperation and development
Frans Andriessen ** Agriculture
Forestry
Lord Francis Arthur Cockfield**
Internal market Customs Union Service Taxation
Financial institutions
Carlo Ripa di Meana
Institutional questions Problems concerning a Citizens' Europe Information and communication policy
Cultural affairs Tourism
Peter Sutherland
Relations with the European Parliament Competition
THE Β
UpGET
Is Europe expensive? In 1985, its budget stood at 28000 million ECU, 95% of which was redistri buted among the Member States; and it is impossible to put a figure on the political, economic and commercial advantages which the existence of the Community brings to European citizens, in dustrialists and businessmen.
In 1985 the budget represented a contribution of 105 ECU for each citizen. By comparison, he paid 36 times that amount to his coun try's national budget. The EC budget amounts to only 2.8% of the total of all the Member States' budgets, or less than 1 % of gross national product (GNP). In 1973, the European budget was only 0.5% of GNP. The neardoubling of this percentage by 1985 is a re flection of the development of common policies: in 12 years Europe had grown, taking on an increasing share of its Mem ber States' policies and their financing.
Where does Europe's money come from? VAT (valueadded tax) provides more than half its receipts (55.5% in 1985), by means of a levy on each Member State's gross valueadded.
Customs duties on imports into the Community are the second largest contributor to Europe's income, accounting for 29.6% in 1985. Levies on agricultural prod ucts imported from nonmember countries account for a further 4%. The Community also im poses levies on sugar and cer tain types of glucose (5.9%) to encourage producers to limit sur pluses.
The rest of the 1985 budget was made up by sundry payments and nonrepayable advances from the Member States (5.9%).
What does it do with its money? Agriculture and fisheries account for 73% of the budget, 70% being spent on guaranteeing farm prices (see Agriculture section).
This at first sight disproportion ate share of the Community budget taken by 'green Europe' (the cost of which represents, however, only 3% of Europeans'
expenditure on food) is explained by the fact that it is in this area that Community financing has taken over most clearly from national financing.
Three major Funds exemplify the Community's political will to con solidate its economic and social cohesion by means of appro priate structural policies;
The Regional Fund (5.9% of the budget in 1985) has two main ob jectives: first, the growth and ad justment of the regional econo mies characterized by a structural deficit; secondly, the redevelop ment of declining industrial re gions.
The Social Fund (5.7% of the budget) supports social policy through, in particular:
(i) the fight against unemploy ment, especially youth and longterm unemployment; (ii) vocational integration of
young people.
Lastly, the EAGGFGuidance Sec tion has as its main aim to speed up the adaptation of agricultural production structures and to en courage rural development.
Development cooperation ac counted for 3.9% of expenditure, i.e. 1100 million ECU, intended primarily for food aid and for the countries of the Mediterranean, Asia and Latin America. In addi tion, the Lomé Convention pro vides for financial and technical assistance to 66 African, Carib
bean and Pacific countries, total ling 8500 million ECU between 1985 and 1990. This assistance is financed outside the budget by the European Development Fund, to which the countries contribute, and by means of loans from the
European Investment Bank.
Finally, the administrative costs of the EC amounted to approx-imately 4 % of the budget, or 1 300 million ECU, in 1985. Europe runs with just under 20000 officials, fewer than the number of local authority employees of a city such as Birmingham, half as many as those employed by the city of Paris and no more than the Belgian Ministry of Finance.
General Community budget: 1985
Receipts
VAT Customs duties Non-repayable advances Agricultural levies Sugar and isoglucose levies Miscellaneous
55.5% 29.6% 5.9% 4.0% 3.8% 1.2%
Expenditure Agriculture and fisheries Regional policy Social policy
Development cooperation Research, energy, industry and transport Administrative costs Miscellaneous
ENVIBÕ
ÑMEÑT
Almost all human and economic activities affect the quality of the air, water, soil, animal life and sea, etc. The aim of the environmental poli cies of the European Community and the Member States is to limit and prevent the adverse effects or to offset them by restorative measures.
STRUCTURE OF THE ENVIRONMENT
Energy consumption and popula tion density are major factors here. In the United States, for example, the high per capita energy consumption reflects in part the population density in that country. The consequences of these factors differ from country to country.
In most countries, environmental policies have been developed from the 1970s onwards, and this is reflected in the increase in pro tected zones.
The Community is preparing to introduce an information system and a network for the exchange of data between Member States with a view to determining the state of the environment and to measuring variations in the qua lity of the air, water, soil, etc.
The statistics also take into ac count the costs and benefits of activities to combat pollution, to restore the environment and to regulate protected species, whether these activities are con ducted by governments, busines ses or private individuals.
Energy gross domestic per capita consumption
350
250
150
50 0
■ U H 12 UIA JAPAN USSR
Population density par km2
IO O
°> O aam
>— UM
MUK 1* USA JAPAN USSR
OL Land arma: major protected lonmm am a pareantaga ol tha total surface arma 6
This satellite-photo of north-western Europe was reconstructed from four pictures taken by the Landsat satellite in April 1985. The colour of each element was reconstructed by computer after spectral analysis of the images. The same program can also identify the characteristics of the pho-tographed zone and hence the users of the land surface.
Section (1 ) is an urban zone, Antwerp. The computer can locate similar zones and calculate the total urban surface. This also applies to polders (2), forests (3), etc. In future this system, supplemented by other sources of data, will make it possible to prepare statistics on land use for the en-tire EEC (see figure below). However, collection, storage and processing of these images is still quite expensive, quite apart from the fact that the sky over Europe is not always clear when the satellites are overhead...
Land use 1985
Wooded area
Other land
Built-up land
22,1% M
9,0% fl
FOB
ÊsTR*
Woodland covers nearly a quarter of the European Community, i.e. almost 54 million hectares. A fifth of this area is, however, occupied by brushwood, stunted trees, shelter belts and other forest too sparse to be suitable for timber production.
In terms of percentage surface area, the most wooded countries are Greece (43.6%), Portugal (32.3%), Luxembourg (31.7%) and the Federal Republic of Ger-many (29%). Only 2.5 million hec-tares of Greece's woodland is usable forest, 3.2 million hectares being scrub; Spain has 6.9 million hectares of usable forest and 5.6 million of scrub, while France has 13.6 million and only 1.1 million respectively. Ireland, with only 5.6% of its surface area covered by forest, is the least wooded country, closely followed by the Netherlands (9%) and the United Kingdom (9,1%).
1 -
'i\f
v$M& Å
i
'ñfÉfí
The largest total wooded areas are to be found in France, with 14.7 million hectares, and Spain, with 12.5 million, accounting, bet-ween them, for half of the total wooded area of the Community. Together with Germany, Greece and Italy, the total rises to 87%. The seven other members of the EEC share the remainder.
Forests -Structure and production
(1OOO ha) 19B5
f 57,6 \
^ ^ ^ ^ j T s ^ i / ^ " ^
Ρ = Privately owned
Ownership in % (EUR 12)
*ψ
S = State-owned
( 14,8 à
0 = Other public owner
Rough timber supply of the 12 Member States
Ρ
s
0 Β
53,1
10,9
36,0 DK
65,5
30,4
4,1 D
43,8
31,1
25,1 GR
14,8
73,2
12,1 E
65,0
35,0 F
71,9
9,6
18,5 IRL
20,2
79,3
0,5 I
60,2
5,9
33,9 L
53,7
8,5 37,8
NL
53,1
30,2
16,7 Ρ
83,0
•
■17,0 ί
UK
56,5
>43,5
More than half (58%) of European forests are privately owned (by indi viduals, companies, institutions, etc.). Only 27% of the surface area is State-owned and the remainder belongs to other public bodies (15%). Private ownership is particularly common in Portugal (83%), France (72%), Denmark (65%) and Spain (also 65%). By contrast, only 20% of forest is privately owned in Ireland and 15% in Greece, the State owning 80% and 73% respectively.
B/L
OK D
GR
E F IRL I NL Ρ UK
1985 Timber production (EUR 12 · 2,9%
2,2%
27,6% '
2,5%
13,0%
28,6%
1,0% 8,7% 1,0% 8,8% 3,7%
C
WL¡
β )
m
■ ■
■
§
i ι
wm
li
5 1
* 100%)
0 15 20 2
\\\\% ■
\\\\\Ψ·\
Ι'
5 3 0 %
In 1985, timber production stood at 105 million m3, or only 3% of world production. The EEC ex ports 10 million m3 of rough tim ber to third countries, but has to import 15 million m3. Taking ac count of requirements for timber and woodbased products such as sawn wood, panelling, pulp, paper and board, the Community deficit is quite substantial, amounting to around 15000 mil
lion ECU a year, second only to petroleum products.
In recent years there has been a growing awareness in Europe of forest infrastructure in terms of both the environment and rural development.
million m3 1985
Production 105
Imports .15
Exports .10
Degree of selfsufficiency in rough timber (excl. stocks) 95,4
o
o
*gS®&
The population of the European Community in 1985 stood at 322 million 6.7% of the world popula tion.
The population of Europe of the Twelve is thus greater than that of the Soviet Union (279 million), the United States (239 million) and Japan (121 million). Four Member States, the Federal Republic of
Germany, the United Kingdom, Italy and France account for 71 % of the Community's inhabitants.
Population density is higher in Europe than in the United States and the Soviet Union (143 people per square kilometre on average compared with 26 and 12 respec tively).
Country
Β DK
D
GR
ε
F IRL
I L NL
Ρ UK EUR 12
USA USSR JAPAN World
Total population, Population (thousands)
9858 5114 61024 9935 38602 55170 3540 57141 367 14492 10157 56618
322000
Area, population density in 1985
Area Persons (1000 krrf) (per km*)
31 323 43 119 249 245 132 75 505 76 544 101
69 51 301 190
3 141 42 352 92 110 244 232
2253 143
239300 278600 120 700
4837000
9372 26 22402 12 372 324
135837 37
The density map (see opposite) shows that the most densely populated regions of the Com munity stretch along a diagonal line from north-west England to the industrial regions of northern Italy, passing through southern Holland, northern Belgium and the Rhine-Ruhr area of Germany. The lle-de-France and the Paris conurbation, surrounded by comparatively low-density re gions, lies away from this dia gonal.
These high-density areas corres pond to industrial regions or ad ministrative centres, such as Madrid, Lisbon and Naples. The low population density regions are not necessarily the poorer up land areas, but sometimes, as is the case of Champagne, regions which include vast, highly-me
Comparing the populations of the major European cities in a man-ner which is statistically valid is not as easy as one might think. Each country has its own ways of circumscribing administrative areas. The table showing the pop-ulation of the big towns and cities, based on census data col-lected around 1981, can only per-mit approximative comparisons. The population of the conurba-tion is sometimes much greater than that of the administrative area which constitutes its centre. A case in point is the Paris con-urbation, which has a concentra-tion of 8.7 million inhabitants, whereas the city of Paris on its own has only 2.2 million. Another example is the Milan conurbation which has 2.8 million inhabitants,
Main conurbations (number of inhabitants)
Bruxelles Kobenhavn Rhein-Ruhr
Köln Essen West-Berlin München Hamburg Athens Paris Lyon Marseille Lille Dublin
Milano
Roma
1280000 1370000 7790000 960000 640000 1870 000 1840000 1620000 3030000 8710000 1220000 1110000 940000 920000 2810000 2 790 000
Napoli Torino Genova Rotterdam Amsterdam London West Midlands Manchester Glasgow West Yorkshire Tyneside Liverpool Madrid Barcelona Valencia Lisboa
2 520000 1480000
800000 1030000 940 000 7680000 2360 000 2340 000 1210000 1 480 000
780000 750000 4170000 2 700 000
850000 1300 000
whereas the municipality of Milan has 1.6 million. Lastly, in the Rhine-Ruhr area of Germany, nearly 8 million people are con-centrated in 17 towns, the sub-urbs of which merge to form a vast and more or less continuous urban area.
FU
flTHE?,FOB f a s t a t pu .bue*»
oe**oe
r^pvuc
o
Population trends in the Euro pean Community are giving demographers, economists and politicians cause for concern: the fact is that since the middle of the 1960s the birth rate has slumped.
This trend affects all the devel oped countries. However, where as over the past few years the sit
uation has been levelling off in the United States and the Soviet Union, the population of Europe continues to decline.
In 1985 the gross birth rate for the Community as a whole was 11.8 per 1000 inhabitants. In the case of Germany, this figure even dropped to 9.6 per 1 000 inhabi tants.
Birth rate (Births per 1000 total population)
25
20
15
10
1960 1965
!■■■
7970 7975 7980 7985Allowing for a certain number of children who die before reaching the age at which they could pro create, the zero growth (pop ulation replacement) threshold stands at 2.1 children per woman and is achieved by two Member States only (Ireland and Spain). Germany has the extraordinarily low figure of 1.3 children per wo man, which means that each new generation in that country is therefore far smaller than that
which procreated it, the number of children not even reaching two thirds of that of the parents.
A number of theories can account for the fall in fertility in the devel oped countries: changing men talities generated by industriali zation and urban growth, rising standard of living, the crisis af flicting the family as a unit, fe male employment, birth control.
Average number of children per woman (1985)
Q oc «I 3 UI
ΙΛ
3 2:
Q.
»00
80-Infant mortality rate (1985)
60
40
20
¿=7I
SÌ
EUR 12 USA USSR JAPAN WorU
The infant mortality rate is consi dered to be a sound indicator of the health of a nation. It is calcu lated by dividing the number of children dying before reaching the age of one year by the number of children born alive.
The infant mortality rate in Eur ope (9.4 per 1000) is one of the lowest in the world. However, Ja pan's is even lower (6 per 1000). This rate reaches 11.6 in the USA and, for a developed country, is comparatively high in the USSR, where it stands at 23.5.
The infant mortality rate for the world as a whole is much higher (77 per 1000).
Life expectancy at birth (1985)
80.
70 I
60
50 + 0L
*
α
WorldEUR 12 USA USSR JAPAN
A further indicator of the health of a nation is the life expectancy at birth. It is highest in Japan at 74.3 years for men and 79.7 years for women. In Europe, it stands at 71.6 years for a man and 78.2 for a woman, well above the world average (58.3 and 61.6 respec tively).
age 95.
I—I EUR 12 I | World
Age pyramid 1985 (as % of total population)
90
85
80
75
70
65
60
55 50 45
40
35
30
25
20
75 70 5
0-T 6
European population growth is low: projections over a period of 20 years (from 1985 to 2005) give a population growth rate in the European Community of barely 2%, whereas the world average is 36%, the USA and the USSR can expect 17% and Japan 8%. Two Member States already have a dwindling population: Germany since 1981 and Belgium where the downturn has just started.
Population growth 19852005
40.
30
20
10
/Uní
a
£ΞΛ tionsEUR 12 USA USSR JAPAN
*»>&&&&
^"
«ii
ED"
CATION
There are fewer children at school in Europe now than there were 10 years ago, but they are tending to stay at school longer and a growing proportion of girls are staying on at school and going on to higher education.
The number of children at school (at all levels from nursery school to higher education) peaked in 197778 at 71.8 million, falling to 68.4 million by 198485. In the same year the United States had a total of 58.5 million children at school and university, compared with 26.6 million in Japan and 59.8 million in the Soviet Union. This represented 22% of the total population in the Community, Japan and the USSR, but 25% in the USA.
The declining school population in the Community is due to the declining birth rate from the mid1960s (see previous pages). The primary sector was of course the first to feel the pinch after its peak of 29.5 million children in 197172. In the lower secondary sector, the peak was not reached until 197778 (19.7 million).
The fall in the birth rate has not been so obvious in upper second ary education, as young people are tending to stay at school long er. More than a quarter of all young people in Europe (26.6%) were still at school at the age of 19 in 198485, compared with only 18.8% in 197071.
75 ι
10
60
5 0
40
30
20
10
0
■ · · · ..'
Trends in the numbers of pupils and students
A+* ,···*'"*
***** .:··
* M * ,.·*"·'
*****
· · » · ■ ...
··—— ···«·.
. — . Preschool
First stege (primary schoot) M M Second stage (secondary school) . . . . Third stage (higher education)
Total
H M N M M N I M M H I M ' • 1 — — * ( M M N M M N 1 M M
70/7) 71/72 72/73 73/74 74/75 75/76 76/77 77/78 78/79 79/80 80/8Í flr/82 82/83 83/84 84/85
Children and young people at school and in higher education
1984/85 (millions)
Preschool
Primary
Secondary Tertimry
Total
BUR 12 B.6
23.5 30.2
6.2
68.4
USA
5,5
26.8 13,8 12.5
58, S
Japan 2,1
11.5 10.6
2.4
25.5
USSR
11.3 23.2 20.0
5,3 59,9
The most striking development has been the Increase in the num ber of girls in the higher levels of secondary education and in uni versities and other higher edu cation establishments between 197071 and 198485. The propor
The fact that, in some secondary classes, there are more girls than boys can be put down largely to boys tending to follow an appren ticetype education, which is not included in the statistics.
Overall, the number of students has risen steadily, from 3.5 mil lion in 197071 to 6.2 million in 198485, an increase of 77%. The choice of subjects has changed, though. Whereas medicine and the technical subjects attract roughly the same proportion as before, the social sciences have leapt from 11.8% to 19.6% and have taken over at the top of the league table from arts subjects, which have fallen by 3 percentage points. The main difference, how ever, is that only 7.1% of stu dents are aiming for a career in teaching, compared with 14.6% in 197071. The fine arts, mean while, are proving very popular among the new generation of stu dents, accounting for 5.2% now as against 3.4% before.
Fulltime education in the European Community 130 ι mwi 1 1 1 1 1 1 1 1—ι—
° 1 1
770 I I I
Ijlj..
90 80
70
60
50 ~
40
30
.
1 1 1 1 I II II II II I | 1 1 1
ο ι ι ι I I 1
Girls to 100 boys Upper secondary sector
197071 D 198485
Women to 100 men Tertiary sector
197071 Q 198485
100
90
80
70
60
50
40'
30'
Γ Γ
l | 1 1 I I I I 11 l | l | l | l | l | l |
α u, iu « t ï Q
Percentage of students in higher education by subject area (EUR 12)
Social sciences
Medical sciences
Arts
Engineering
Natural sciences
Law Teacher training
Fine arts Agriculture.
forestry and fishing
:
**iS8ä&
Between 1970 and 1985 the popu lation of the European Commu nity went up by 19 million (6.1 %) and the population of working age (between 15 and 64) by 23 million (12.2%). This is explained by the age structure of the popu lation of Europe. In the 1970s the generation reaching working age was particularly large in number: they were the children born just after the Second World War at the time of the 'baby boom'; at the same time, however, the genera tion of those retiring was particu larly small in number: they were the children born during the
Great War, of whom there were relatively few.
The active population, i.e. those persons working or wishing to work, developed in parallel with the population of working age: in crease of 12 million, or 9.7%, over 15 years. The main component of the active population, i.e. those in employment, remained virtual ly unchanged in the 1970s and 1980s. There was therefore a sub stantial increase in the section of the active population wishing to work but not finding jobs, i.e. the
Rate of activity 1985 (%)
Τ M W Β 42.6 52,6 33,1 DK 55,4 61,5 49,5 D 45,6 58.5 33.8 GR 41,0 55.2 27,3 E 35,7 50,6 21,2 F 43,3 51,6 35,4 IRL 36,6 51,3 21,7 I 41,1 55,0 27,9 L 42,4 56,1 29,3 NL 40,3 53,2 27,6 Ρ 44,5 54.0 35,7 UK 48,7 59,6 38,3
unemployed, from 3 million at the beginning of the 1970s to over 14 million at the end of the decade, i.e. more than 10% of the active population and almost 5% of the total population.
The rate of activity (ratio of the active population to total popula tion) in 1985 stood at 43.3%. Spain and Ireland had activity rates of 36% and 37%, while those of the United Kingdom and Denmark reached 49% and 55% respectively.
Τ M W
EUR 12 43,3 55,3 32,0 USA 49,3 57,1 41,8 JAPAN 49,4 60,5 38,6 Τ = Total J M = Men IW = Women The United States and Japan, with 49%, have activity rates higher than those of the EC. This difference is due above all to the
1000 250 200 750 700 50
Structure of the total population in the EC
Inactive population (1564 years)
• _ ^inempio^eó In employment
" Ί I I I I 1 I I I I I I I I
fact that a higher proportion of women are present on the em ployment market. While 32% of women are in employment or seeking employment in the EC, the corresponding figure is 39% for Japan and 42% for the USA. Lastly, a high proportion of men work beyond the age of 65 years in Japan and this takes the activ ity rate for the male population to over 60%, compared with 55% on average in the Community.
Denmark is a special case in that its activity rate is well above the European average and even higher than that of the United States and Japan; this is true for both men and women.
The inclination of European women to work varies consider ably from one country to another: female activity rates are above the Community average in Denmark (50%) and well below in Spain and Ireland (21 %) as well as - and this is not such a familiar fact - in the Netherlands, Italy and Greece (28%). Women in Belgium, Ger many and Luxembourg are closest to the Community aver age with 33%, 34% and 30% re spectively.
Marriage plays a major role in variations in the rates of activity of the female population. This is
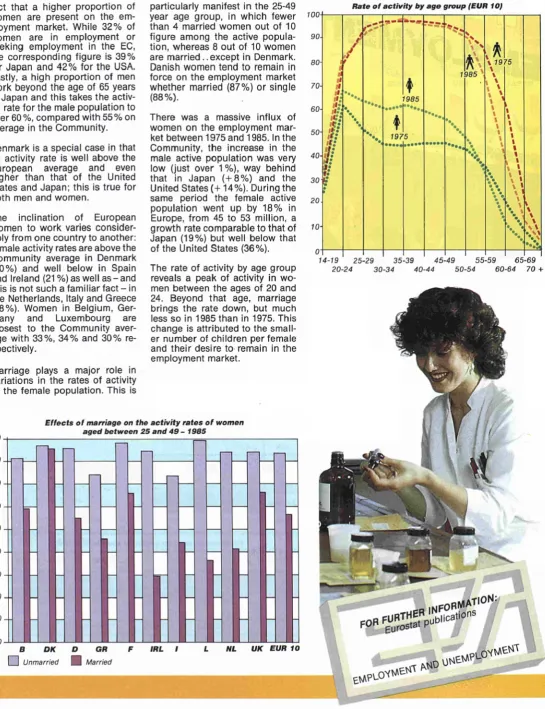
[image:25.595.28.574.49.759.2]particularly manifest in the 25-49 year age group, in which fewer than 4 married women out of 10 figure among the active popula tion, whereas 8 out of 10 women are married..except in Denmark. Danish women tend to remain in force on the employment market whether married (87%) or single (88%).
There was a massive influx of women on the employment mar ket between 1975 and 1985. In the Community, the increase in the male active population was very low (just over 1 %), way behind that in Japan (+8%) and the United States (+14%). During the same period the female active population went up by 18% in Europe, from 45 to 53 million, a growth rate comparable to that of Japan (19%) but well below that of the United States (36%).
The rate of activity by age group reveals a peak of activity in wo men between the ages of 20 and 24. Beyond that age, marriage brings the rate down, but much less so in 1985 than in 1975. This change is attributed to the small er number of children per female and their desire to remain in the employment market. 90- 80- 70- 60- 50- 40-30 20 ίο υ
fíate of activity by age group (EUR 10)
1 II I I If II, a: " :
ï:·
ff:
Ψ
¡t:i
»: Η » ι · · . ··, ·.ί
7985f
1975' - - < * * .
—
7985 \
\ ·*.. * 7975 \ \ \ \ 1 1 t t t I t t t '.'. ,· • ■ • · • · • « m
• • • • i t l 1 t t 1 1 1
\ \ \ i
\
·. \ \ 1
■■<
w
v
74-79 25-29
20-24 30
35-39 45-49 55-59 65-69
EMPI·
0
YWIÊNT
Between 1975 and 1985 there was little change in employment in the European Community (fall of less than one million jobs, i.e. 0.7%). However, over the same period 21 million jobs (24%) were created in the United States and 6 million (11%) in Japan.
The fall in the number of jobs af fected mainly the industrial sec tor, which had 7.5 million jobs fewer in 1985 than 10 years earli er. At the same time the Japanese and Americans were creating 1.5 million and 4 million jobs in in dustry respectively.
Total employment 1985
Β DK D GR ε F IRL I L NL Ρ UK
EUR 12
USA JAPAN Total (million) 3,662 2,598 25,531 3,774 10,798 21,476 1,073 21,113 0,161 5,208 4,137 24,391 123,922 109,378 58,070 Women (%) 37,4 44,5 38,2 32,3 28,6 40,6 30,8 32,4 33,7 33,9 40,0 41,6 37,2 43,4 39,7 Young people <25 (%)
13,8 20,5 19,3 7 7,5
73,7 13,7 24,5 13,3 20,7 18,3 18,3 21,3 16,8 18,7 12,0
The real watershed was at the turn of the decade, at the time of the second oil price shock. In 1981, European industry shed 1.7 million jobs, followed by a further 1.5 million in 1982. 1982 was also a black year for the USA (2 million jobs lost). Even Japan took a mi nor battering, losing 50000 jobs. The difference is, though, that while the USA and Japan made up the lost ground in subsequent years, employment in industry in the Community continued to fall.
Employment in agriculture has declined in all the developed countries: by 3.6 million in the EC, by 1.5 million in Japan and by 0.2 million in the USA. This was due essentially to increased mechanization, an area in which the Americans already had a head start, with a 1975 workforce of no more than 3.5 million, compared with 6.6 million in Japan and 13.9 million in the Community.
The sen/ices sector created jobs (10.2 million of them) in the EC between 1975 and 1985. The equivalent figure in Japan was 5.8 million, while the US figure shot up by as much as 17.6 million. This increase in services jobs is characteristic of the current eco nomic situation in the developed countries, although it is worth pointing out that some of these jobs (especially in the United States) are parttime only and may not be particularly durable.
Total employment by sector of economic activity
1975 Agriculture 1985 1975 Industry 1985 1975 Services 1985
Breakdown of parttime employment
EUR 101985
Married women
Single women
Women accounted for 37% of the 124 million jobs available in the EC in 1985, the Japanese and American equivalent rates being 40% (of 58 million jobs) and 43% (of 109 million jobs) respectively. In Denmark, though, the percent age was even higher than in the USA, at 44.5 %. At the other end of the scale women occupied a smaller proportion of the avail able jobs in Spain, Ireland, Greece and Italy.
Young people occupy a small proportion of jobs in Europe, where only one job in six is held by an 'under25'. This is largely due to the inadequate number of new jobs being created. The per centage figure for youth employ ment is higher in the USA at one in five, but lower in Japan (one in eight), where formal education and vocational training last long er. In Ireland, one job in four is held by an 'under25', owing to the high proportion of young people in the population.
Percentage share of total employment by sector 1985
Β
8,6 DK
24,3 D
12,8 GR
5,3
Ρ
10,9 IRL
6,5 I
5,3 L
7,2 NL
22,7 UK
21,2 EUR
12
13,1 USA
17,4 JAP
11.0
Of the total 124 million jobs avail able in the EC, the services sector accounts for 72.6 million, or al most 59%, while industry has 41 million jobs (33%) and agricul ture 10 million (8.4%). Employ ment in industry is on much the same scale in Japan but is lower in the USA (25%), where services take the lion's share (70%).
Employment in agriculture rang es from 2.5% in the United King dom to 27.5% in Greece.
Jobs for women predominate in the services sector, with 45% in the EC and more than 50% in the USA. This sector, of course, in cludes what are traditionally re garded as 'women's jobs', espe
cially in teaching. More women have entered the job market in recent years as jobs have been created in services.
Women are better represented in farming than their American counterparts, especially in sou thern Europe, where small family farms are still commonplace. On the other hand, the proportion of women in industry is higher in the
USA and Japan.
Parttime jobs in the EC are on the increase, totalling 14 million in 1985. These jobs are mainly the preserve of married women, who occupied 7 out of 10, compared with no more than 2 in 10 of full time jobs.
Parttime working as a % of total employment 1985
□ Agriculture f ^ ^ S ^ k S | p 7
EUR 12 USA JAPAN
Proportion of women in each sector 1985 (%)
Agriculture
I I EUR 12
I
USA
I I
JAPAN
Ή
Services
ι ι
7 0 20 30 40 50
E^P\-° YW\£^
UMEM^NSS
ffiß&&
With 16 million registered unem ployed in 1986 compared with 5 million in 1975, unemployment has become more and more of a preoccupation in the European Community. The United States has coped with the problem more successfully, while in Japan it has not been so acute.
From 2.9% in 1975, the unemploy ment rate in the EEC rose to al most 1 1 % in 1986. There have been three distinct phases in this development. Partly as a result of
the quadrupling of oil prices in 1973, the economic crises got steadily worse. Between 1975 and 1979 the number of people with out a job grew by something like half a million a year, but the pace was stepped up in 1980, with an other million jobless, followed by a further two million a year until 1983. The rate of increase then slowed down, and the latest avail able statistics point to 300 000 more unemployed in 1986 com pared with 1985.
Trend in the number of persons unemployed (in millions)
M
i; i I! ii
,.
ËGfj
■imml:. .
..JÀ.. Jk:
■ ft" ■ ■ - , -"$Hfl&3Bffl
77
76
75
74
73
72 77
70 9
8
7
6
5
4
3
2
1
0 .
.*' EUR 12
t t * I t
* »
/ · / *
/ ♦
USA
**+
JAPAN
1975
— ι 1 1 1 1 ι 1 1 1 1
7976 7977 7978 7979 79SO 7987 7982 7983 7984 7985 7986
Unemployment rate (%)
1975
1981
1985
1986
EUR 12
2,9
7,8
10.6
10,7
USA
8,5
7,6
7,2
7,0
JAPAN
1,9
2,2
2,6
2,8
Japan is a special case in that the jobless rate is no more than 2.8%, although here too the situation has deteriorated from the 1.9% recorded in 1975.
The countries and regions of Europe are not affected evenly by the scourge of unemployment. Luxembourg has far and away the lowest unemployment rate in the Community at 2.5%. Among the bigger Member States, the Fed-eral Republic of Germany comes off best with 7.1%. The highest rates are in Spain, with 21.5%, closely followed by Ireland, with 18.7%.
In the regions of Europe, the highest rates of unemployment tend to be on the fringes in north and south, although the unem-ployment rate in certain high population density enclaves where the industries are under-going a crisis is just as high.
Within one and the same country the rate of unemployment in one region may be double that of an-other. Thus, in Belgium the rate varies between 7% (western Flanders) and 14% (Hainaut). There is a similar discrepancy in
France between Alsace (7%) and Languedoc-Roussillon (14%).
Unemployment rate by region April 1986
Unemployment rate (%)
25%
u*sstfSfl£
The rise in unemployment has been accompanied by an increas ingly serious problem: longterm unemployment. More than half of all those on the dole (53%) have been unemployed for more than a year, and their situation all too of ten looks fairly hopeless.
A third of the jobless have been looking for a job for more than two years, accounting foran even greater proportion of the total in the United Kingdom, Italy, Bel gium, the Netherlands and
France. In Italy the under25s ac count for a majority of the long term unemployed.
Length of unemployment (men and women) April 1985 (% of total) Π < 7 2 months
Ü72 23 months
M >23 months
Percentage of all unemployed persons
April 1986
EUR 12
Β
DK
D
GR
E
F
IRL
I
L
NL
Ρ
UK
Women
46,9
62,2
57,9
49,7
54,0
36,2
54,0
33,8
56,2
48,7
44,0
56,4
40,4
Young people
40,9
31,8
30,1
28,1
42,6
47,0
37,5
38,5
59.5
45,0
30,4
51,7
34.9
Longterm unem ployed ± 12 months'
52,1
68,2
32,0
46,9
43,4
56,3
43,8
62,2
63,6
36,8
56,4
48,4
48,7
Unemployment does not affect the entire population in the same way, young people and women being the main blackspots.
Unemployment rates are particu larly high among the under25s, 23% of whom were on the dole in April 1986 on average in the Com munity. The corresponding figure for young women was even high er at 25%.
Women too are more affected by the unemployment problem than men. 13% of them were jobless in April 1986, compared with a male unemployment rate of 9.3%. 47 out of 100 jobless were women.
This situation varies widely from country to country, but the fig ures are lowest in Ireland (34% women in the dole queue) and Spain (36%), two countries where women tend not to appear on the job market in such large numbers.
Unemployment rates for young persons and adults April 1986 (%)
< 25 years à 25 years
Unemployment rates for young persons (%)
1983
1984
7985
7986 EUR 12
:
23,5
23,7
22,6 s
24,5
26,3
23,5
20,3
DK
18,9
15,0
12,5
9.7
D
7 7,3
11,0
10,6
10,0 GH 22,8
23,9
23,8
23,2 E 41,3
46,3
48,7
47,5
F
18,2
24,1
24,4
23.0
IRL
21,5
24,1
26,0
26,9 ι
28,2
32,4
31,7
33,5 L
7,3
5,5
6,4
5,2
NL
20,5
20.7
17,2
14,9
ρ
i
19,9
20,3
21,6
UK
20,4
19,0
18,2
17,8
Unemployment rate April 1986 (%) 25,
Β DK D GR E F IRL NL Ρ UK
The European Community has focused its attention on the fight against unemployment and is trying to improve the labour market situ ation through, in particular, the European Social Fund and the Euro pean Regional Development Fund. These resources are given over largely to the training and recruitment of young unemployed persons, especially in the poorest regions.
__
l l N FO R M *T l O N
# » * * *
OBOSS Vß**$
In the space of 25 years the Euro pean doubled his income, having twice as many goods and sen/ices at his disposal in 1985 as in 1960. In the same period, per capita gross domestic product (GDP: to tal goods and services resulting from economic activity) in the United States increased by 'only' 60%, while in Japan it multiplied by four.
The economy grew the fastest in the European countries with the lowest GDP, such as Greece, Spain and Portugal, where annu al growth rates were between 4.6% and 5.1%. In the United Kingdom, by contrast, the growth rate was a bare 2.2%.
Europe's total GDP stood at 3310000 million ECU in 1985. (The ECU is the European cur rency unit, based on market ex change rates.) However, at 5170000 million ECU, GDP in the United States was still much higher. Japan's total value of pro duction, at 1 750000 million ECU, on the other hand, was only half that of the European Community.
The five most densely populated Member States of the EEC (Fed eral Republic of Germany, United Kingdom, Italy, France and Spain) are together responsible for 87% of the Community's GDP.
550
500 |
400.
300
200
Growth in GDP (volume) 1960 = 100
JAPAN
EUR 12
. ♦ · ·
. . . . · * .. ' Γ » . «SA
" _ _ . mm **
100-*tâsS&'"°
1960 1965 1970 1975 1980 1985
Gross domestic product 1985 ('000 million ECU)
Total EUR 12: 3314 175
150 125 100 75 50 25 0
*
Regional disparities in per capita GDP - 1985
> 72500 pps 10000-12500 pps
7500-10000 PPS
Ζ 7500 pps
To compare the GDPs of different countries it is often preferable to use the PPS, the 'purchasing power standard', a reference unit which takes into account the dif ferences in price levels in the dif ferent countries.
Japan's per capita GDP (express ed in PPS) is now 11% higher than Europe's, and the USA's is still 56% higher.
The disparities between regions of the Community are ever great er than those between Member States, since they reflect both the heterogeneity of the Member States and regional differences within the countries. Per capita GDP varies by a factor of about 2 between northern and southern Italy, north-east (Basque region, Rioja, Catalonia) and south-west Spain (Andalusia, Extremadura) or the lle-de-France and certain
other regions of France (Corsica, Limousin). According to the Com mission's latest report on the socio-economic situation and de velopment of the Community re gions, the regional disparities in the Community are attributable equally to the international com ponent and to the regional dispa rities within the countries.
There are still enormous dispari ties between the Member States.
Per capita GDP (expressed in PPS) is above average in the most developed countries such as Luxembourg, Denmark and the Federal Republic of Germany (between 28 and 16%), while Ire land, Spain, Greece and Portugal are between 36 and 47% below
average.
^ s s s s *
Eur
K C C O ^ T S ^ '
The level of consumption varies enormously from one EEC Mem ber State to the next. For exam ple, in 1985 the consumption of goods and services expressed in PPS (purchasing power standard) was over 11 000 units per capita in Denmark, Germany and Lux embourg, while in Greece and Portugal it was below 6000 units.
In the United States, the level of consumption was much higher (16400 PPS) in the same year, while in Japan (9500 PPS) it was slightly lower than the Commu nity average (9900 PPS).
Government consumption, which includes the production of gen eral services benefiting the popu
16000. PPS 14000.
72000 J,
10 000 8000 6000 4 000-2000