A Type of Combination Forecasting Method Based on Time
Series Method and PLS
*
Liang Wan1, Biao Luo1, Hong-Mei Ji2, Wei-Wei Yan1 1
School of Management, University of Science and Technology of China, Hefei, China 2
School of Business, Anhui University, Hefei, China Email: [email protected]
Received June 17, 2012; revised July 15, 2012; accepted July 30, 2012
ABSTRACT
This paper depends on the panel data of Anhui province and its 17 cities’ cigarette sales. First we established three sin- gle forecasting models (Holter-Wintel Season product model, Time series model decomposing model and Partial least square regression model), after getting the predicted value of cigarette sales from these single models, we then employ the combination forecasting method based on Time Series method and PLS to predict the province and its 17 cities’ cigarette sales of the next year. The results show that the accuracy of prediction is good which could provide a reliable reference to cigarette sales forecasting in Anhui province and its 17 cities.
Keywords: PLS; Time Series Method; Combination Forecast Method; Sales Forecasts
1. Introduction
Although research on the cigarette market in developed countries is already quite mature, but there is few related research on the domestic market. Mao (2003) used the survey data obtained in eight cities and 16 counties to analyze the influence of income level, age, cigarette prices on cigarette consumption; he also estimated the residents’ consumption demand of cigarettes of our na- tional [1]. Xu X., Hu T. and Keeler T. (1998) all used annual data from 1978 to 1992 to analyze the demand for cigarettes of Chinese residents, they have found out the price elasticity range of cigarette consumption demand in China [2]. Chinese Center for Disease Control and Pre- vention (CDC) launched a special investigation in the country’s 30 provinces (municipalities) from March to July in 1996, they analyzed the relationship between gender, age, income level, age, educational background, smoking history, smoking cessation and the cigarette consumption.
To specific prediction methods, as cigarette sales have overall trend volatility and seasonal volatility at the same time, thus its prediction belongs to double trend fore- casting. Against the overall trend volatility, Xi H. (2007) studied domestic cigarettes consumption by factor analy- sis and prospect forecasting; Duan L. D. (2007) studied the different demand for tobacco category of different
income of consumers, he studied from the point of con- sumer’s structure and consumption characteristics; Peter M. L., John S. A., William H. D. [3] and Mao [1] also car- ried out similar studies. Bai Y, Liang Y. L. and Chen X. S. (2007) used the Theil-Batten demand model to analyze the impact of household consumption expenditure, ciga- rette prices and regional differences on demand for ciga- rettes in China [4,5]. Against the seasonal volatility, there are few current studies, for example Sheng H. and Zhou P. used extension clustering prediction method to predict the cigarette sales of a region in Yun’nan province.
In addition, factors that influence cigarette sales in China is various and complicated, prediction research scholars, public health experts and economists mostly use the traditional multivariate statistical methods, when these methods are used in the actual modeling, they will encounter multicollinearity between the various influ- encing factors, and short data series, and other issues, this will largely affected the accuracy of the prediction model [6,7]. As PLS not only can solve the existence of multiple correlation problems in the multiple regression independent variable system, but also can create the re- gression model when the sample size is less than the number of variables. Therefore, in recent studies, It has gradually been accepted and has been applied, for exam- ple, Li W. and Chen H. W. (2009) used PLS to analyze the cigarette consumption data and the main economic factors that influence cigarette consumption in Zhang- zhou city, the results show that the fitting effect of the model and the accuracy of prediction is good [8].
*This paper is founded by the youth science fund projects of the
Single forecasting models all have their own charac- teristics, advantages and disadvantages, when employing any one of them alone, we can only use a certain point of the effective information. Furthermore, single model will also be affected by the model’s set conditions and other factors, therefore, when in predictions, it often demon- strates that the range of information sources is not enough, and the forecasting accuracy is difficult to meet the requirement [9]. The choice of a forecasting method should consider the prediction object, forecasting range, as well as the data and other factors, so we can compre- hensively use the advantages of the single prediction method. In this case, the importance of the combination forecasting method has been put on the agenda. Based on the above discussions, this paper considers the character- istics of double trend (long-term trend factors and sea- sonal factors for cigarette sales), historical sales data and other main factors that affect cigarette sales. Then based on Anhui province and its 17 cities’ cigarette sales panel data, first we established three single forecasting models (PLS, Holter-Winter season product model, time series decomposition model), after getting the predicted value of these single models, we then employ the combination forecasting method to predict the province and its 17 cities’ cigarette sales of the next year, so as to further improve the prediction accuracy.
2. The Principle of PLS
Partial Least Square (PLS) analysis is a new type of mul- tivariate statistical data analysis methods which is ex- tracted from the application field, it was proposed by S. Wold and C. Albano (1983) [10]. This analysis method is mainly applied to linear regression modeling between multi-dependent variables and multi-independent vari- ables, and it can effectively solve many complex prob- lems that an ordinary multiple linear regression cannot solve. S. Wold [11] and Höskuldsson[12] pointed out that it not only can solve the existence of multiple correlation problems in the multiple regression independent variable system, but also can create the regression model when the sample size is less than the number of variables. The PLS regression method is a improvement of the Principal Component Regression (PCR) analysis method, in the process of extracting component, PLS not only takes the information of the independent variables into account, but also incorporates the information of the dependent variables, it also overcomes the adverse effects of multi- collinearity in system modeling, and leading to a more reliable analysis results.
Because this research mainly talks about the prediction of cigarette sales, involving only one dependent variable (cigarette sales), it is necessary to introduce the regres- sion method of single dependent variable of PLS. Given
that the dependent variable is Y and P numbers of inde- pendent variables form the independent variables set
1 2 p
X x , x , , x , first, PLS regression method ex- tracts t1 from the matrix, it is required that it should carry
the variation information in X as far as possible, it should also have a great relevance to Y. If the regression equa- tion has reached a satisfactory accuracy, then the algo- rithm terminates. Otherwise, using the residual informa- tion that X has been explained by t2 and the residual in-
formation that Y has been explained by t1 to do the sec-
ond round of component extraction, so back and forth, until you can reach a satisfactory statistical accuracy. Assuming that we finally extract m components from X, they are t1, t2, ··· , tm, then PLS will establish the regres-
sion between Y and t1, t2, ··· , tm, finally expressed as a
regression equation of Y on the original variable X.
3. Empirical Study
3.1. Data Collection
We obtained Anhui province and its 17 cities’ actual cigarette annual sales data and monthly sales data (Janu- ary 2004 to August 2011) from Anhui province’s To- bacco Monopoly Bureau (company). Before 2004, the tobacco system’s information management is not well organized, sales data was manual recorded and incom- plete, and some data is lost, so the previous data is not used in this study.
To do monthly cigarette sales forecasting, we use a sample of data from January 2004 to December 2010, namely 7 years, a total of 84 samples, and we also use the data from January 2004 to August 2011 to do com- parative analysis.
In the process of using PLS, it will involve many complex factors that affect the sales of cigarettes, in view of authoritative and the availability of data, this research selects the indicators from “Anhui Statistical Yearbook” [13], cities statistical yearbook and bulletins. The indica- tors which we select are specific shown in Table 1.
3.2. Data Processing
To Holter-Winter season product model and time series decomposition method, we use EViews6.0[14] for data processing. To PLS combined model, this study use SPSS16.0 and SIMCA-P12.0 for data processing.
3.2.1. The Forecasting Results of Single Prediction Models
Considering that the forecasting steps of a single predic- tion model are too many, in view of the reasons of space, in this paper, we give the finally prediction effect fitting figure or other core steps of the three single prediction models.
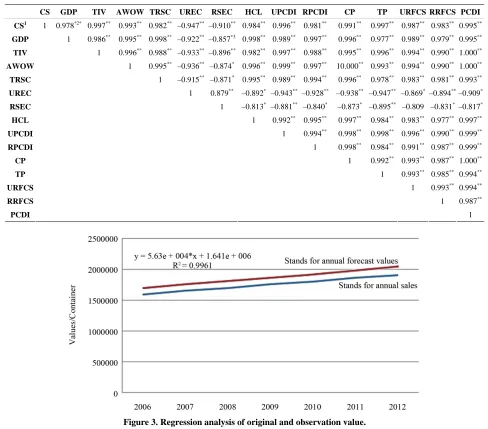
Table 2 is the correlation matrix of Anhui province’s cigarette sales and its influencing factors, in Table 2, we can see that there is a high degree of correlation between the cigarette sales and the influencing factors, and there is also a high degree of linear correlation among the influencing factors, further prove that using PLS for combination forecasting is necessary.
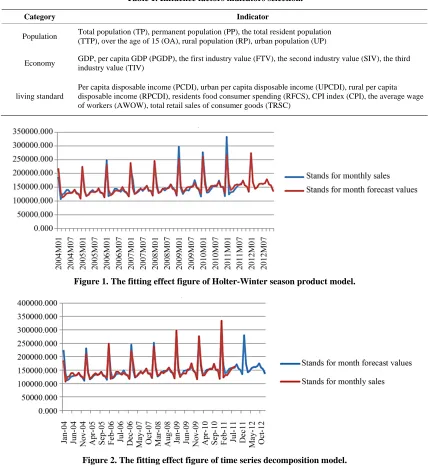
By calculating, the annual forecasting absolute error range of Holter-Winter season product model is between –13223.389 to 827.463, the mean relative error is –0.27%, range between –0.75% to –0.05%, from the Figure 1 we can also make an intuitive judgment that the forecasting results are satisfactory, namely the prediction accuracy of Holter-Winter seasonal product model is good.
[image:3.595.83.513.272.739.2]By calculating, the annual forecasting absolute error range of time series decomposition model is between –14479.355 to 3763.287, the mean relative error is –0.393%, range from –0.853% to 0.202%. From the
Figure 2 we can see that the forecasting results is satis- factory, namely the prediction accuracy of Holter-Winter seasonal product model is good.
By calculating, the annual forecasting absolute error range of PLS is between –7589.495 to 7140.018, the mean relative error is 0.00039%, range from –0.1943% to 0.1708%. From the Figure 3 we can see that the fore- casting results is satisfactory, namely the prediction ac- curacy of PLS is good.
We can see from the above figure that the data points
Table 1. Influence factors indicators selection.
Category Indicator
Population Total population (TP), permanent population (PP), the total resident population (TTP), over the age of 15 (OA), rural population (RP), urban population (UP)
Economy GDP, per capita GDP (PGDP), the first industry value (FTV), the second industry value (SIV), the third industry value (TIV)
living standard
Per capita disposable income (PCDI), urban per capita disposable income (UPCDI), rural per capita disposable income (RPCDI), residents food consumer spending (RFCS), CPI index (CPI), the average wage of workers (AWOW), total retail sales of consumer goods (TRSC)
Figure 1. The fitting effect figure of Holter-Winter season product model.
Table 2. The correlation matrix of the influencing factors.
CS GDP TIV AWOW TRSC UREC RSEC HCL UPCDI RPCDI CP TP URFCS RRFCS PCDI
CS1 1 0.978*2*
0.997** 0.993** 0.982** –0.947** –0.910** 0.984** 0.996** 0.981** 0.991** 0.997** 0.987** 0.983** 0.995**
GDP 1 0.986** 0.995** 0.998** –0.922** –0.857*3 0.998** 0.989** 0.997** 0.996** 0.977** 0.989** 0.979** 0.995**
TIV 1 0.996** 0.988** –0.933** –0.896** 0.982** 0.997** 0.988** 0.995** 0.996** 0.994** 0.990** 1.000**
AWOW 1 0.995** –0.936** –0.874* 0.996** 0.999** 0.997** 10.000** 0.993** 0.994** 0.990** 1.000**
TRSC 1 –0.915** –0.871* 0.995** 0.989** 0.994** 0.996** 0.978** 0.983** 0.981** 0.993**
UREC 1 0.879** –0.892* –0.943** –0.928** –0.938** –0.947** –0.869* –0.894**–0.909*
RSEC 1 –0.813* –0.881** –0.840* –0.873* –0.895** –0.809 –0.831*–0.817*
HCL 1 0.992** 0.995** 0.997** 0.984** 0.983** 0.977** 0.997**
UPCDI 1 0.994** 0.998** 0.998** 0.996** 0.990** 0.999**
RPCDI 1 0.998** 0.984** 0.991** 0.987** 0.999**
CP 1 0.992** 0.993** 0.987** 1.000**
TP 1 0.993** 0.985** 0.994**
URFCS 1 0.993** 0.994**
RRFCS 1 0.987**
[image:4.595.60.539.100.528.2]PCDI 1
Figure 3. Regression analysis of original and observation value.
constituted by predicted values and the original observa- tion values are distributed near the diagonal of the re- gression graph, further calculation shows that the regres- sion coefficient of original observations and predicted values is 0.9961, this indicates that the difference be- tween predicted values and original values is small, the fitting results is good, further demonstrates that the effect of using this model to analyze Anhui province’s cigarette consumption demand is very good, it can greatly improve the prediction accuracy of the cigarette sales of the com- ing year.
3.2.2. Comparing between the Prediction Results of the Three Single Prediction Models
We use Anhui Province Tobacco Company’s sales data from 2004-01 to 2011-08 as the researching object of this study, first we established three single forecasting mod- els to predict the province and its 17 cities’ cigarette sales of the next year. We then employ the combination fore- casting method to predict the province’s cigarette sales of the next year, so as to further improve the prediction ac- curacy. At last, we select the most accurate model’s pre- dicted value as the reference point (three single models, one combination model), we chose two standard devia- tions (SD) as the floating range, then we can get the cigarette sales forecasting range, forecasting results are shown Table 3.
1CS is Cigarette sales, UREC is Urban residents Engel’s coefficient,
RSEC is Rural residents Engel’s coefficient, HCL is Household con-sumption level, CP is Cigarette prices. The meaning of other capital letters please see in the Table 1.
2**In confidence (double measure) of 0.01, the correlation is significant.
3*In confidence (double measure) of 0.05, the correlation is significant. In order to compare the prediction accuracy of the
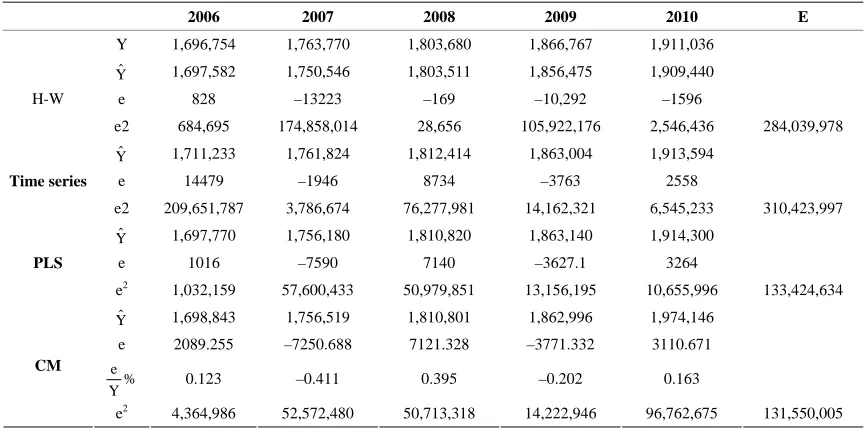
three single prediction models, we use forecast absolute error sum of squares as the index to measure the predic- tion accuracy of the model, prediction error sum of squares is an good indicator of the prediction accuracy, the comparison results of prediction accuracy of the three single forecasting models are shown in Table 4. From the comparison results we can see that compared whit the single forecasting models, the prediction accuracy of the
[image:5.595.82.513.211.452.2]combination model (CM) is higher, PLS’s prediction ac- curacy is close to the combination model, but the time series decomposing model and the Holter-Winter season product model’s accuracy is relatively poor. Thus, the combination prediction method proposed in this study can effectively use the advantages of the single predic- tion model, it has a practical significance to raise the ac- curacy of cigarette prediction.
Table 3. The predicting outcomes of this four models.
Holter-Winter Time series optimize value SD Forecasting range
Anhui 2015369.083 2014774.317 2043645.3 5734.763 2037910.573 - 2049380.063
City 1 210756.914 209398.971 229,675 5225 224450.032 - 234899.968
City 2 173675.1 176574.558 176515.743 303.381 176212.362 - 176819.124
City 3 118289.7 121010.353 115933 1240 114693.019 - 117172.981
City 4 131522.6 136002.425 139962.846 93.553 139869.292 - 140056.399
City 5 126308.6 131114.702 136155.206 504.889 125650.320 - 136660.098
City 6 55415.2 56869.058 57109.137 387.142 56721.995 - 57496.279
City 7 141181.1 141802.204 144,621 721 143900.134 - 145341.866
City 8 239809.3 240267.760 239468.669 67.838 239400.831 - 239536.507
City 9 62334.6 63197.984 62687.583 43.808 62643.775 - 62731.392
City 10 89342.9 89776.245 87,733 811 86921.738 - 88544.262
City 11 54692.5 50526.232 56904.800 643 56262.027 - 57547.573
City 12 168693.1 168236.034 171,319 835 170484.363 - 172153.637
City 13 49680.3 45818.129 48954.229 428.517 48525.712 - 49382.747
City 14 160901.4 160688.771 164,557 1550 163007.121 - 166106.879
City 15 32121.4 32622.881 30050.900 757 29293.746 - 30808.054
City 16 82938.5 81842.536 84976.750 321.654 84655.097 - 85298.404
City 17 98388.3 91120.583 98219.700 639 97581.121 - 98858.279
Table 4. The comparing of this four models.4
2006 2007 2008 2009 2010 E
Y 1,696,754 1,763,770 1,803,680 1,866,767 1,911,036
ˆ Y
ˆ Y
ˆ Y
ˆ Y
1,697,582 1,750,546 1,803,511 1,856,475 1,909,440
e 828 –13223 –169 –10,292 –1596
H-W
e2 684,695 174,858,014 28,656 105,922,176 2,546,436 284,039,978
1,711,233 1,761,824 1,812,414 1,863,004 1,913,594
e 14479 –1946 8734 –3763 2558
Time series
e2 209,651,787 3,786,674 76,277,981 14,162,321 6,545,233 310,423,997
1,697,770 1,756,180 1,810,820 1,863,140 1,914,300
e 1016 –7590 7140 –3627.1 3264
PLS
e2 1,032,159 57,600,433 50,979,851 13,156,195 10,655,996 133,424,634
1,698,843 1,756,519 1,810,801 1,862,996 1,974,146
e 2089.255 –7250.688 7121.328 –3771.332 3110.671
e %
Y 0.123 –0.411 0.395 –0.202 0.163
CM
e2 4,364,986 52,572,480 50,713,318 14,222,946 96,762,675 131,550,005
Y stands for the actual sales for the year; stands for the prediction results; e = Y – Y, stands for absolute error; stands for
the sum of absolute error square.
ˆ
Y ˆ 5 2
t t 1 E
e4
[image:5.595.81.514.480.697.2]4. Conclusions
In this study, we overview the combination forecasting methods and models, on the basis of summing up the achievements of previous studies, this paper presents a new combination forecasting method based on PLS and time series method, and we use it to predict the cigarette sales of Anhui province in 2012. The results here show that, the fitting index between prediction results and ac- tual sales of each single prediction model is good. Com- paring with the single prediction model, the prediction accuracy of the combination forecasting model is im- proved obviously, shows that this method can effectively integrated the information of single forecasting methods, and it is effective and feasible.
Through this study, we can see that the prediction ac-curacy of either single or combination model has reached a high level, Beside this, it should be noted that the ex- pected cigarette sales given in this study is only a refer- ence value, When faced with actual sales tasks, we can- not rely on it completely but should incorporate historical sales information and the expected economic growth of Anhui province to develop an appropriate and reasonable sales target or scheduler.
REFERENCES
[1] Z.-Z. Mao, G.-H. Yang, J.-M. Ma, S. Jon and C. Marion, “Adults’ Demand of Cigarettes and its Influencing Fac-tors in China,” Soft Science of Health, Vol. 17, No. 2, 2003, pp. 19-23.
[2] X. Xu, T. Hu and T. Keeler, “Optimal Cigarette Taxation: Theory and Estimation,” Working Paper, University of California at Berkeley, Berkeley, 1998, pp. 2-15.
[3] P. M. L, J. S. Akin, W. H. Dow, et a1., “Is Cigarette Smoking in Poorer Nations Highly Sensitive to Price,”
Journal of Health Economics, Vol. 23, No. 1, 2004, pp. 173-189. doi:10.1016/j.jhealeco.2003.09.004
[4] Y.-L. Bai, Y.-L. Wu and X.-S. Cheng, “An Analysis of Cigarette Demand in China (I)—Current Status and Model Building,” Acta Tabacaria Sinica, Vol. 13, No. 3, 2007, pp. 6-10.
[5] Y.-L. Bai, Y.-L. Wu and X.-S. Cheng, “An Analysis of Cigarette Demand in China (II)—Demonstration Analysis and Conclusion,” Acta Tabacaria Sinica, Vol. 13, No. 4, 2007, pp. 55-59.
[6] Z.-Y. Hu, J.-J. Wang and C.-Q. Ma, “Empirical Analysis of Impact Factors of Electricity Power Consumption in Hunan Province Based on PLS,” Systems Engineering, Vol. 24, No. 9, 2006, pp. 98-102.
[7] H.-W. Wang, Z.-B. Wu and J. Meng, “The Linear and Nonlinear Method of Partial Least-Square Regression,” National Defence Industry Press, Beijing, 2006.
[8] W. Li, H.-W. Chen, J.-H. Zhou, B.-D. Zhao, Y.-Y. Zhang, H.-Q. Yang, S.-P. Zheng and J. Liu, “Study on the Situa-tion of Cigarettes ConsumpSitua-tion and its Main Affecting Economic Indexes in China—A Case Study on Zhang-zhou in Fujian,” Journal of Fujian Agriculture and For-estry University (Philosophy and Social Sciences), Vol. 12, No. 4, 2009, pp. 46-49.
[9] Z. Xiao and W. Wu, “The Application of Combining Forecasting Based on PSO-PLS to GDP,” Journal of Management Science, Vol. 21, No. 3, 2008, pp. 115-122. [10] S. Wold, C. Albano and M. Dun, “Pattern Regression
Finding and Using Regularities in Multivariate Data,” Analysis Applied Science Publication, London, 1983. [11] S. Wold, C. Albano and M. Dun, “Modelling Data Tables
by Principal Component and PLS: Class Patterns and Quantitative Predictive Relations,” Analysis, Vol. 12, No. 10, 1984, pp. 477-485.
[12] A. Höskuldsson, “A PLS Regression Methods,” Journal of Chemometrics, Vol. 2, No. 3, 1988, pp. 211-228. doi:10.1002/cem.1180020306
[13] National Bureau of Statistics of China, “China Statistics Yearbook 2010,” China Statistics Press, Beijing, 2011. [14] D.-H. Yi, “Data Analysis and EViews Application,”
China Renmin University Press, Beijing, 2008.