http://www.scirp.org/journal/cmb ISSN Online: 2165-3453
ISSN Print: 2165-3445
DOI: 10.4236/cmb.2019.93006 Sep. 2, 2019 63 Computational Molecular Bioscience
DFT Study, Linear and Nonlinear Multiple
Regression in the Prediction of HDAC7
Inhibitory Activities on a Series of
Hydroxamic Acids
Doh Soro1, Lynda Ekou1, Bafétigué Ouattara2, Mamadou Guy-Richard Kone1*, Tchirioua Ekou1, Nahossé Ziao1
1Laboratoire de Thermodynamique et de Physico-Chimie du Milieu, UFR SFA, Université Nangui Abrogoua, Abidjan,
Côte-d’Ivoire
2Laboratoire de Physique Fondamentale et Appliquée, Université Nangui Abrogoua, Côte d’Ivoire
Abstract
In this work, we conducted a QSAR study on 18 molecules using descriptors from the Density Functional Theory (DFT) in order to predict the inhibitory activity of hydroxamic acids on histone deacetylase 7. This study is per-formed using the principal component analysis (PCA) method, the Ascen-dant Hierarchical Classification (AHC), the linear multiple regression me-thod (LMR) and the nonlinear multiple regression (NLMR). DFT calculations were performed to obtain information on the structure and information on the properties on a series of hydroxamic acids compounds studied. Multiva-riate statistical analysis yielded two quantitative models (model MLR and model MNLR) with the quantum descriptors: electronic affinity (AE), vibra-tion frequency of the OH bond (ν(OH)) and that of the NH bond (ν(NH)). The LMR model gives statistically significant results and shows a good pre-dictability R2 = 0.9659, S = 0.488, F = 85 and p-value < 0.0001. Electronic affinity is the priority descriptor in predicting the activity of HDAC7 inhibi-tors in this study. The results obtained suggest that the descripinhibi-tors derived from the DFT could be useful to predict the activity of histone deacetylase 7 inhibitors. These models were evaluated according to the criteria of Tropsha et al.
Keywords
Hydroxamic Acids, Histones Deacetylases, DFT, Histones Deacetylases Inhibitors, QSAR
How to cite this paper: Soro, D., Ekou, L., Ouattara, B., Kone, M.G.-R., Ekou, T. and Ziao, N. (2019) DFT Study, Linear and Nonlinear Multiple Regression in the Pre-diction of HDAC7 Inhibitory Activities on a Series of Hydroxamic Acids. Computa-tional Molecular Bioscience, 9, 63-80.
https://doi.org/10.4236/cmb.2019.93006
Received: June 8, 2019 Accepted: August 29, 2019 Published: September 2, 2019
Copyright © 2019 by author(s) and Scientific Research Publishing Inc. This work is licensed under the Creative Commons Attribution International License (CC BY 4.0).
DOI: 10.4236/cmb.2019.93006 64 Computational Molecular Bioscience
1. Introduction
compa-DOI: 10.4236/cmb.2019.93006 65 Computational Molecular Bioscience nies [11] [12]. This QSAR approach has its origins in the studies carried out by Hansch [13] and by Free and Wilson [14]. In this work, the goal is to conduct a descriptive and predictive study of the anticancer activity of a series of eighteen (18) compounds of HDAC7 inhibitors. By implementing quantum chemistry methods, this work aims at modeling the anticancer activities observed, the mo-lecular descriptors being calculated solely from the chemical structure of the compounds, and subsequently predicting the inhibitory concentration of ana-logous molecules. In the specific case of the QSAR study, twelve (12) histone deacetylase inhibitors (HDACi) were used for the test set and six (6) others from the same series were used for the test. external validation (Table 1). Yao et al.
[15] in their work on the synthesis of hydroxamic acids have determined the ex-perimental inhibitory activities of these inhibitors used in our work. of 38 mole-cules synthesized, only 19 provided satisfactory activity on HDAC7 classified in the following table.
2. Materials and Methods
2.1. Theoretical Calculations
In order to establish a descriptive and predictive theory of the anticancer activity HDAC7 of hydroxamic acids, the methods of Theoretical Chemistry are used at the B3LYP/6-311G (d, p) level. The gradient-corrected functionalities and the hybrid functionals such as B3LYP give better energies and agree with high-level ab initio methods [16] [17]. In this work, to evaluate the quantitative struc-ture-activity relationship between the anticancer activity of HDAC7 and the de-scriptors, the Gaussian 09 [18] quantum chemistry software was used. The base 6-311G (d, p) being sufficiently extended, considering the polarization functions are important for considering the free doublets of the hetero atoms in order to obtain satisfactory results. The modeling was done using the multilinear regres-sion method implemented in Excel spreadsheets [19] and XLSTAT version 2014
[20].
2.2. Chemical Descriptors
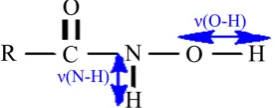
Some physico-chemical descriptors have been used for the development of QSAR models. In particular, the electronic affinity (AE) and the vibration de-scriptors that are the vibration frequency ν (O-H) and the vibration frequency ν (N-H). These two vibration descriptors are shown in Figure 1.
It should be noted that the descriptors related to the molecular frontier orbit-als have been calculated as part of the Koopmans approximation [21]. The LUMO energy characterizes the sensitivity of the molecule to a nucleophilic at-tack. The electronic affinity AE is the descriptor that translates the ability of a molecule to capture an electron. This descriptor is obtained from the relation (1) below:
LUMO
DOI: 10.4236/cmb.2019.93006 66 Computational Molecular Bioscience Figure 1. Vibration descriptors of the hydroxamic
[image:4.595.57.537.198.628.2]acids used ν(O-H) and ν(N-H).
Table 1. Molecular structures of test sets and validation of hydroxamic acids used for QSAR models.
Training set
Code Code
1 N N
O NHOH
PhO 11 N N
O NHOH
2 N N
O NHOH O
O 12 N N
O NHOH 5 Ph N N O H N
OH 14 N N
O NHOH O2N
7 N N O NHOH 15 Ph N N O NHOH
9 N N
O
NHOH 17
Ph
N N NHOH
O
10 N N
O NHOH
18 N N
O NHOH F F 19 N N O NHOH N O Validation set
Code Code
3 N N
O NHOH PhO 8 Ph N N O N H OH
4 N N
O NHOH
PhHN 13 N
H O
NHOH
O
6 N N
O NHOH Cl
F
16 N N
O NHOH
Several studies have shown that geometric descriptors provide better models as well as global responsivity descriptors [22] [23] [24].
2.3. Statistical Analyzes 2.3.1. Data Analysis
DOI: 10.4236/cmb.2019.93006 67 Computational Molecular Bioscience methods based on Principal Component Analysis (PCA) [25] [26] [27] using the software XLSTAT version 2014 [20] to determine the descriptors that are related. direct with anticancer activity. PCA is a useful statistical technique for summa-rizing all the information encoded in the structures of the compounds. It is also very useful for understanding the distribution of compounds and for selecting descriptors that are directly related to biological activity [28]. It is an essentially descriptive statistical method that aims to present, in graphical form, the maxi-mum information of physicochemical descriptors. The Ascendant Hierarchical Classification (AHC) aims to partition a set of molecules into homogeneous classes [29]. It organizes molecules, defined by several variables and modalities, by grouping them hierarchically on a dendrogram. It aggregates those that are most like each other by using dissimilarity or distance measurements between molecules to form classes. It is made from the data of molecules and descriptors. AHC has established a typology of molecules based on electronic affinity (AE) and vibration frequencies ν(O-H) and ν(N-H).
2.3.2. Multiple Linear and Nonlinear Regressions (MLR and NMR)
The Multiple Linear Regression (MLR) statistical technique is used to study the relationship between a dependent variable (Biological activity) and several inde-pendent variables (descriptors). This statistical method minimizes the differenc-es between the actual and predicted valudifferenc-es.
It also allowed to select the descriptors used as input parameters in nonlinear multiple regression (NMR).
Nonlinear multiple regression (NMR) analysis is a technique that improves the structure-activity relationship to quantitatively evaluate biological activity. It considers several parameters. It is the most common tool for studying multidi-mensional data. It is based on preprogrammed XLSTAT functions as follows:
(
1 2 3 4) (
12 22 32 42)
y= +a bx +cx +dx +ex + fx +gx +hx +ix (2)
where a b c d, , , ,: are the parameters and x x x x1, 2, 3, 4,: are the variables. The (MLR) and the (NRM) were generated using the XLSTAT software ver-sion 2014 [20] to predict the anticancer activity IC50 HDAC7. The equations of the different models were evaluated by the coefficient of determination (R2), the mean squared error (S), the Fischer test (F) and the cross-correlation coefficient ( 2
CV
Q ) [30] [31].
The potential of the inhibitory concentration is calculated according to the following expression:
(
6)
50 50
pIC = −log IC ∗10− (3)
2.4. Estimation of the Predictive Capacity of a Model
statistic-DOI: 10.4236/cmb.2019.93006 68 Computational Molecular Bioscience al analysis criteria including the coefficient of determination R2, the standard deviation S, the correlation coefficients of the cross validation 2
CV
Q and Fischer
F. R2, S and F relate to the adjustment of calculated and experimental values. They describe the predictive ability within the limits of the model and make it possible to estimate the accuracy of the values calculated on the test set [32] [33]. As for the cross-validation coefficient 2
CV
Q , it gives information on the
predic-tive power of the model. This predicpredic-tive power is called “internal” because it is calculated from the structures used to build this model. The correlation coeffi-cient R2 gives an evaluation of the dispersion of the theoretical values around the experimental values. The quality of the modeling is better when the points are close to the adjustment line [34]. The adjustment of points to this line can be evaluated by the coefficient of determination.
(
)
(
)
2 , , 2 2 , ,1 i exp i theo
i exp i exp
y y R y y − = − −
∑
∑
(4)where:
,
i exp
y : Experimental value of anticancer activity,
,
i theo
y : Theoretical value of anticancer activity and,
,
i exp
y : Mean value of the experimental values of the anticancer activity. The more the value of R2 will be close to 1, the more the theoretical and expe-rimental values are correlated.
Moreover, the variance σ2
is determined by the relation 4:
(
)
2, ,
2 2
1
i exp i theo
y y
s
n k
σ = = −
− −
∑
(5)
where k is the number of independent variables (descriptors), n is the number of molecules in the test or learning set, and n k− −1 is the degree of freedom.
The standard deviation or standard deviation S is another statistical indicator used. It allows to evaluate the reliability and the precision of a model:
(
)
2, ,
1
i exp i theo
y y s n k − = − −
∑
(6)The Fisher F test is also used to measure the level of statistical significance of the model, that is, the quality of the choice of descriptors constituting the model.
(
)
(
)
2 , , 2 , , 1 i theo i expi exp i theo
y y n k
F k y y − − − = ∗ −
∑
∑
(7)The coefficient of determination of the cross-validation 2
CV
Q makes it
possi-ble to evaluate the accuracy of the prediction on the test set. It is calculated using the following relation:
(
)
(
)
(
)
2 2 , , , , 2 2 , ,i theo i exp i theo i exp cv
i theo i exp
y y y y
Q y y − − − = −
∑
∑
DOI: 10.4236/cmb.2019.93006 69 Computational Molecular Bioscience 2.5. Criterion for Acceptance of a QSAR Model
According to Eriksson et al. [35] [36], The performance of a mathematical mod-el is characterized by a value of 2
0.5
cv
Q > for a satisfactory model when for the
excellent model 2 0.9
cv
Q > . According to them, given a test game, a model will be
efficient if the acceptance criterion 2 2 0.3
cv
R −Q < is respected.
According to Tropsha et al. [37] [38] [39], for the external validation set, the predictive power of a model can be obtained from five criteria. These criteria are:
1) 2 0.7
Test
R > , 2) 2
0.6
Cv Test
Q > , 3) RTest2 −R02 ≤0.3,
4)
2 2
0
2 0.1
Test
Test
R R
R
−
< and 0.85≤ ≤k 1.15, 5)
2 2
0
2 0.1
Test
Test
R R
R
′ −
< and
0.85≤ ≤k′ 1.15
2.6. Applicability Domain
The applicability domain principle helps modelers to specify the scope of pro-posed models, thereby defining the model’s limitations with respect to its struc-tural domain and chemical space. If an external compound exceeds the defined scope of a model, it is outside the applicability domain of that model and cannot be associated with reliable prediction. There are several methods for determining the applicability domain of a QSAR model, among which we find the lever me-thod that is used the most. If a compound has a residual and a lever that exceeds the threshold h* = 3p/n (where p is the number of descriptors plus 1 and n the number of observations), this compound is considered outside the field of ap-plicability of the elaborate model. The field of apap-plicability will be discussed us-ing the Williams diagram which represents the standardized prediction residuals as a function of the values of the hi levers [40]. For each compound i in the original space of the independent variables (Xi), the value of hi is calculated by the following relation [41]:
(
)
1T T
i i i
h =X X X − X (9)
where i=
(
1,,n)
With: Xi is the line vector of the descriptors of the compound i, X (n * k − 1) is the matrix of the model deduced from the values of the descriptors of the train-ing set; the index T designates the transposed matrix of the matrix. The critical value of the lever (h*) is set [42] to:
(
)
* 3 k 1 h
n
+ =
With n, the number of test compounds used; k is the number of the descrip-tors of the model.
DOI: 10.4236/cmb.2019.93006 70 Computational Molecular Bioscience aberrant, the residues being low [43].
3. Results and Discussion
[image:8.595.210.538.313.712.2]The set of descriptor values of the thirteen (13) hydroxamic acid molecules of the test set and the six (6) other molecules of the validation set are presented in
Table 2.
3.1. Principal Component Analysis (PCA) and Ascendant Hierarchical Classification (AHC)
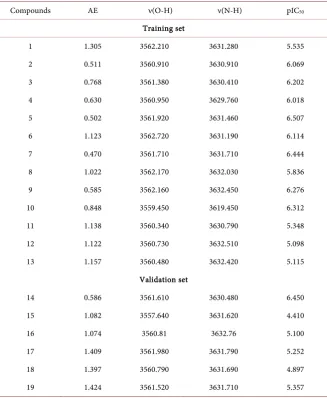
All three descriptors for the 19 hydroxamic acid compounds are subjected to the PCA analysis. The two main axes are enough to describe the information pro-vided by the data matrix. The correlations between the three descriptors are presented in Table 3 according to a correlation matrix and in Figure 2 where these descriptors are represented in a correlation circle.
Table 2. Experimental quantum and potential descriptors of test and validation sets.
Compounds AE ν(O-H) ν(N-H) pIC50
Training set
1 1.305 3562.210 3631.280 5.535
2 0.511 3560.910 3630.910 6.069
3 0.768 3561.380 3630.410 6.202
4 0.630 3560.950 3629.760 6.018
5 0.502 3561.920 3631.460 6.507
6 1.123 3562.720 3631.190 6.114
7 0.470 3561.710 3631.710 6.444
8 1.022 3562.170 3632.030 5.836
9 0.585 3562.160 3632.450 6.276
10 0.848 3559.450 3619.450 6.312
11 1.138 3560.340 3630.790 5.348
12 1.122 3560.730 3632.510 5.098
13 1.157 3560.480 3632.420 5.115
Validation set
14 0.586 3561.610 3630.480 6.450
15 1.082 3557.640 3631.620 4.410
16 1.074 3560.81 3632.76 5.100
17 1.409 3561.980 3631.790 5.252
18 1.397 3560.790 3631.690 4.897
19 1.424 3561.520 3631.710 5.357
DOI: 10.4236/cmb.2019.93006 71 Computational Molecular Bioscience Table 3. Correlation matrix (Pearson (n)) between the different descriptors.
Variables AE ν(O-H) ν(N-H) pIC50
AE 1
ν(O-H) 0.0917 1
ν(N-H) −0.1845 −0.6225 1
pIC50 −0.9264 −0.1242 −0.0209 1
Bold values are different from 0 to a significant level for p < 0.05. Very significant for p < 0.01. Very signifi-cant for p < 0.001.
Figure 2. Correlation Circle descriptors and the explained variable.
The two main axes are enough to characterize the different descriptors. In fact, the variance percentages are 50.51% and 33.49% for the F1 and F2 axes, respec-tively. The total information is estimated at 85%. Principal Component Analysis (PCA) [29] was conducted to identify the link between the different descriptors. Bold values are different from 0 at a significance level of p = 0.05.
The matrix obtained provides information on the negative or positive correla-tion between the variables. The Pearson correlacorrela-tion coefficients are summarized in Table 3. The resulting matrix provides information on the negative or posi-tive correlation between the variables.
The correlation circle was made to detect the connection between the different descriptors. The analysis of the principal components from the correlation circle (Figure 2) revealed that the F1 axis (50.51% of the variance) seems to represent the vibration frequencies ν (OH) and ν (NH), and the axis F2 (33.49% of the va-riance) seems to represent the electronic affinity AE.
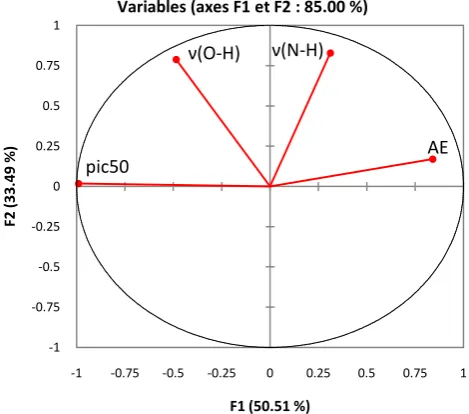
The AHC of Figure 3 distributes the iHDAC7 in two classes according to the affinity of one compound to another. The two major classes consist of com-pounds as follows: C1 (1, 2, 3, 4, 5, 6, 7, 8, 9, 10, 14, 17) and C2 (11, 12, 13, 15, 16, 18, 19).
pic50 AE
ν(O-H) ν(N-H)
-1 -0.75 -0.5 -0.25 0 0.25 0.5 0.75 1
-1 -0.75 -0.5 -0.25 0 0.25 0.5 0.75 1
F2
(3
3.
49
%
)
F1 (50.51 %)
[image:9.595.255.490.215.422.2]DOI: 10.4236/cmb.2019.93006 72 Computational Molecular Bioscience Figure 3. Dendrogram of the partition hierarchy of the 19 hydroxamic acids for 3 homogeneous classes.
3.2. Prediction of HDAC7 Anti-Cancer Activity from MLR and NMR Models
The equations of the QSAR models obtained for cancer activity from MLR and NMR as well as the statistical indicators are given in Table 4. It should be em-phasized that these models were established using the same test and validation
Table 3.
The equations of the different models are obtained by using three descriptors (AE, ν(O-H) and ν(N-H)) determined from the optimized molecules. It is im-portant to note that the negative or positive sign of a model descriptor coeffi-cient reflects the proportionality effect between the evolution of the biological activity and this parameter of the MLR model equation. Thus, the negative sign indicates that when the value of the descriptor is high, the biological activity de-creases while the positive sign reflects the opposite effect. For the MLR model, the negative signs of the coefficients of the three descriptors (AE, ν(O-H) and ν(N-H)) indicate that the HDAC7 activity will be improved for low values of these descriptors. The study of the significance of these different models is led by the evaluation of the statistical indicators and by the acceptance criteria of Erickson et al. and Tropsha et al. The values of the statistical indicators deter-mined for each model are reported in Table 5. The values of the statistical indi-cators listed in this table reflect a good correlation of the inhibitory activity on HDAC7 with the different descriptors.
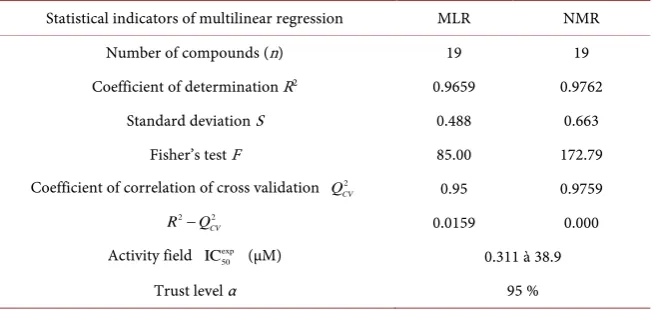
In these respective models (MLR and NMR), 96.56% and 97.62% of the de-scriptors (AE, ν(O-H) and ν(N-H)) are considered with the standard deviation S of prediction from 0.488 to 0.663. The significance of these models is given by the Fischer F test, 85.00 to 172.79 respectively for the MLR and NMR. The cor-relation coefficient of the cross-validation 2
CV
Q is 0.918 to 0.938 respectively for
the RMNL and RML models. These values reflect excellent models according to Erikson et al. [35] [36]. These models are also acceptable because they agree with the acceptance criteria of these authors: 2 2
0.3
CV
R −Q <
DOI: 10.4236/cmb.2019.93006 73 Computational Molecular Bioscience Table 4. Most Significant QSAR Models for Modeling HDAC7 Activity from MLR and NMR.
Regression equations
MRL pred ( ) ( )
50 902.89167 1.16813 AE 0.35349 O-H 0.09615
N-pIC = − − ∗ + ∗ν − ∗ν H
NMR ( ) ( ) ( ) ( )
pred 50
2 2
2
186539 1.27488 AE 121.60150 O-H 16.283 pIC
0.03043 AE 0.01712
51 N-H O-H 0.00226 N-H
ν ν
ν ν
= − ∗ − ∗
−
∗ ∗ ∗
+
+ ∗
[image:11.595.213.540.203.358.2]+
Table 5. Statistical indicators of multilinear regression.
Statistical indicators of multilinear regression MLR NMR Number of compounds (n) 19 19 Coefficient of determination R2 0.9659 0.9762
Standard deviation S 0.488 0.663 Fisher’s test F 85.00 172.79 Coefficient of correlation of cross validation 2
CV
Q 0.95 0.9759
2 2
CV
R −Q 0.0159 0.000
Activity field exp 50
IC (µM) 0.311 à 38.9
Trust level α 95 %
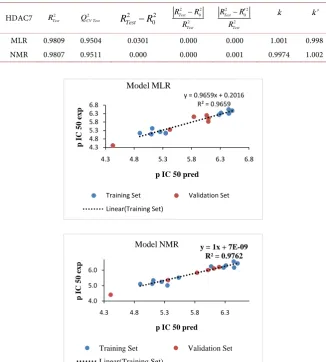
The regression line between the experimental and theoretical nematocidal po-tentials of the test set and the validation set is illustrated in Figure 4. This figure illustrates the correlation between the experimental and theoretical IC50 inhibi-tion concentrainhibi-tions of the test set (blue dots) and the validainhibi-tion game (red dots). These models obtained relate the HDAC7 activity and the theoretical descriptors of hydroxamic acids.
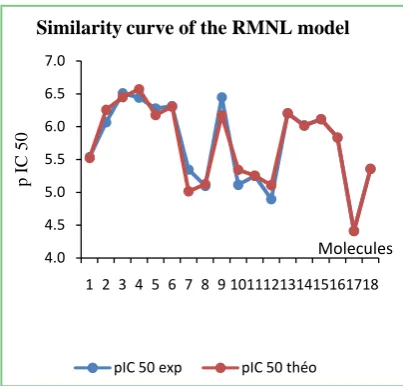
The low values of the standard error of 0.448 to 0.663 respectively of the NMR and RML models attest to the good similarity between the predicted and expe-rimental values of the HDAC7 activity despite some differences recorded (Figure 5).
Verification of Tropsha Criteria
The statistical indicators of the five (5) Tropsha criteria of these two models (MLR and NMR) of the validation set are given in Table 6.
2 0.7
Test
R > , 2
0.6
Cv Test
Q > , RTest2 −R02 ≤0.3
2 2
0
2 0.1
Test
Test
R R
R
−
< and 0.85≤ ≤k 1.15;
2 2
0
2 0.1
Test
Test
R R
R
′ −
< and
0.85≤ ≤k′ 1.15
All values meet the Tropsha criteria, so these models are acceptable for pre-dicting HDAC7 anticancer activity.
DOI: 10.4236/cmb.2019.93006 74 Computational Molecular Bioscience various descriptors and to define the choice of the parameters to be optimized for the realization of a better activity HDAC7.
Table 6. Tropsha criteria for different models.
HDAC7 2 Test
R 2
CV Test
Q 2 2
0
Test
R −R
2 2 0 2 Test
Test
R R
R
− 2 2
0 2 Test
Test
R R
R
′
− k k’
MLR 0.9809 0.9504 0.0301 0.000 0.000 1.001 0.998 NMR 0.9807 0.9511 0.000 0.000 0.001 0.9974 1.002
Figure 4. Regression lines of the different models (MLR and NMR).
y = 0.9659x + 0.2016 R² = 0.9659
4.3 4.8 5.3 5.8 6.3 6.8
4.3 4.8 5.3 5.8 6.3 6.8
p I
C
5
0
e
x
p
p IC 50 pred
Model MLR
Training Set Validation Set
Linear(Training Set)
y = 1x + 7E-09 R² = 0.9762
4.0 5.0 6.0
4.3 4.8 5.3 5.8 6.3
p I
C
5
0
e
x
p
p IC 50 pred
Model NMR
Training Set Validation Set
Linear(Training Set)
4.3 4.8 5.3 5.8 6.3 6.8
1 2 3 4 5 6 7 8 9 101112131415161718
p I
C
50
Molecules
Similarity curve of the MLR model
[image:12.595.210.537.131.494.2]DOI: 10.4236/cmb.2019.93006 75 Computational Molecular Bioscience Figure 5. Similarity curve of the experimental and
predicted values of the RML and NMR models.
3.3. Analysis of the Contribution of Descriptors
The contribution of the four descriptors of this model in the prediction of the anticancer activity HDAC7 of the hydroxamic acids was determined from the software XLSTAT version 2014 [20]. The different contributions are illustrated in Figure 6.
In this study, the electronic affinity (AE) has a nearly identical weight as the vibration frequencies ν(O-H) and ν(N-H). The absence of one of these descrip-tors in the model could destabilize this one. It should be noted that these quan-tum descriptors in a global way make a rather important contribution in the prediction of the anticancer activity of HDAC7.
3.4. Applicability Domain Analysis
The values of leverage and standardized residuals of the observables of the model used to develop the applicability domain of this model are shown in Table 7.
Analysis of the data in Table 7 shows that all other observations have their standardized residuals between −1.5 and 1.5. The lifts obtained are all below the critical value *
0.923
h = . This fact is elucidated by the Williams diagram (Figure 7). The results of the external validation and the domain of applicability show that the established model can be used reliably for the prediction of the in-hibitory concentration of future hydroxamic acids.
4. Conclusion
In this work, the anticancer activity HDAC7 of nineteen (19) hydroxamic acid compounds was correlated with the theoretical descriptors calculated by the DFT methods. The descriptors electronic affinity (AE), vibration frequencies ν(N-H) and ν(O-H) can explain and predict the anticancer activity HDAC7. Sta-tistical methods such as Principal Component Analysis (PCA), Ascending Hie-rarchical Classification (AHC), Multilinear and Nonlinear Regression were used.
4.0 4.5 5.0 5.5 6.0 6.5 7.0
1 2 3 4 5 6 7 8 9 101112131415161718
p I
C
50
Molecules
Similarity curve of the RMNL model
DOI: 10.4236/cmb.2019.93006 76 Computational Molecular Bioscience Figure 6. Contribution of descriptors in models.
Figure 7. Williams diagram of the MLR model.
Table 7. Values of the levers and residuals of observations of the model.
Compounds pIC50-exp Pred (pic50) Residu Residu std. hii 1 5.535 5.633 −0.098 −0.942 0.38 2 6.069 6.136 −0.068 −0.653 0.24
3 6.202 6.050 0.152 1.460 0.09
4 6.018 6.123 −0.105 −1.008 0.14
5 6.507 6.451 0.056 0.540 0.23
6 6.114 6.034 0.079 0.760 0.42
7 6.444 6.390 0.053 0.514 0.24
8 5.836 5.877 −0.042 −0.399 0.18 9 6.276 6.343 −0.068 −0.651 0.21 10 6.312 6.329 −0.017 −0.159 0.92
11 5.348 5.214 0.134 1.285 0.29
12 5.098 5.205 −0.107 −1.032 0.28
13 5.115 5.085 0.030 0.285 0.36
-0.714
0.678
-0.674
-1 -0.8 -0.6 -0.4 -0.2 0 0.2 0.4 0.6 0.8 1
St
an
da
rd
iz
ed
co
ef
fic
ien
ts
Variables
pIC50 / standardized coefficients (Int. de conf. 95%)
AE ν(O-H) ν(N-H)
-1.50 -1.00 -0.50 0.00 0.50 1.00 1.50 2.00
0.00 0.20 0.40 0.60 0.80 1.00
h*=923
[image:14.595.209.539.484.726.2]DOI: 10.4236/cmb.2019.93006 77 Computational Molecular Bioscience Two QSAR models (MLR, NMR) showed that the descriptors used would pre-dict, at an acceptable level of confidence, the inhibitory activity of hydroxamic acids. The use of two different methods in this work was to show on the one hand that from these descriptors, we can predict in a different way the inhibitory activity of hydroxamic acids on HDAC7 and on the other hand, the relevance has these descriptors. However, the MLR model (R2 = 0.9659, S = 0.488, F = 85 and p-value < 0.0001) is an effective tool for predicting HDAC7 anticancer ac-tivity. Moreover, the study of the contribution of the descriptors showed that these descriptors are almost equivalent in the prediction of the inhibitory activity of the HDACi7 studied. For this model, the future compounds must have their standardized residue between −1.5 and +1.5 with a threshold lever h* = 0.923. A study of the applicability domain of these models is envisaged. From the field of applicability and quantum descriptors elaborated in this work, we plan to pro-pose new molecules with improved activities.
Conflicts of Interest
The authors declare no conflicts of interest regarding the publication of this paper.
References
[1] Yoon, S. and Eom, G.H. (2016) HDAC and HDAC Inhibitor: From Cancer to Car-diovascular Diseases. Chonnam Medical Journal, 52, 1-12.
https://doi.org/10.4068/cmj.2016.52.1.1
[2] Witt, O., Deubzer, H.E., Milde, T. and Oehme, I. (2009) HDAC Family: What Are the Cancer Relevant Targets? Cancer Letters, 277, 8-21.
https://doi.org/10.1016/j.canlet.2008.08.016
[3] Micelli, C. and Rastelli, G. (2015) Histone Deacetylases: Structural Determinants of Inhibitor Selectivity. Drug Discovery Today, 20, 718-735.
https://doi.org/10.1016/j.drudis.2015.01.007
[4] Haberland, M., Montgomery, R.L. and Olson, E.N. (2009) The Many Roles of His-tone Deacetylases in Development and Physiology: Implications for Disease and Therapy. Nature Reviews Genetics, 10, 32-42.https://doi.org/10.1038/nrg2485
[5] Zhang, C.L., McKinsey, T.A., Chang, S., Antos, C.L., Hill, J.A. and Olson, E.N. (2002) Class II Histone Deacetylases Act as Signal-Responsive Repressors of Cardiac Hypertrophy. Cell, 110, 479-488.https://doi.org/10.1016/S0092-8674(02)00861-9
[6] Vega, R.B., et al. (2004) Histone Deacetylase 4 Controls Chondrocyte Hypertrophy during Skeletogenesis. Cell, 119, 555-566.https://doi.org/10.1016/j.cell.2004.10.024
[7] Chang, S., Young, B.D., Li, S., Qi, X., Richardson, J.A. and Olson, E.N. (2006) His-tone Deacetylase 7 Maintains Vascular Integrity by Repressing Matrix Metallopro-teinase 10. Cell, 126, 321-334.https://doi.org/10.1016/j.cell.2006.05.040
[8] Jones, P., et al. (2008) Probing the Elusive Catalytic Activity of Vertebrate Class IIa Histone Deacetylases. Bioorganic & Medicinal Chemistry Letters, 18, 1814-1819.
https://doi.org/10.1016/j.bmcl.2008.02.025
DOI: 10.4236/cmb.2019.93006 78 Computational Molecular Bioscience
[10] Witt, A.E., et al. (2017) Identification of a Cancer Stem Cell-Specific Function for the Histone Deacetylases, HDAC1 and HDAC7, in Breast and Ovarian Cancer.
Oncogene, 36, 1707-1720.https://doi.org/10.1038/onc.2016.337
[11] Parra, M. (2015) Class IIa HDACs—New Insights into Their Functions in Physiol-ogy and PatholPhysiol-ogy. The FEBS Journal, 282, 1736-1744.
https://doi.org/10.1111/febs.13061
[12] Ouaïssi, M., Giger, U., Sielezneff, I., Pirrò, N., Sastre, B. and Ouaissi, A. (2011) Ra-tionale for Possible Targeting of Histone Deacetylase Signaling in Cancer Diseases with a Special Reference to Pancreatic Cancer. Journal of Biomedicine and Bio-technology, 2011, Article ID 315939. https://doi.org/10.1155/2011/315939
[13] Barneda-Zahonero, B., et al., (2015) The Transcriptional Repressor HDAC7 Pro-motes Apoptosis and c-Myc Downregulation in Particular Types of Leukemia and Lymphoma. Cell Death & Disease, 6, 16-35.
https://doi.org/10.1038/cddis.2014.594
[14] Lei, Y., et al. (2017) Hdac7 Promotes Lung Tumorigenesis by Inhibiting Stat3 Acti-vation. Molecular Cancer, 16, 170.https://doi.org/10.1186/s12943-017-0736-2
[15] Yao, Y., Liao, C.Z., Li, Z., Wang, Z., et al. (2014) Design, Synthesis, and Biological Evaluation of 1,3-Disubstituted-Pyrazole Derivatives as New Class I and IIb Histone Deacetylase Inhibitors. European Journal of Medicinal Chemistry, 86, 639-652.
https://doi.org/10.1016/j.ejmech.2014.09.024
[16] Kapp, J., Remko, M. and Schleyer, P.V.R. (1996) H2XO and (CH3)2XO Compounds
(X = C, Si, Ge, Sn, Pb): Double Bonds vs Carbene-Like Structures Can the Metal Compounds Exist at All? Journal of the American Chemical Society, 118, 5745-5751.
https://doi.org/10.1021/ja953846p
[17] Johnson, B.G., Gill, P.M. and Pople, J.A. (1993) The Performance of a Family of Density Functional Methods. The Journal of Chemical Physics, 98, 5612-5626.
https://doi.org/10.1063/1.464906
[18] Frisch, M., Trucks, G., Schlegel, H. and Scuseria, G. (2009) Gaussian 09, Revision C.01. Gaussian Inc., Wallingford.
[19] Microsoft Excel (2013) (15.0.4420.1017) MSO (15.0.4420.1017) 64 Bits Partie de Microsoft Office Professionnel Plus.
[20] XLSTAT (2014) Version 2014.5.03 Copyright Addinsoft 1995-2014 XLSTAT and Addinsoft Are Registered Trademarks of Addinsoft. https://www.xlstat.com [21] Koopmans, T. (1934) Úber die Zuordnung von Wellenfunktiomen und
Eigenwer-ten zu den einzelnen Elektronen eines Atoms. Physica, 1, 104-113.
https://doi.org/10.1016/S0031-8914(34)90011-2
[22] Balaban, A.T. (1997) From Chemical Topology to Three-Dimensional Geometry. Plenum Press, New York, 1-24.
[23] Randic, M. and Razinger, M. (1995) Molecular Topographic Indices. The Journal for Chemical Information and Computer Scientists, 35, 140-147.
https://doi.org/10.1021/ci00023a021
[24] Rastija, V. and Medic-Š., M. (2009) QSAR Modeling of Anthocyanins, Anthocyani-dins and Catechins as Inhibitors of Lipid Peroxidation Using Three-Dimensional Descriptors. Medicinal Chemistry Research, 18, 579-588.
https://doi.org/10.1007/s00044-008-9151-y
DOI: 10.4236/cmb.2019.93006 79 Computational Molecular Bioscience
[26] Traoré, Y., Koné, M.G.-R., Ouattara, O. and Ziao, N. (2018) Qsar Approach to Es-timating the Analgesic Activity of a Serie of Tri-Substituted Pyrimidine Derivatives.
Journal of Computational Chemistry & Molecular Modelling, 2, 1-14.
[27] Kpidi, Y.H., Yapo, O.B., Koné, M.G.-R., Gadji, G.A., Gnagne, A.E.J.E.Y., N’dri, J. and Ziao, S.N. (2018) Monitoring and Modeling of Chlorophyll-a Dynamics in a Eutrophic Lake: M’koa Lake (Jacqueville, Ivory Coast). American Journal of Envi-ronmental Protection, 6, 1-9. https://doi.org/10.12691/env-6-1-1
[28] Hmamouchi, R., Taghki, A.I., Larif, M., Adad, A., Abdellaoui, A., Bouachrine, M. and Lakhlifi, T. (2013) The Inhibitory Activity of Aldose Reductase of Flavonoid Compounds: Combining DFT and QSAR Calculations. Journal of Chemical and Pharmaceutical Research, 5, 198-209.
[29] Escofier, B. and Pagès, J. (2008) Analyses factorielles simples et multiples: Objectifs, méthodes et interprétation. Dunod, Paris.
[30] Rücker, C., Rücker, G. and Meringer, M. (2007) y-Randomization and Its Variants in QSPR/QSAR. Journal of Chemical Information and Modeling, 47, 2345-2357.
https://doi.org/10.1021/ci700157b
[31] N’guessan, K.N., Koné, M.G.-R., Bamba, K., Ouattara, W.P. and Ziao, N. (2017) Quantitative Structure Anti-Cancer Activity Relationship (QSAR) of a Series of Ruthenium Complex Azopyridine by the Density Functional Theory (DFT) Me-thod. Computational Molecular Bioscience, 7, 19-31.
https://doi.org/10.4236/cmb.2017.72002
[32] Snedecor, G.W. and Cochran, W.G. (1967) Methods, Statistical. Oxford and IBH, New Delhi, 381.
[33] Kangah, N.J.-B., Koné, M.G.-R., Kodjo, C.G., N’guessan, B.R., Kablan, A.L.C., Yéo, S.A. and Ziao, N. (2017) Antibacterial Activity of Schiff Bases Derived from Ortho Diaminocyclohexane, Meta-Phenylenediamine and 1,6-Diaminohexane: Qsar Study with Quantum Descriptors. International Journal of Pharmaceutical Science Inven-tion, 6, 38-43.
[34] Esposito, E.X., Hopfinger, A.J. and Madura, J.D. (2004) Methods for Applying the Quantitative Structure-Activity Relationship Paradigm. Methods in Molecular Bi-ology, 275, 131-213. https://doi.org/10.1385/1-59259-802-1:131
[35] Eriksson, L., Jaworska, J., Worth, A., Cronin, M.D., Dowell, R.M.M. and Gramatica, P. (2003) Methods for Reliability and Uncertainty Assessment and for Applicability Evaluations of Classification- and Regression-Based QSARs. Environmental Health Perspectives, 111, 1361-1375. https://doi.org/10.1289/ehp.5758
[36] N’Dri, J.S., Koné, M.G.-R., Kodjo, C.G., Affi, S.T., Kablan, A.L.C., Ouattara, O., Soro, D. and Ziao, N. (2017) Relation Quantitative Structure Activité (QSAR) d’une série d’azetidinones dérivés de Dapsone par la méthode de Théorie de la fonctionnelle de la densité(DFT). International Journal of Applied Sciences, 8, 55-62.
https://doi.org/10.21013/jas.v8.n2.p2
[37] Golbraikh, A. and Tropsha, A. (2002) Beware of QSAR. Journal of Molecular Graphics and Modelling, 20, 269-276.
https://doi.org/10.1016/S1093-3263(01)00123-1
[38] Ouattara, O., Koné, M.G-R., Affi, T.S., Bamba, K., Traore, Y. and Ziao, N. (2018) Contribution to the Molecular Lipophilicity Scale by Qspr Models of Lipophilicity Prediction. Journal of Engineering Research and Application, 8, 55-61.
Investiga-DOI: 10.4236/cmb.2019.93006 80 Computational Molecular Bioscience
tion. International Journal of Engineering Research and Applications, 7, 50-56.
https://doi.org/10.9790/9622-0705015056
[40] Sahigara, F., et al. (2012) Comparison of Different Approaches to Define the Appli-cability Domain of QSAR Models. Molecules, 17, 4791-4810.
https://doi.org/10.3390/molecules17054791
[41] Tropsha, A., Gramatica, P. and Gombar, V.K. (2003) The Importance of Being Earnest, Validation Is the Absolute Essential for Successful Application and Inter-pretation of QSPR Models. QSAR & Combinatorial Science, 22, 69-77.
https://doi.org/10.1002/qsar.200390007
[42] Netzeva, T.I., et al. (2005) Current Status of Methods for Defining the Applicability Domain of (Quantitative) Structure-Activity Relationships. The Report and Rec-ommendations of ECVAM Workshop 52. Alternatives to Laboratory Animals, 33, 155-173.https://doi.org/10.1177/026119290503300209