ORIGINAL RESEARCH
HEAD & NECK
MR Imaging–Based Evaluations of Olfactory Bulb Atrophy in
Patients with Olfactory Dysfunction
X M.S. Chung,XW.R. Choi,XH.-Y. Jeong,XJ.H. Lee, andXJ.H. Kim
ABSTRACT
BACKGROUND AND PURPOSE: Although the olfactory bulb volume as assessed with MR imaging is known to reflect olfactory function, it is not always measured during olfactory pathway assessments in clinical settings. We aimed to evaluate the utility of visual olfactory bulb atrophy and neuropathy analyses using MR imaging in patients with olfactory dysfunction.
MATERIALS AND METHODS: Thirty-four patients who presented with subjective olfactory loss between March 2016 and February 2017 were included. Patients underwent a nasal endoscopic examination, olfactory testing with the Korean Version of the Sniffin’ Sticks test, and MR imaging. All patients completed the Sino-Nasal Outcome Test and Questionnaire of Olfactory Disorders. Olfactory bulb atrophy and neuropathy were evaluated on MR images by 2 head and neck radiologists.
RESULTS:The etiology of olfactory loss was chronic rhinosinusitis with/without nasal polyps in 15 (44.1%) patients, respiratory viral infection in 7 (20.6%), trauma in 2 (5.9%), and idiopathic in 10 (29.4%) patients. Although 10 (29.4%) of the 34 patients were normosmic according to the Sniffin’ Sticks test, their scores on the other tests were like those of patients who were hyposmic/anosmic according to the Sniffin’ Sticks test. However, the detection rate of olfactory bulb atrophy was significantly higher in patients with hyposmia/anosmia than it was in patients with normosmia (P⫽.002). No difference in olfactory bulb neuropathy was identified among patients with normosmia and hyposmia/anosmia (P⫽.395).
CONCLUSIONS: MR imaging evaluations of olfactory bulb atrophy can be used to objectively diagnose olfactory dysfunction in patients with subjective olfactory loss.
ABBREVIATIONS:OB⫽olfactory bulb; LQ⫽Life Quality; QOD⫽Questionnaire of Olfactory Disorders; URI⫽upper respiratory infection; VISTA⫽volume isotropic turbo spin-echo acquisition
S
ymptoms regarding one’s sense of smell (olfactory dysfunc-tion) are relatively common, with a prevalence of about 20% in the general population. The etiologies of olfactory loss include postviral upper respiratory infection (URI), sinonasal disease, head trauma, aging, congenital causes, toxins/drugs, miscella-neous, idiopathic, and neurologic diseases such as Parkinson dis-ease, multiple sclerosis, and Alzheimer disease.1Olfaction plays arole in identifying food and hazards and may be involved in social communication; thus, olfactory dysfunction can decrease an in-dividual’s quality of life.2-4
Because treatments for olfaction loss are ineffective in many patients, precise assessments of their olfactory disturbances should be conducted before starting treatment, because these may be helpful for predicting their prognosis and providing proper counseling.5In addition, some patients’ olfactory function test scores are normal despite subjectively feeling as though their abil-ity to smell is reduced. In these cases, it is difficult to determine whether one’s ability to smell is decreased or whether treatment for hyposmia/anosmia is necessary. Therefore, the use of addi-tional objective diagnostic tools may help confirm olfactory dys-function in such individuals. Olfactory abilities are generally mea-sured through olfactory function tests such as the University of Pennsylvania Smell Identification Test, the Connecticut Chemo-sensory Clinical Research Center Threshold Test, or the Sniffin’ Sticks test. MR imaging can provide anatomic information on the olfactory pathway. One of the primary parameters for evaluating
Received July 25, 2017; accepted after revision October 26.
From the Department of Radiology (M.S.C.), Chung-Ang University Hospital, Chung-Ang University College of Medicine, Seoul, Republic of Korea; and Depart-ments of Otorhinolaryngology–Head and Neck Surgery (W.R.C., H.-Y.J., J.H.K.), and Radiology and Research Institute of Radiology (J.H.L.), Asan Medical Center, Univer-sity of Ulsan College of Medicine, Seoul, Republic of Korea.
Paper previously presented, in part, at: International Congress of Otorhinolaryn-gology–Head and Neck Surgery, April 21–23, 2017; Seoul, Korea.
Please address correspondence to Ji Heui Kim, MD, PhD, Department of Otorhino-laryngology–Head and Neck Surgery, Asan Medical Center, University of Ulsan College of Medicine, 88 Olympic-ro 43-gil, Songpa-gu, Seoul 05505, Republic of Korea; e-mail: [email protected]
the olfactory pathway with MR imaging is olfactory bulb (OB) volume. Research has shown that OB volume in patients with olfactory loss is significantly decreased, and changes in OB vol-ume are correlated with odor threshold changes.5-7However, OB volume measurements are not commonly used for evaluating the olfactory pathway in clinical settings because volumetric analysis itself is difficult to routinely measure through planimetric manual contouring of multiple sections compared with visual analysis. Moreover, the cutoff values for diagnosing atrophy of OB volume in individual patients have not been established.8-11Therefore, in the present study, we evaluated the relationship between olfactory function tests and visual analyses of OB atrophy or neuropathy on MR images to determine whether such visual analyses could serve as easy and reliable imaging biomarkers of olfactory dysfunction.
MATERIALS AND METHODS
Study SubjectsThis study included 34 patients (15 males and 19 females; mean age, 51.4 years; range, 9 –72 years) who presented with subjective olfactory loss between March 2016 and March 2017. The mean duration of olfactory loss was 59.2 months (range, 2–552 months). This retrospective study was approved by the institu-tional review board of Asan Medical Center, exempting the study from requiring patient consent.
Chronic rhinosinusitis was diagnosed according to criteria es-tablished by the European Position Paper on Rhinosinusitis and Nasal Polyps (2012) guidelines based on the history, nasal endos-copy, and CT of the paranasal sinuses.12A post-URI olfactory deficit was diagnosed when acute loss of olfaction started after URI development and lasted until the consultation without other causes of olfactory loss. A posttraumatic olfactory deficit was di-agnosed when the patient experienced a loss of olfaction after cranial trauma without other causes.5If the patients did not have a clear cause of olfactory loss despite an extensive evaluation, their etiology was considered idiopathic.13
Olfactory Function Test
Olfactory function was tested by using the Korean Version of the Sniffin’ Sticks II test. The odor Threshold, Discrimination, and Identification tests were performed in 3-minute intervals. The Threshold was defined as the concentration at whichn-butanol (maximum concentration 4%, 16 steps of 1:2 serial dilutions) was accurately identified 4 consecutive times. For the Discrimination test, triplets of odorants (2 identical, 1 different) were presented, and the subject was asked to choose the different odorant. The Identification test was performed using 16 odors familiar to Ko-reans. The sum of the 3 tests was expressed as the total Threshold-Discrimination-Identification score. Total scores of 0 –20 were defined as “anosmia”; 20.25–27, as “hyposmia”; and 27.25– 48, as “normosmia,” according to a previous study.14
Symptom Questionnaires
All patients completed the Sino-Nasal Outcome Test-22 and Questionnaire of Olfactory Disorders (QOD) during a clinic visit. The Sino-Nasal Outcome Test questions were scored from 0 (no problem) to 5 (severe problem), and the maximum total score was 110.15The QOD consisted of 3 statements, namely the Life
Qual-ity (LQ), SincerQual-ity, and Parosmia statements, and 5 visual analog scales.2,16The sum of the QOD-LQ scores comprised the LQ raw score (maximum score⫽57 points), which was transformed into the LQ by the following formula: LQ⫽LQ Raw Score/0.57 (%). The sum of the QOD Sincerity scores comprised the Sincerity raw score (maximum score⫽18), which was converted to the Sincer-ity score by the following formula: SincerSincer-ity Score⫽Sincerity Raw Score/0.18 (%). The sum of the QOD Parosmia scores com-prised the Parosmia raw score (maximum score⫽12), which was converted to the Parosmia score with the following formula: Par-osmia Score⫽Parosmia Raw Score/0.12 (%). The visual analog scales consisted of 5 olfactory dysfunction problems, which were scored from 0 to 10.
Image Acquisition
The MR images were acquired using a 3T MR imaging system (Ingenia 3T CX; Philips Healthcare, Best, Netherlands) with a 64-channel head and neck coil. Coronal T2WI and precontrast 3D-FLAIR and 3D-T2 volume isotropic turbo spin-echo acquisi-tion (VISTA; Phillips Healthcare) were performed with the fol-lowing parameters: TR/TE, 300/80 ms; TSE factor, 15; bandwidth, 209 Hz/pixel; section thickness, 1.5 mm; matrix, 512⫻512; FOV, 90⫻190 mm; voxel size, 0.43⫻0.43⫻1.5 mm; and scan time, 3 minutes for T2WI; TR/TE, 8000/244 ms; TSE factor, 80; band-width, 510 Hz/pixel; sensitivity encoding factor, 2.5; section thickness, 0.6 mm; matrix, 256⫻256; FOV, 40⫻180⫻180 mm; voxel size, 0.35⫻0.35⫻0.6 mm; and scan time, 6 minutes and 40 seconds for 3D-FLAIR; and TR/TE, 2000/268 ms; TSE factor, 75; bandwidth, 330 Hz/pixel; acceleration factor, 2.5; section thick-ness, 0.6 mm; matrix, 376⫻374; FOV, 30⫻150⫻150 mm; voxel size, 0.2⫻0.2⫻0.6 mm; and scan time, 7 minutes and 42 seconds for 3D-T2 VISTA. Sections were angled perpendicular to the an-terior base of the skull or cribriform plate. The scan coverage was from the frontal sinus to the optic chiasm.
Imaging Data Analyses
Two head and neck radiologists, with 18 and 6 years of experience, respectively, analyzed the MR imaging findings via consensus us-ing the PACS system. The radiologists were blinded to the results of the patients’ olfactory function tests. The boundaries of the OB were determined using the surrounding CSF and the anterior cribriform plate as markers. Atrophy of the OB was diagnosed on the basis of the following findings: flattening and thinning of the olfactory bulb with loss of the normal oval or J-shape of the OB,17 and an asymmetric decrease in the size of the OB compared with the OB on the contralateral side (Fig 1).18Neuropathy was de-fined as neuromalacia of the OB, with focal or diffuse high signal intensity in the OB and increased signal compared with the signal intensity of the adjacent frontal white matter with/without de-creased volume on 3D-FLAIR or coronal T2-weighted images (Fig 2).10
Statistical Analysis
test and Fisher exact test were used to compare the results of olfactory function tests between patients with the presence or ab-sence of OB atrophy and neuropathy. The Mann-WhitneyUtest was used for comparison of the presence or absence of OB atrophy following age and olfactory deficit duration. Data were analyzed by using SPSS 21 (IBM, Armonk, New York). Differences were considered significant atP⬍.05.
RESULTS
Etiology and Severity of Patients’ Subjective Olfactory Symptoms
The etiology of the olfactory deficits was chronic rhinosinusitis with/without polyps in 15 (44.1%) patients, postviral URI in 7 (20.6%), trauma in 2 (5.9%), and idiopathic in 10 (29.4%) pa-tients. None of the patients had olfactory deficits owing to neuro-logic disease.
Ten (29.4%) of the 34 patients were normosmic according to the Korean Version of the Sniffin’ Sticks II test; the mean total Threshold-Discrimination-Identification score for these 10 patients was 35.5 (range, 27.25– 43), and their mean Threshold, Discrimina-tion, and Identification scores were 12.5, 11.4, and 11.6, respectively. Twenty-four (70.6%) of the 34 patients had olfactory dysfunction (hyposmic/anosmic) according to the Korean Version of the
Snif-fin’ Sticks II test; the mean total Threshold-Discrimination-Iden-tification score for these 24 patients was 15.3 (range, 6 –27), and their mean Threshold, Discrimination, and Identification scores were 3.1, 6.7, and 5.5, respectively. No differences in olfactory dysfunction were identified among the etiologies (P⫽.683,Table 1) or among the various age groups (0 –19, 20 –39, 40 –59, and 60 –72 years;P⫽.491). The Sino-Nasal Outcome Test and QOD scores of patients with normosmia were similar to those of pa-tients with olfactory dysfunction (Table 2).
Relationship between the Olfactory Function Test Scores and OB Atrophy and Neuropathy
Atrophy of the OB on MR images was more frequently identified in patients with olfactory dysfunction (17/24, 70.8%) than in pa-tients with normosmia (1/10, 10.0%) (P⫽.002). Of the patients with atrophy, unilateral atrophy was found in 1 patient with nor-mosmia and 4 patients with olfactory dysfunction, and bilateral atrophy was found in 13 patients with olfactory dysfunction. The mean Threshold, Discrimination, Identification, and total
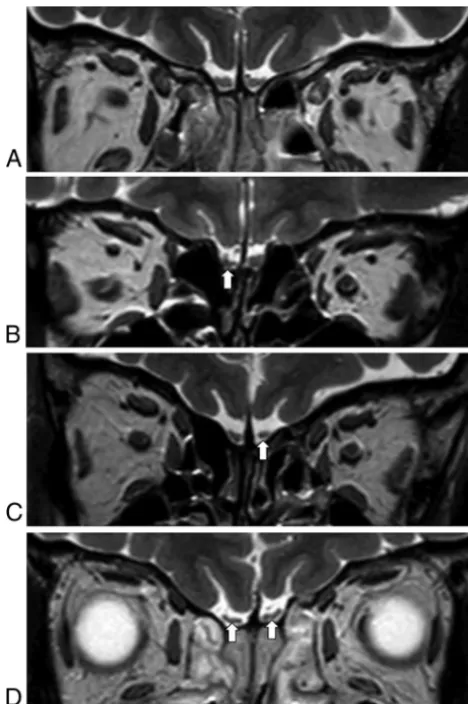
FIG 1. Atrophy of the olfactory bulbs. Compared with a patient with normal olfactory bulbs (A), which have an oval or inverted-J shape, patients with atrophy in the olfactory bulbs show asymmetric de-creases in the size of the affected olfactory bulbs (B,right; andC,left, arrow) or flattening of the olfactory bulbs (D,arrows).
[image:3.594.51.285.46.398.2]FIG 2. Neuropathy of the olfactory bulbs. Homogeneous signal in-tensity in both olfactory bulbs is noted in a patent without neuropa-thy (A); however, focal (B) or diffuse (C) hyperintense areas in left olfactory bulb (arrow) compared with the white matter of the frontal lobe are visible on FLAIR images in patients with neuropathy.
Table 1: Korean Version of the Sniffin’ Sticks II test results according to the etiology of olfactory deficitsa
Etiology
Normosmia (n= 10)
Hyposmia/ Anosmia
(n= 24)
P Valueb Chronic rhinosinusitis 4 (40.0) 11 (45.8) .683
Postviral URI 3 (30.0) 4 (16.7)
Trauma 0 (0) 2 (8.3)
Idiopathic 3 (30.0) 7 (29.2)
aData are the number of patients (%). b2
[image:3.594.303.533.47.313.2] [image:3.594.300.532.397.470.2]Threshold-Discrimination-Identification scores of patients with OB atrophy were significantly lower than those of patients with-out OB atrophy (P⬍.05 for all comparisons,Table 3). When classified according to etiology, OB atrophy was observed in 6 (85.7%) of the 7 patients with idiopathic olfactory dysfunction, whereas OB atrophy was not observed in 3 patients who believed they had olfactory loss but were normosmic according to the ol-factory function tests (P⫽.033,Table 4). However, regarding the other etiologies, no significant differences in OB atrophy were noted between patients with normosmia and those with olfactory dysfunction (P⬎.05 for all comparisons). Furthermore, the pres-ence or abspres-ence of OB atrophy had no correlation with the age (P⫽.743) or olfactory deficit durations (P⫽.652).
Neuropathy of the OB was detected in 4 (40.0%) of the 10 patients with normosmia and in 5 (20.8%) of the 24 patients with
olfactory dysfunction (P⫽.395). No difference in the presence of OB neuropathy was identified between patients with normosmia and those with olfactory dysfunction when grouped according to etiology (P⬎.05 for all comparisons).
Brain parenchymal lesions were detected in 3 (12.5%) of the 24 patients who had olfactory dysfunction according to the Ko-rean Version of the Sniffin’ Sticks II test and OB atrophy on MR images. Focal encephalomalacic changes in the rectus gyrus or frontal lobe and sequelae from hemorrhagic contusions in the bilateral orbitofrontal base may affect olfactory dysfunction.
DISCUSSION
In the present study, we evaluated whether visual analyses of OB atrophy on MR images could serve as an easy and reliable method for diagnosing olfactory dysfunction. Here, we found that⬃30% of patients with subjective olfactory loss had normal olfactory function test results and that the subjective severity of olfactory loss in these patients, as represented by the Sino-Nasal Outcome Test and QOD, was similar to that of patients who had hyposmia/ anosmia according to the Sniffin’ Sticks test. Additionally, the number of patents classified as normosmic according to the olfac-tory function tests was not different among the various etiology and age groups. These results support additional objective diag-nostic methods being required to confirm olfactory loss. OB at-rophy on MR images using visual analysis was more frequent in patients with hyposmia/anosmia compared with those with nor-mosmia. Therefore, we suggest that MR imaging evaluations of OB atrophy could be used to objectively diagnose olfactory dys-function in patients with subjective olfactory loss.
Many previous studies have used MR imaging to assess the OB in patients with olfactory loss because the OB plays an important role in processing olfactory information that is sent between the olfactory receptor neurons and the brain. Several studies have shown that patients with posttraumatic and postviral olfactory dysfunction as well as idiopathic olfactory loss have reduced OB sizes on MR images compared with healthy controls.19-21The depth of the olfactory sulcus, which is located between the gyrus rectus and medial orbital gyrus in the frontal lobe and positioned over the OB and olfactory tract, is considered another relevant parameter for evaluating the olfactory pathway with MR imaging. However, the depth of the olfactory sulcus is not significantly different in patients with idiopathic olfactory loss and those with Parkinson disease compared with healthy controls.7,20Thus, eval-uating the OB rather than the olfactory sulcus may be valuable in patients with olfactory dysfunction except for those with congen-ital anosmia. Unfortunately, the OB volume is not routinely mea-sured in patients with olfactory dysfunction because it requires complex assessment techniques of volumetry; therefore, we hy-pothesized that visual analyses of OB atrophy or neuropathy on MR images can be practically used as an objective assessment tool in clinical settings for patients with olfactory dysfunction.22,23 Our results demonstrated that indeed, OB atrophy was signifi-cantly related to decreased olfactory function.
Thin-section coronal T2WI (⬍2 mm) and 3D images have been highly recommended for the precise anatomic evaluation of the OB and olfactory tract owing to their small sizes.10In addition to coronal T2WI at 1.5 mm, we performed high-resolution
3D-Table 2: Comparison of subjective symptom severity between patients with normosmia and those with hyposmia/anosmiaa
Normosmia (n= 10)
Hyposmia/ Anosmia
(n= 24) P Valueb SNOT-22 score (mean⫾SD) 13.6⫾9.5 22.83⫾16.6 .160 QOD (mean⫾SD)
LQ raw score 22.3⫾10.9 21.4⫾11.6 .867
LQ (%) 39.1⫾19.1 37.6⫾20.3 .867
Sincerity raw score 5.8⫾2.3 6.4⫾2.6 .589 Sincerity (%) 32.2⫾12.8 35.4⫾14.2 .589 Parosmia raw score 2.3⫾1.9 2.9⫾3.3 .838 Parosmia (%) 19.2⫾15.7 24.7⫾27.2 .838 Visual analog scales 19.7⫾10.7 23.8⫾16.1 .589
Note:—SNOT-22 indicates Sino-Nasal Outcome Test-22.
a
LQ⫽LQ raw score/0.57 (%); Sincerity⫽Sincerity raw score/0.18 (%); Parosmia score⫽Parosmia raw score/0.12 (%).
b
[image:4.594.53.285.66.189.2]Mann-WhitneyUtest.
Table 3: Comparison of Korean Version of the Sniffin’ Sticks II test scores according to the presence/absence of olfactory bulb atrophy
Normal Atrophy PValuea
Threshold 8.1⫾5.9 3.8⫾5.1 .030
Discrimination 9.6⫾2.8 6.7⫾2.9 .006
Identification 9.1⫾3.9 5.7⫾2.5 .006
Total Threshold-Discrimination-Identification score
26.9⫾11.9 16.2⫾8.8 .008
aMann-WhitneyUtests.
Table 4: Atrophy and neuropathy of the olfactory bulb on MR images according to the Korean Version of the Sniffin’ Sticks II test results and etiologya
Etiology Normosmia
Hyposmia/ Anosmia
P Valueb Chronic rhinosinusitis (n⫽15)
Atrophy 0/4 (0) 7/11 (63.6) .077
Neuropathy 1/4 (25.5) 3/11 (27.3) 1.000 Postviral URI (n⫽7)
Atrophy 1/3 (33.3) 3/4 (75.0) .486
Neuropathy 2/3 (66.7) 1/4 (25.0) .486
Trauma (n⫽2)
Atrophy 0/0 (0) 1/2 (50.0) NA
Neuropathy 0/0 (0) 0/2 (0) NA
Idiopathic (n⫽10)
Atrophy 0/3 (0) 6/7 (85.7) .033
Neuropathy 1/3 (33.3) 1/7 (14.3) 1.000
Note:—NA indicates not available.
a
Data are number of patients (%).
b
[image:4.594.54.286.262.327.2] [image:4.594.53.285.372.518.2]FLAIR and 3D-T2 VISTA with a 0.6-mm section thickness. Using these techniques, we identified OB atrophy in 70.8% of patients with hyposmia/anosmia, as assessed with olfactory function tests, and atrophy was significantly more common in patients with dys-function than it was in those with normosmia (10.0%). Further-more, the olfactory function test scores of patients with OB atro-phy were significantly lower than those of patients without OB atrophy. Moreover, the detection rate of OB atrophy was not dif-ferent among the various age and olfactory deficit duration groups. These results suggested that visual analysis of OB atrophy is a useful diagnostic method for patients with subjective olfactory loss regardless of their age and olfactory deficit duration.
Evaluating OB atrophy with MR imaging in patients with id-iopathic olfactory loss may help determine whether there is olfac-tory loss, even though the significance of the absence of atrophy on MR imaging in a patient with subjective symptoms was not identified. Our results showing that there was no difference in OB atrophy between normosmia and hyposmia/anosmia according to the Sniffin’ Sticks II test in patients with chronic rhinosinusitis seem to reflect their olfactory deficits possibly being conductive. Because only a few patients had postviral URI and posttraumatic olfactory loss in the present study, it may be difficult to assess the correlation between OB atrophy and the results of olfactory func-tion tests.
The significance of neuropathy (neuromalacic hyperintense changes) of the OB on 3D-FLAIR images has not yet been estab-lished in patients with olfactory loss. In our study, neuropathy of the OB was detected not only in patients with hyposmia/anosmia, as assessed with olfactory function tests, but also in patients with normosmia. This result may be because our patients had been experiencing olfactory deficits for⬎2 months. Further studies are required to determine the prognostic value of neuropathy accord-ing to the duration of olfactory loss.
A substantial number of brain lesions that may affect olfactory dysfunction were found in 12.5% of our patients who had hypos-mia/anosmia according to the Korean Version of the Sniffin’ Sticks II test and OB atrophy on MR images. Two patients with posttraumatic olfactory deficits had focal encephalomalacic changes in the rectus gyrus and frontal lobe, respectively. One patient with idiopathic olfactory loss, though unusual, showed sequelae from a hemorrhagic contusion in the bilateral orbito-frontal base without a history of trauma. This MR imaging finding may have helped this patient receive appropriate counseling be-cause the patient did not link the occurrence of olfactory loss with a significant event.
This study has several limitations. First, our sample size was relatively small, and the data were retrospectively reviewed. De-creased statistical power caused by the sample size might affect the ability to declare statistical significance in our results, such as the relation between the olfactory function tests and the Sino-Nasal Outcome Test-22 (which demonstrated relatively large score dif-ferences) or OB atrophy subclassified by etiology (a small number of patients for each subgroup). Further prospective study with a larger population is needed. Second, we could not assess the fol-low-up data after treatment in patients with OB atrophy or neu-ropathy due to short-term follow-up. Further studies that include patients with variable deficit-onset times, including sudden
olfac-tory deficits (⬍4 weeks) and chronic hyposmia/anosmia, should be performed to evaluate the prognostic value of OB atrophy or neuropathy. Nevertheless, our study demonstrates that visual analyses of OB atrophy using MR imaging are closely related to olfactory function.
CONCLUSIONS
The results of the present study show that the detection rate of OB atrophy on MR images was significantly higher in patients with olfactory dysfunction than it was patients with normosmia. Therefore, evaluating OB atrophy with MR imaging may serve as a readily available objective diagnostic method for confirming olfactory dysfunction in patients with subjective olfactory loss.
ACKNOWLEDGMENTS
We thank professor Johannes Frasnelli for providing the Ques-tionnaire of Olfactory Disorders.
REFERENCES
1. Croy I, Nordin S, Hummel T.Olfactory disorders and quality of life: an updated review.Chem Senses2014;39:185–94CrossRef Medline
2. Frasnelli J, Hummel T.Olfactory dysfunction and daily life.Eur Arch Otorhinolaryngol2005;262:231–35CrossRef Medline
3. Croy I, Buschhu¨ter D, Seo HS, et al. Individual significance of olfaction: development of a questionnaire.Eur Arch Otorhinolaryn-gol2010;267:67–71CrossRef Medline
4. Neuland C, Bitter T, Marschner H, et al.Health-related and specific olfaction-related quality of life in patients with chronic functional anosmia or severe hyposmia.Laryngoscope2011;121:867–72CrossRef Medline
5. Rombaux P, Huart C, Deggouj N, et al.Prognostic value of olfactory bulb volume measurement for recovery in postinfectious and post-traumatic olfactory loss. Otolaryngol Head Neck Surg 2012;147: 1136 – 41CrossRef Medline
6. Haehner A, Rodewald A, Gerber JC, et al.Correlation of olfactory function with changes in the volume of the human olfactory bulb.
Arch Otolaryngol Head Neck Surg2008;134:621–24CrossRef Medline
7. Wang J, You H, Liu JF, et al.Association of olfactory bulb volume and olfactory sulcus depth with olfactory function in patients with Parkinson disease.AJNR Am J Neuroradiol2011;32:677– 81CrossRef Medline
8. Buschhu¨ter D, Smitka M, Puschmann S, et al.Correlation between olfactory bulb volume and olfactory function.Neuroimage2008;42: 498 –502CrossRef Medline
9. Rombaux P, Duprez T, Hummel T.Olfactory bulb volume in the clinical assessment of olfactory dysfunction.Rhinology2009;47:3–9
Medline
10. Duprez TP, Rombaux P.Imaging the olfactory tract (cranial nerve #1).Eur J Radiol2010;74:288 –98CrossRef Medline
11. Huart C, Meusel T, Gerber J, et al.The depth of the olfactory sulcus is an indicator of congenital anosmia.AJNR Am J Neuroradiol2011; 32:1911–14CrossRef Medline
12. Fokkens WJ, Lund VJ, Mullol J, et al.European Position Paper on Rhinosinusitis and Nasal Polyps 2012.Rhinol Suppl2012;23:1–298
Medline
13. Hoekman PK, Houlton JJ, Seiden AM.The utility of magnetic reso-nance imaging in the diagnostic evaluation of idiopathic olfactory loss.Laryngoscope2014;124:365– 68CrossRef Medline
14. Shin DH, Ahn SH, Yang Y, et al.The effect of sleep disordered breathing on olfactory functions: analysis by Apnea-Hypopnea In-dex.Clin Exp Otorhinolaryngol2017;10:71–76CrossRef Medline
with chronic sinusitis.Ann Allergy Asthma Immunol2013;111:246 – 51.e2CrossRef Medline
16. Yang D, Wang J, Ni D, et al.Reliability and validity of the Chinese version of the Questionnaire of Olfactory Disorders (QOD) when used with patients having olfactory dysfunction.Eur Arch Otorhi-nolaryngol2016;273:3255– 61CrossRef Medline
17. Schneider JF, Floemer F.Maturation of the olfactory bulbs: MR im-aging findings.AJNR Am J Neuroradiol2009;30:1149 –52CrossRef Medline
18. Booth TN, Rollins NK.Spectrum of clinical and associated MR im-aging findings in children with olfactory anomalies.AJNR Am J Neuroradiol2016;37:1541– 48CrossRef Medline
19. Mueller A, Rodewald A, Reden J, et al.Reduced olfactory bulb vol-ume in post-traumatic and post-infectious olfactory dysfunction.
Neuroreport2005;16:475–78CrossRef Medline
20. Rombaux P, Potier H, Markessis E, et al.Olfactory bulb volume and depth of olfactory sulcus in patients with idiopathic olfac-tory loss.Eur Arch Otorhinolaryngol2010;267:1551–56CrossRef Medline
21. Rombaux P, Wetz H, Mouraux A, et al.Olfactory function assessed with orthonasal and retronasal testing, olfactory bulb volume, and chemosensory event–related potentials. Arch Otolaryngol Head Neck Surg2006;132:1346 –51CrossRef Medline
22. Bresciani L, Rossi R, Testa C, et al.Visual assessment of medial tem-poral atrophy on MR films in Alzheimer’s disease: comparison with volumetry.Aging Clin Exp Res2005;17:8 –13CrossRef Medline
23. Gouw AA, van der Flier WM, van Straaten EC, et al.Reliability and sensitivity of visual scales versus volumetry for evaluating white matter hyperintensity progression.Cerebrovasc Dis2008;25:247–53