ORIGINAL RESEARCH
SPINE
Predictive Models in Differentiating Vertebral Lesions Using
Multiparametric MRI
XR. Rathore,XA. Parihar,XD.K. Dwivedi,XA.K. Dwivedi,XN. Kohli,XR.K. Garg, andXA. Chandra
ABSTRACT
BACKGROUND AND PURPOSE: Conventional MR imaging has high sensitivity but limited specificity in differentiating various vertebral lesions. We aimed to assess the ability of multiparametric MR imaging in differentiating spinal vertebral lesions and to develop statistical models for predicting the probability of malignant vertebral lesions.
MATERIALS AND METHODS: One hundred twenty-six consecutive patients underwent multiparametric MRI (conventional MR imaging, diffusion-weighted MR imaging, and in-phase/opposed-phase imaging) for vertebral lesions. Vertebral lesions were divided into 3 sub-groups: infectious, noninfectious benign, and malignant. The cutoffs for apparent diffusion coefficient (expressed as 10⫺3mm2/s) and signal intensity ratio values were calculated, and 3 predictive models were established for differentiating these subgroups.
RESULTS:Of the lesions of the 126 patients, 62 were infectious, 22 were noninfectious benign, and 42 were malignant. The mean ADC was 1.23⫾0.16 for infectious, 1.41⫾0.31 for noninfectious benign, and 1.01⫾0.22 mm2/s for malignant lesions. The mean signal intensity ratio was 0.80⫾0.13 for infectious, 0.75⫾0.19 for noninfectious benign, and 0.98⫾0.11 for the malignant group. The combination of ADC and signal intensity ratio showed strong discriminatory ability to differentiate lesion type. We found an area under the curve of 0.92 for the predictive model in differentiating infectious from malignant lesions and an area under the curve of 0.91 for the predictive model in differentiating noninfectious benign from malignant lesions. On the basis of the mean ADC and signal intensity ratio, we established automated statistical models that would be helpful in differentiating vertebral lesions.
CONCLUSIONS: Our study shows that multiparametric MRI differentiates various vertebral lesions, and we established prediction models for the same.
ABBREVIATIONS:AUC⫽area under the curve; FNA⫽fine-needle aspiration; GPI⫽infectious; GPN⫽noninfectious benign; GPM⫽malignant; mpMRI⫽ multiparametric MRI; SE⫽sensitivity; SIR⫽signal intensity ratio; Sp⫽specificity
M
R imaging is the preferred technique in the diagnostic work-up of benign and malignant vertebral lesions. Mor-phologic criteria alone could not differentiate benign and malig-nant spinal lesions in 6%–21% of cases.1-3Due to the limitedspecificity of conventional MR imaging,4radiologists often have
trouble differentiating common spinal pathologies such as osteopo-rotic vertebral collapse, infectious spondylodiscitis, and metastasis.
Recently, multiparametric MR imaging (mpMRI) has shown the ability to localize, detect, and stage various diseases.5-8The mpMRI
approach combines anatomic sequences (T1- and T2-weighted MR imaging) with functional imaging sequences. Functional and quan-titative MR imaging methods, such as DWI, dynamic contrast-en-hanced MR imaging, and in-phase/opposed-phase imaging, mea-sure the Brownian motion of water molecules, regional vascular properties of the tumor, and fat quantification, respectively.6-9
DWI has been used in the differentiation of benign and malig-nant spinal lesions.10-12Signal characteristics of vertebral lesions
were evaluated on DWI for qualitative assessment, and the ADC was calculated for quantitative analysis. In general, malignant le-sions yield lower ADC compared with noninfectious benign and infectious lesions due to increased cellularity and decreased extra-cellular space in malignant lesions.10-12In-phase/opposed-phase
MR imaging quantifies fat in tissues and has been used in lesions of the adrenal gland and liver.13-17It has also been used in
diag-nostic work-up of spinal lesions, and the results demonstrated a
Received April 6, 2017; accepted after revision July 22.
From the Departments of Radiodiagnosis (R.R., A.P., D.K.D., N.K.), Neurology (R.K.G.), and Neurosurgery (A.C.), King George’s Medical University, Lucknow, Uttar Pradesh, India; and Division of Biostatistics & Epidemiology (A.K.D.), Department of Biomedical Sciences, Texas Tech University Health Sciences Center, El Paso, Texas. Please address correspondence to Anit Parihar, MD, Department of Radiodiagno-sis, King George’s Medical University, Lucknow, UP, India—226003; e-mail: [email protected]
Indicates article with supplemental on-line tables.
Indicates article with supplemental on-line photos.
significant difference in the signal intensity ratio (SIR) between benign and malignant vertebral lesions.9,18-21
The hypothesis for this study was that the mpMRI approach would increase the discriminatory ability of different vertebral lesions. The aim of the present study was to evaluate the ability of mpMRI in differentiating vertebral lesions and to establish statis-tical models for predicting the probability of malignant (GPM) lesions compared with noninfectious benign (GPN) and infec-tious (GPI) ones. The cutoffs of the ADC and SIR values were obtained to differentiate GPM lesions from GPI and GPN lesions. Furthermore, we considered GPI and GPN as all benign com-pared with the malignant lesions. The cutoff values of the ADC and SIR for differentiating malignant from all benign lesions were also obtained.
Although attempts have been made to assess the role of quan-titative DWI or in-phase/opposed-phase imaging in differentiat-ing vertebral lesions, to the best of our knowledge, no previous study has evaluated the ability of mpMRI to differentiate malig-nant or infectious lesions from noninfectious benign lesions.
MATERIALS AND METHODS
Patients and Inclusion Criteria
The institutional ethics committee of King George’s Medical Uni-versity approved this prospective cross-sectional study. All pa-tients gave written informed consent before MR imaging. We in-cluded all consecutive patients presenting with vertebral lesions on spine MR imaging between July 2011 and August 2015 who also had CT-guided fine-needle aspiration cytology/biopsy in the absence of trauma. We performed CT-guided fine-needle aspira-tion (FNA)/biopsy on the basis of clinical indicaaspira-tions communi-cated by the referring department and/or mpMRI findings. We used CT-guided FNA/biopsy (cytohistology/biopsy culture) as a reference standard test. We excluded 9 patients: 5 with motion artifacts and 4 due to indeterminate results of the biopsy. As a result, a cohort of 126 patients was included in the analysis of this study.
The exclusion criteria in the study were patients showing clas-sic features of degenerative changes in the spine, vertebral hem-angioma, or innumerable bony metastases. Although the classic cases of Modic degenerative endplate changes were excluded, pa-tients showing signal changes in vertebrae other than the end-plates, such as in the region of the vertebral body or posterior elements without any obvious bone destruction, were not ex-cluded. For example, early cases of infectious vertebral lesion or marrow infiltration present as isolated signal changes (marrow edema) without any bone destruction, preparavertebral soft-tis-sue component, disc involvement, or frank abscess formation were not excluded. The other exclusion criteria were patients with metallic implants, cardiac pacemakers, and claustrophobia; fol-low-up of vertebral lesions; and postoperative patients. More-over, patients with abnormal coagulation profiles and those not willing to undergo CT-guided FNA/biopsy were also excluded from the study.
In the study population, 5 patients had a history of other can-cers (2 had carcinoma breast, 1 had carcinoma larynx, 1 had car-cinoma cervix, and 1 had carcar-cinoma penis). The patient’s blood or previous radiologic investigations available at the time of presen-tation were not collected or analyzed in this study.
MR Image Acquisitions
MR imaging was performed on a 1.5T scanner (Signa Excite; GE Healthcare, Milwaukee, Wisconsin). All patients underwent MR imaging of the spine (T1WI, T2WI, STIR, contrast-enhanced MR imaging, DWI, and in-phase/opposed-phase MR imaging). T1WI in axial (TR/TE⫽500/11.7 ms, section thickness⫽4 mm) and sagittal planes (TR/TE⫽600/10.7 ms, section thickness⫽4 mm) was performed. Fast recovery fast spin-echo T2WI (TR/TE⫽ 3400/102 ms, section thickness⫽4 mm) in the axial and sagittal planes was performed. The STIR sequence (TR/TE⫽3200/110 ms, section thickness⫽5 mm, TI⫽150 ms) in the sagittal plane was acquired. Phase sequences were obtained in the sagittal plane with the following parameters: in-phase (TR/TE⫽118/5 ms; flip angle⫽80°), opposed-phase (TR/TE⫽118/2.5 ms; flip angle⫽ 80°), section thickness⫽5 mm with an intersection gap of 0.5 mm, matrix size⫽256⫻160, NEX⫽1, FOV⫽32 cm, and number of sections⫽15.
A single-shot DWI echo-planar sequence was used to acquire data in the sagittal plane: TR/TE⫽6200/104.6 ms, b-values of 0 and 600 s/mm2, FOV⫽32 cm, section thickness⫽5 mm,
inter-section gap⫽1 mm, and NEX⫽3. The ADC maps were gener-ated with minimum and maximum b-values.
Contrast-enhanced imaging including non-fat-saturated T1WI (TR/TE⫽400/10.8 ms, section thickness⫽4 mm) in the axial and sagittal planes was performed. The dosage of gadodiamide (Omniscan; GE Healthcare, Piscataway, New Jersey) contrast given was 0.1 mmol/kg of body weight.
Image Interpretation and Data Analysis
After MR imaging acquisition, images were interpreted prospec-tively by 2 independent radiologists. All the imaging features, ADC, and SIR values of vertebral lesions were calculated and re-corded before the CT-guided FNA/biopsy for each patient. One radiologist had 3 years’ experience in neuroradiology and the other had 10 years’. The radiologists were blinded to the patients’ clinical information, findings from other imaging modalities, and blood investigations, if any. However, the history of other cancers was available to the radiologists. Due to increased incidence of infectious vertebral lesions in our setup,22various lesions were
classified into 3 subgroups as GPI, GPN, and GPM.
On conventional MR imaging, lesions were primarily verte-bral in nature, involving the verteverte-bral body, the posterior ele-ments, or both. We observed associated preparavertebral and/or intraspinal (epidural) soft-tissue components in many of them, but none of the patients had intradural extramedullary or in-tramedullary involvement.
ROIs were drawn on the solid, preferably enhancing, bony com-ponents of the lesion, avoiding paravertebral soft tissue/collec-tion, if present. The areas of hemorrhage, necrosis, and calcifica-tion were avoided. Hypointense signals on T2-weighted and hyperintense signals on T1-weighted images were assumed to in-dicate hemorrhage/calcification. Furthermore, nonenhancing hypointense areas on T2- and T1-weighted images were consid-ered calcifications. Nonenhancing hyperintense areas similar to fluid on T2-weighted and hypointense areas on T1-weighted im-ages were used for necrosis. Care was taken to exclude endplates, cortical margins, disc spaces, or adjacent normal marrow while drawing the ROIs.
The ADC values were expressed in 10⫺3mm2/s. For the
calcu-lation of SIR, the signal intensity was measured on in-phase and opposed-phase images in the affected vertebrae. The mean SIR was calculated by dividing the marrow signal intensity recorded on opposed-phase by the in-phase images.
Reference Standard Test
In this study, lesions were identified on mpMRI examinations followed by CT-guided FNA/biopsy from the representative le-sions. However, the decision for biopsy was not based merely on the results of mpMRI analysis but also included other clinical parameters for appropriate patient management. The radiologist who interpreted MR images subsequently performed the CT-guided FNA/biopsy on the preselected target vertebra.
The vertebral FNA/biopsy specimen was obtained from 1 ver-tebra/contiguous soft tissue. A patient may have had⬎1 type of lesion. However, we recorded 1 type of lesion for each patient when cytohistology was performed. The mean time interval be-tween MR imaging and CT-guided FNA/biopsy was 5 days (range, 3–7 days). If the results of the CT-guided FNA were indetermi-nate, a repeat CT-guided biopsy was performed in another 6 days (range, 5– 8 days). None of the patients underwent open biopsy.
Statistical Analysis
We used previously published data to estimate the sample size for this study. In previous studies, the mean ADC values were re-ported for the benign group as 1.75–1.98 SD 0.30 – 0.44; for the infectious group, as 0.91–1.54 SD 0.14 – 0.38; and for the malig-nant group, as 0.5– 0.77 SD 0.23– 0.30.23,24On the basis of these
data, we estimated a sample size of 19 per group to detect signif-icant differences in mean ADC values between GPN and GPI and 34 per group to detect significant differences in mean ADC values between GPI and GPM with⬎80% power at the 5% level of sig-nificance using a 2-sided unpairedttest. Thus, we proposed to include at least 20 cases of GPN, 40 cases of GPI, and 40 cases of GPM. The proposed sample size is more than sufficient to detect differences in mean SIR values between benign and malignant cases on the basis of the data previously reported in studies.9,20
The sample size is also sufficient to develop predictive logistic regression models to differentiate these groups.
Quantitative data were described with mean⫾SD and range, while categoric data were presented using frequency and propor-tion. A weighted agreement along with the 95% confidence interval was estimated between 2 independent radiologists. The average ADC and SIR values were compared among 3 groups by
using 1-way analysis of variance followed by the Bonferroni cor-rection for multiple comparisons in post hoc analysis. The thresh-olds of the ADC and SIR in classifying different disease groups were calculated with receiver operating characteristic analysis. The cutoff was selected where the maximum Youden index (sen-sitivity⫹specifity⫺1) and the minimum distance on the receiver operating characteristic curve from points 0 and 1 were observed. The performance of the cutoff was summarized using sensitivity (SE), and specificity (Sp). The area under the curve (AUC) was summarized to evaluate the overall discriminatory ability of dif-ferent tests. The likelihood ratios (positive likelihood ratio and negative likelihood ratio) and correct classification measures were also reported for the obtained cutoffs. The receiver operating characteristic curves were constructed for important findings. The individual and combined predictive models of ADC and SIR in differentiating disease groups were developed using logistic regres-sion analysis. Furthermore, the discriminatory performance of the model was summarized with the area under the receiver operating characteristic curve along with the 95% CI. The 95% CI for the AUC was obtained with an asymptotic normal distribution approach. We also conducted internal validation of the developed models by using leave-one-out methods. The indices for model performance were reported for both original and validation analysis. A value ofP⬍.05 was significant. All the statistical analyses were performed with STATA 12.1 (StataCorp, College Station, Texas).
RESULTS
A total of 126 subjects (73 men [57.9%], 53 women [42.1%]; mean age, 45.3⫾15.2 years, range, 4 –76 years) were analyzed. Of the total, 49% (62/126) had GPI lesions, 18% (22/126) had GPN lesions, and 33% (42/126) had GPM lesions using the reference standard. In malignancy, 85.7% (36/42) of cases were metastatic (solitary, 25; multiple, 11) and the remaining 14.2% (6/42) were primary bone tumor. Excellent agreement was obtained on the data generated by the 2 independent radiologists (agreement⫽ 0.96; 95% CI, 0.94 – 0.97).
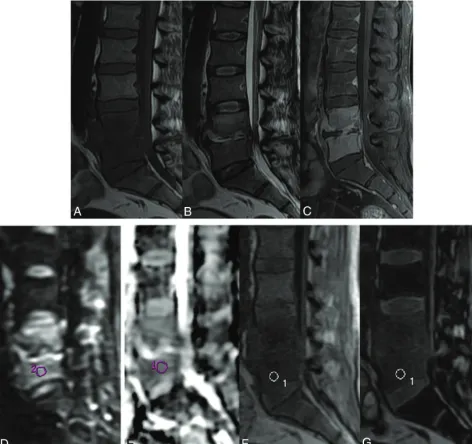
Most of the patients in the GPI subgroup had tuberculosis, 82% (51/62); the rest of the cases were pyogenic in nature, 18% (11/62), while in the GPN subgroup, most had osteoporotic ver-tebral collapse, 63% (14/22). The different types of lesions are summarized in On-line Table 1. The morphologic and quantita-tive imaging of GPI, GPN, and GPM lesions is shown inFigs 1–3, respectively. On-line Fig 1 is a GPN lesion with a histopathologic diagnosis of inflammatory pseudotumor.
The diagnostic accuracy of MR imaging quantitative traits for characterizing different vertebral lesions and the results of re-ceiver operating characteristic analysis are summarized in On-line Table 3. The cutoff for ADC to differentiate GPN and GPM lesions was found to be 1.2 with a sensitivity of 86.4% and a spec-ificity of 78.6%. The cutoff for ADC was 1.0 (with an SE of 96.8% and an Sp of 69.1%) in differentiating GPI and GPM lesions, whereas the cutoff for ADC in differentiating GPI and GPN le-sions was found to be 1.3 with an SE of 72.7% and an Sp of 59.7% (On-line Table 3). The AUC for the ADC model in differentiating GPN and GPM lesions was 0.89 (95% CI, 0.81– 0.96) followed by 0.82 (95% CI, 0.73– 0.92) for differentiating GPI and GPM le-sions. The cutoffs for SIR in differentiating various categories are depicted in On-line Table 3. The cutoff for SIR was 0.91 with an SE
of 85.7% and an Sp of 85.5% in differentiating GPI and GPM lesions, and the SIR model provided an AUC of 0.90 (95% CI, 0.84 – 0.96). Differentiating GPN and GPM lesions with the SIR cutoff value as 0.90 correctly classified 84.3% cases, and the cal-culated AUC was 0.86 (95% CI, 0.76 – 0.97). The ADC cutoff for differentiating all benign from malignant lesions was estimated to be 1.0, whereas the SIR cutoff was estimated to be 0.91 for differ-entiating malignant lesions from all benign lesions. On-line Fig 1 represents a case with an expansile lesion with endplate erosion and mild homogeneous contrast enhancement. These findings favored a malignant etiology, while its ADC was 1.3⫻ 10⫺3 mm2/s and the SIR was 0.64. These features pointed to a benign
lesion, which proved to be an inflammatory pseudotumor on histopathology.
[image:4.594.57.530.50.494.2]With estimated cutoffs for the ADC and SIR, 28 lesions (22.2%) had contradictory ADC and SIR in differentiating malig-nant from all benign lesions. In these cases, the sensitivity and specificity of ADC values were found to be 26.7% and 92.3%, respectively. Whereas, the sensitivity and specificity of SIR were found to be 73.3% and 7.7%, respectively. Therefore, the joint evaluation of the ADC and SIR values could improve classifica-tions. In differentiating all groups, 45 (35.7%) lesions had differ-ent results between ADC and SIR. Overall, misclassification was found to be similar with the ADC and SIR values.
Multivariable logistic regression analysis showed that the ADC and SIR values were significantly associated with GPM compared with GPN or GPI lesions and all benign lesions (On-line Table 4). The AUC for the statistical model (model 1) with ADC and SIR to
differentiate GPM from GPI lesions was found to be 0.92 (95% CI, 0.87– 0.97), while the AUC for the statistical model (model 2) with ADC and SIR to differentiate GPM from GPN lesions was observed to be 0.91 (On-line Fig 2). The AUC for differentiating malignant lesions from all benign lesions (model 3) was 0.92 (95% CI, 0.87– 0.97). The probability of malignant lesions in model 1 can be ob-tained as exp(⫺10.50⫺ 5.67⫻ ADC⫹ 18.35 ⫻SIR) / [1 ⫹ exp(⫺10.5⫺5.67⫻ADC⫹18.35⫻SIR)]. Moreover, the proba-bility of malignant lesions in model 2 can be obtained by using the equation, exp(⫺5.93 ⫺ 4.59 ⫻ ADC ⫹ 13.33 ⫻ SIR) / [1 ⫹ exp(⫺5.93⫺4.59⫻ADC⫹13.33⫻SIR)]. The probability of ma-lignant lesions compared with all benign lesions in model 3 can be estimated by using the following equation: exp(⫺8.25⫺5.42⫻ ADC⫹15.27⫻SIR) / [1⫹exp(⫺8.25⫺5.42⫻ADC⫹15.27⫻
[image:5.594.56.527.48.490.2]SIR)]. The model validation on the test data (using the leave-one-out method) showed an AUC of 0.91 for model 1, an AUC of 0.88 for model 2, and an AUC of 0.90 for model 3 (On-line Table 4).
Model 1 can differentiate GPI and GPM lesions. A cutoff of 0.39 for model 1 provided the positive likelihood ratio of 4.18. The proposed model 1 achieved a sensitivity of 81% and a specificity of 80.7% at the determined cutoff. This model correctly character-ized 81% of cases. Model 2 differentiates GPN and GPM lesions. A cutoff value of 0.68 was determined for the second model; it dif-ferentiated GPN and GPM lesions with a high sensitivity and specificity (83.3% and 81.8%, respectively), and it correctly char-acterized 83% of cases. The positive likelihood ratio for model 2 was 4.58. Model 3 differentiated malignant compared with all
benign lesions. A cutoff value of 0.32 for this model provided the positive likelihood ratio of 4.67 with a sensitivity of 83.3% and specificity of 82.1%, and it correctly characterized 82% lesions. (On-line Table 5).
DISCUSSION
A vertebral lesion may be diagnosed with x-ray, CT, and other imaging modalities such as hybrid single-photon emission CT. Among all imaging techniques available, MR imaging is the method of choice in spinal pathology because of its excellent tis-sue contrast.10,23Overdiagnosis due to the limited specificity of
[image:6.594.58.529.48.517.2]spinal tuberculosis, which mimics a malignant condition, is a fre-quent diagnosis in our experience.22It is challenging to
distin-guish atypical variants of spinal tuberculosis from malignancy, especially in the early stage when the isolated vertebral body does not involve any soft-tissue component, adjacent disc involve-ment, or abscess formation.
Quantitative parameters derived from the mpMRI approach using a combination of DWI and in-phase/opposed-phase imag-ing could improve patient management. In this study, we have presented 3 statistical models for predicting the probability of malignant vertebral lesions for proper patient management using the mpMRI methods.
DWI has been used previously in various diseases.26-29Initial
studies showed that qualitative DWI offers no advantage over conventional unenhanced MR imaging in the detection of verte-bral lesions.10-12,30Quantitative DWI studies using ADC maps
also showed overlapping results in differentiating various verte-bral lesions.31,32Balliu et al32reported no significant difference in
ADC values for differentiating infectious and malignant lesions. In contrast, our study showed a significant difference in ADC values of malignant and infectious vertebral lesions, which could help differentiate malignant and benign vertebral lesions. We ob-served the lowest ADC values for malignant lesions, the highest ADC values for noninfectious benign lesions, and values in the intermediate range for infectious lesions. A similar trend of ADC values for malignant, acute benign, and infectious vertebral le-sions was observed by Dewan et al.33However, in contrast to our
study, they observed overlapping mean ADC values between tu-berculous spondylodiscitis and malignant compression fracture. Palle et al31reported considerable overlap of ADC values in
met-astatic and tubercular vertebrae. The cutoff value of the ADC determined in our study could be helpful in differentiating vari-ous vertebral lesions. An important aspect of the present study is the method of ROI placement and the relatively larger patient population. In contrast to the ADC calculation method used in previous studies, the circular ROIs were placed at the site of max-imum restriction observed on the ADC images in this study.33
Furthermore, using the established cutoff in our study, we could achieve higher sensitivity, specificity, and AUC for various predic-tive models in differentiating vertebral lesions. We could correctly classify⬎80% of various vertebral lesions using the different sta-tistical models.
In-phase/opposed-phase imaging quantifies fat in tissues be-cause water and fat protons have different precession frequencies and are in-phase at a TE of 4.8 ms and are 180° opposed at a TE of 2.4 ms at 1.5T. The presence of both fat and water in normal marrow results in suppression of signal intensity on the opposed-phase images. In benign compression fractures, no marrow-re-placing process occurs, so there is signal loss in opposed-phase images. In case of malignant lesions, the bone marrow fat is re-placed by tumor cells, so there is a lack of signal loss on opposed-phase images. Therefore, a substantial decrease in signal intensity occurs in normal vertebrae and for benign lesions, but malignant lesions exhibit either a minimal decrease or an increase in signal intensity.34
A similar trend in our study was also observed. The mean SIR in this study was found to be highest in malignant lesions and
lowest in the noninfectious benign lesions. We found that the SIR of affected vertebrae was 0.80 in infectious vertebral lesions, 0.75 in noninfectious benign lesions, and 0.98 in malignant lesions. An optimal cutoff value of SIR was also calculated to differentiate infectious, noninfectious benign, and malignant vertebral lesions. We could differentiate noninfectious benign and malignant ver-tebral lesions as well as infectious and malignant verver-tebral lesions with a high sensitivity and specificity using cutoffs for the SIR value of 0.90 and 0.91, respectively. This result coincides with the results of previous studies performed with in-phase/opposed-phase imaging in vertebral lesions.9,20Disler et al20reported a
relative SIR of 1.03⫾0.13 for the neoplastic group and 0.62⫾ 0.13 for the non-neoplastic group, and a ratio cutoff value of 0.81 resulted in a 95% sensitivity and a 95% specificity for detection of neoplasms. Erly et al9reported that the mean SIR for benign lesions
was 0.58 compared with a malignant lesion cutoff of 0.98, and if 0.80 was chosen as a cutoff, it correctly identifies malignant and benign lesions with a sensitivity of 0.95 and a specificity of 0.89.9Our
find-ings are consistent with those in that previous study.9
A major strength of this study was developing statistical mod-els for malignant vertebral lesions using mpMRI and determining thresholds for different parameters of mpMRI. Multivariate logis-tic regression analysis showed ADC and SIR as independent pre-dictors of malignancy in vertebral lesions. On the basis of the mean ADC and SIR, we established automated statistical models that would be helpful in differentiating vertebral lesions. Various predictive models demonstrated excellent validation with leave-one-out analysis.
Our study has several limitations. We recruited patients irre-spective of their duration of symptoms (ie, both acute and chronic cases of vertebral lesions) because most of the patients in our institution had poor socioeconomic status and there is a tendency to avoid the costly investigations until later in the disease progres-sion. Another limitation was the modest number of noninfectious benign cases compared with infectious and malignant vertebral lesions. Spinal tuberculosis is more common and a major public health hazard in developing nations such as India, and a similar proportion of the infectious group was reflected in our study. Osteoporotic compression forms a large proportion of noninfec-tious benign group and is more likely to be managed conserva-tively. Such patients are less likely to undergo biopsy and hence are under-represented in our study population. The ADC and SIR values were recorded before the CT-guided FNA/biopsy. Because the same radiologists were involved in biopsy procedures as well, performance bias cannot be ignored completely. Although all the models established in this study provided high accuracy in differ-entiating various vertebral lesions, the output of models needs to be externally validated in a larger study; therefore, future prospec-tive studies are warranted.
CONCLUSIONS
ACKNOWLEDGMENTS
The authors thank Dr Josh Greer, Radiology, University of Texas Southwestern Medical Center, Dallas, Texas, for help in language correction and many useful comments.
Disclosures: Alok K. Dwivedi—UNRELATED:Consultancy: Texas Tech University Health Sciences Center El Paso*;Grants/Grants Pending: National Institutes of Health, Cancer Prevention and Research Institute of Texas*; Travel/Accommoda-tions/Meeting Expenses Unrelated to Activities Listed: Joint Statistical Meeting, Conference on Statistical Practices. Ravindra Kumar Garg—RELATED:Payment for Writing or Reviewing the Manuscript: MedLink Neurology,Comments: 22 chapters for this e-book. *Money paid to the institution.
REFERENCES
1. Cue´nod CA, Laredo JD, Chevret S, et al.Acute vertebral collapse due to osteoporosis or malignancy: appearance on unenhanced and gadolinium-enhanced MR images.Radiology 1996;199:541– 49
CrossRef Medline
2. An HS, Andreshak TG, Nguyen C, et al.Can we distinguish between benign versus malignant compression fractures of the spine by mag-netic resonance imaging? Spine (Phila Pa 1976) 1995;20:1776 – 82
CrossRef Medline
3. Yuh WT, Zachar CK, Barloon TJ, et al.Vertebral compression fractures: distinction between benign and malignant causes with MR imaging.Radiology1989;172:215–18CrossRef Medline
4. Baur A, Sta¨bler A, Arbogast S, et al.Acute osteoporotic and neoplas-tic vertebral compression fractures: fluid sign at MR imaging. Ra-diology2002;225:730 –35CrossRef Medline
5. Dwivedi DK, Kumar R, Bora GS, et al.Stratification of the aggres-siveness of prostate cancer using pre-biopsy multiparametric MRI (mpMRI).NMR Biomed2016;29:232–38CrossRef Medline
6. Kimura M, da Cruz LC Jr.Multiparametric MR imaging in the as-sessment of brain tumors.Magn Reson Imaging Clin N Am2016;24: 87–122CrossRef Medline
7. Rahbar H, Partridge SC.Multiparametric MR imaging of breast cancer.
Magn Reson Imaging Clin N Am2016;24:223–38CrossRef Medline
8. Ro SR, Asbach P, Siebert E, et al.Characterization of orbital masses by multiparametric MRI.Eur J Radiol2016;85:324 –36CrossRef Medline
9. Erly WK, Oh ES, Outwater EK.The utility of in-phase/opposed-phase imaging in differentiating malignancy from acute benign compression fractures of the spine.AJNR Am J Neuroradiol2006;27: 1183– 88Medline
10. Castillo M, Arbelaez A, Smith JK, et al.Diffusion-weighted MR im-aging offers no advantage over routine noncontrast MR imim-aging in the detection of vertebral metastases.AJNR Am J Neuroradiol2000; 21:948 –53Medline
11. Maeda M, Sakuma H, Maier SE, et al.Quantitative assessment of diffusion abnormalities in benign and malignant vertebral com-pression fractures by line scan diffusion-weighted imaging.AJR Am J Roentgenol2003;181:1203– 09CrossRef Medline
12. Zhou XJ, Leeds NE, McKinnon GC, et al.Characterization of benign and metastatic vertebral compression fractures with quantitative diffusion MR imaging.AJNR Am J Neuroradiol2002; 23:165–70Medline
13. Israel GM, Korobkin M, Wang C, et al.Comparison of unenhanced CT and chemical shift MRI in evaluating lipid-rich adrenal adeno-mas.AJR Am J Roentgenol2004;183:215–19CrossRef Medline
14. Namimoto T, Yamashita Y, Mitsuzaki K, et al.Adrenal masses: quan-tification of fat content with double-echo chemical shift in-phase and opposed-phase FLASH MR images for differentiation of adre-nal adenomas.Radiology2001;218:642– 46CrossRef Medline
15. Haider MA, Ghai S, Jhaveri K, et al.Chemical shift MR imaging of hyperattenuating (>10 HU) adrenal masses: does it still have a role?
Radiology2004;231:711–16CrossRef Medline
16. Earls JP, Krinsky GA.Abdominal and pelvic applications of op-posed-phase MR imaging.AJR Am J Roentgenol1997;169:1071–77
CrossRef Medline
17. Rofsky NM, Weinreb JC, Ambrosino MM, et al.Comparison between in-phase and opposed-phase T1-weighted breath-hold FLASH se-quences for hepatic imaging.J Comput Assist Tomogr1996;20:230 –35
CrossRef Medline
18. Baker LL, Goodman SB, Perkash I, et al.Benign versus pathologic compression fractures of vertebral bodies: assessment with con-ventional spin-echo, chemical-shift, and STIR MR imaging. Radiol-ogy1990;174:495–502CrossRef Medline
19. Rosen BR, Fleming DM, Kushner DC, et al.Hematologic bone mar-row disorders: quantitative chemical shift MR imaging.Radiology
1988;169:799 – 804CrossRef Medline
20. Disler DG, McCauley TR, Ratner LM, et al.In-phase and out-of-phase MR imaging of bone marrow: prediction of neoplasia based on the detection of coexistent fat and water.AJR Am J Roentgenol
1997;169:1439 – 47CrossRef Medline
21. Eito K, Waka S, Naoko N, et al.Vertebral neoplastic compression fractures: assessment by dual-phase chemical shift imaging.J Magn Reson Imaging2004;20:1020 –24CrossRef Medline
22. Garg RK, Somvanshi DS.Spinal tuberculosis: a review.J Spinal Cord Med2011;34:440 –54CrossRef Medline
23. Daffner RH, Lupetin AR, Dash N, et al.MRI in the detection of ma-lignant infiltration of bone marrow.AJR Am J Roentgenol1986;146: 353–58CrossRef Medline
24. Baur A, Sta¨bler A, Bruning R, et al.Diffusion-weighted MR imaging of bone marrow: differentiation of benign versus pathologic com-pression fractures.Radiology1998;207:349 –56CrossRef Medline
25. Spuentrup E, Buecker A, Adam G, et al.Diffusion-weighted MR im-aging for differentiation of benign fracture edema and tumor infil-tration of the vertebral body.AJR Am J Roentgenol2001;176:351–58
CrossRef Medline
26. Durando M, Gennaro L, Cho GY, et al.Quantitative apparent diffu-sion coefficient measurement obtained by 3.0Tesla MRI as a poten-tial noninvasive marker of tumor aggressiveness in breast cancer.
Eur J Radiol2016;85:1651–58CrossRef Medline
27. Dwivedi DK, Kumar R, Bora GS, et al.Multiparametric MR can iden-tify high grade prostatic intraepithelial neoplasia (HGPIN) lesions and predict future detection of prostate cancer in men with a nega-tive initial prostate biopsy.Magn Reson Imaging2016;34:1081– 86
CrossRef Medline
28. Traboulsee A, Simon JH, Stone L, et al.Revised recommendations of the Consortium of MS Centers Task Force for a standardized MRI protocol and clinical guidelines for the diagnosis and follow-up of multiple sclerosis. AJNR Am J Neuroradiol2016;37:394 – 401
CrossRef Medline
29. Yanagihara TK, Grinband J, Rowley J, et al.A simple automated method for detecting recurrence in high-grade glioma.AJNR Am J Neuroradiol2016;37:2019 –25CrossRef Medline
30. Padhani AR, Liu G, Koh DM, et al.Diffusion-weighted magnetic resonance imaging as a cancer biomarker: consensus and recom-mendations.Neoplasia2009;11:102–25CrossRef Medline
31. Palle L, Reddy MB, Reddy KJ.Role of magnetic resonance diffusion imaging and apparent diffusion coefficient values in the evaluation of spinal tuberculosis in Indian patients.Indian J Radiol Imaging
2010;20:279 – 83CrossRef Medline
32. Balliu E, Vilanova JC, Pela´ez I, et al.Diagnostic value of apparent diffusion coefficients to differentiate benign from malignant verte-bral bone marrow lesions.Eur J Radiol2009;69:560 – 66CrossRef Medline
33. Dewan KA, Salama AA, El habashy HM, et al.Evaluation of benign and malignant vertebral lesions with diffusion weighted magnetic resonance imaging and apparent diffusion coefficient measure-ments.The Egyptian Journal of Radiology and Nuclear Medicine2015; 46:423–33CrossRef