ORIGINAL RESEARCH
BRAIN
Evaluating the Effects of White Matter Multiple Sclerosis
Lesions on the Volume Estimation of 6 Brain Tissue
Segmentation Methods
S. Valverde,XA. Oliver, Y. Díez, M. Cabezas, J.C. Vilanova, L. Ramio´-Torrenta`, A`. Rovira, and X. Llado´
ABSTRACT
BACKGROUND AND PURPOSE: The accuracy of automatic tissue segmentation methods can be affected by the presence of hypoin-tense white matter lesions during the tissue segmentation process. Our aim was to evaluate the impact of MS white matter lesions on the brain tissue measurements of 6 well-known segmentation techniques. These include straightforward techniques such as Artificial Neural Network and fuzzy C-means as well as more advanced techniques such as the Fuzzy And Noise Tolerant Adaptive Segmentation Method, fMRI of the Brain Automated Segmentation Tool, SPM5, and SPM8.
MATERIALS AND METHODS: Thirty T1-weighted images from patients with MS from 3 different scanners were segmented twice, first including white matter lesions and then masking the lesions before segmentation and relabeling as WM afterward. The differences in total tissue volume and tissue volume outside the lesion regions were computed between the images by using the 2 methodologies.
RESULTS:Total gray matter volume was overestimated by all methods when lesion volume increased. The tissue volume outside the lesion regions was also affected by white matter lesions with differences up to 20 cm3on images with a high lesion load (⬇50 cm3). SPM8 and Fuzzy And Noise Tolerant Adaptive Segmentation Method were the methods less influenced by white matter lesions, whereas the effect of white matter lesions was more prominent on fuzzy C-means and the fMRI of the Brain Automated Segmentation Tool.
CONCLUSIONS: Although lesions were removed after segmentation to avoid their impact on tissue segmentation, the methods still overestimated GM tissue in most cases. This finding is especially relevant because on images with high lesion load, this bias will most likely distort actual tissue atrophy measurements.
ABBREVIATIONS:ANN⫽Artificial Neural Network; FANTASM⫽Fuzzy And Noise Tolerant Adaptive Segmentation Method; FAST⫽FMRIB Automated Segmen-tation Tool; FCM⫽fuzzy C-means; H1⫽Hospital Vall d’Hebron, Barcelona, Spain; H2⫽Hospital Universitari Dr. Josep Trueta, Girona, Spain; H3⫽Clinica Girona, Girona, Spain; WML⫽white matter lesion
D
uring the past few years, MR imaging brain tissue segmenta-tion techniques have become important tools in the clinical evaluation and progression of MS because they make it possible to measure the changes in brain atrophy and lesion load.1-3How-ever, white matter lesions (WMLs) can significantly affect tissue volume measurements if these lesions are included in the segmen-tation process.4-6 Several studies have analyzed the effects of
WMLs on brain tissue measurements of common segmentation
techniques such as SPM5 (http://www.fil.ion.ucl.ac.uk/spm/)7
and FMRIB Automated Segmentation Tool (FAST, http://fsl. fmrib.ox.ac.uk/fsl/fslwiki/FAST).8Chard et al5studied the effect of
synthetic lesions on SPM5 segmentations for different WML voxel intensities (from 30% to 90% of normal WM intensity) and lesion loads (from 10 to 20 cm3). The authors reported that GM volume
was overestimated by⬇2.3%, whereas WM tissue was underesti-mated by⬇3.6% in scans with 15 cm3of simulated lesions. More
recently, Battaglini et al4also analyzed the effects of different WML
intensities and lesion loads on tissue measurements obtained with FAST software. The authors showed again that total GM volume tended to increase with higher lesion loads in segmented images with generated simulated lesions. Gelineau-Morel et al6performed a
sim-ilar study on the effects of simulated and real WMLs but on tissue volume measurements outside lesion regions. The authors reported that on images with simulated lesions, FAST clearly underestimated GM outside lesion regions as long as lesion volume increased and lesion intensities approximated those of GM tissue. The incidence of Received August 19, 2014; accepted after revision December 20.
From the Computer Vision and Robotics Group (S.V., A.O., Y.D., X.L.), University of Girona, Campus Montilivi, Girona, Spain; Girona Magnetic Resonance Center (J.C.V.), Girona, Spain; Multiple Sclerosis and Neuroimmunology Unit (L.R.-T.), Dr. Josep Trueta University Hospital, Institut d’Investigacio´ Biome`dica de Girona, Girona, Spain; and Magnetic Resonance Unit (M.C., A.R.), Department of Radiology, Vall d’Hebron University Hospital, Barcelona, Spain.
Please address correspondence to Sergi Valverde, Ed. P-IV, Campus Montilivi, Uni-versity of Girona, 17071 Girona, Spain; e-mail: [email protected]
Indicates open access to non-subscribers at www.ajnr.org
WMLs on real scans was smaller, but FAST still tended to underesti-mate GM with increasing lesion loads.
On the other hand, various studies have also analyzed the cor-relation between brain tissue atrophy and MS disability progres-sion.9,10These studies showed a brain atrophy decrease rate
be-tween 0.3% and 0.5% of change in brain parenchyma per year in patients with MS,9,10with a decrease in GM and WM volume of
up to 0.4% and 0.2% per year, respectively.10This statement along
with study results such as those found by Battaglini et al4and
Gelineau-Morel et al6indicates that a portion of brain atrophy
could be hidden by the inclusion of WMLs on tissue segmentation.
In this study, we performed a quantitative evaluation of the effects of WMLs on brain tissue volume measurements to analyze the extent to which tissue estimations are affected by changes in WML volume and intensity. In contrast to other similar stud-ies,4-6our analysis extended the number of segmentation
meth-ods involved, offering a comparative evaluation of the effects of WMLs on the volume measurements of 6 segmentation methods. Furthermore, given the reported correlation between brain atro-phy rates and disability progression,9,10it can be clinically
rele-vant for the MS community to extend the analysis of the effects of simulated WML to real data of patients with MS; hence, our anal-ysis was focused exclusively on data from the T1-weighted images from patients with clinically confirmed MS.
MATERIALS AND METHODS
Image Acquisition
The dataset consisted of 30 MR images from patients with clini-cally confirmed MS at 3 different hospitals (Fig 1). Each patient underwent MR imaging by using the same protocol (T1-weighted, T2-(T1-weighted, proton-attenuation-(T1-weighted, and FLAIR images), though a different scanner was used at each hos-pital. Ten patient images from Hospital Vall d’Hebron, Barce-lona, Spain, (H1) were acquired on a 1.5T Magnetom Symphony Quantum (Siemens, Erlangen, Germany), with 2D conventional spin-echo T1-weighted (TR, 450 ms; TE, 17 ms), dual-echo pro-ton-attenuation T2-weighted sequences (TR, 3750 ms; TE, 14/86 ms), and FLAIR sequences (TR, 9000 ms; TE, 114 ms; and TI, 2500 ms). Ten patient images from Hospital Universitari Dr. Jo-sep Trueta, Girona, Spain, (H2) were acquired on a 1.5T Intera scanner (R12) (Philips Healthcare, Best, the Netherlands) with 2D conventional spin-echo T1-weighted (TR, 653 ms; TE, 14 ms), dual-echo proton-attenuation T2-weighted (TR, 2800 ms; TE, 16/80 ms), and FLAIR sequences (TR, 8153 ms; TE, 105 ms; and TI, 2200 ms). Ten patient images from Clinica Girona, Girona, Spain, (H3) were acquired on a 1.5T Signa HDxt scanner (GE Healthcare, Milwaukee, Wisconsin) with 3D fast-spoiled gradient T1-weighted (TR, 30 ms; TE, 9 ms; flip-angle, 30°), fast spin-echo T2-weighted (TR, 5000 –5600 ms; TE, 74 –77 ms), proton-atten-uation-weighted (TR, 2700 ms; TE, 11.9 ms), and FLAIR se-quences (TR, 9002 ms; TE, 80 ms; and TI, 2250 ms). All images were acquired in the axial view with a section thickness of 3 mm.
Images of Patients with MS
WML masks were semiautomatically delineated from proton-atten-uation-weighted images by using Jim software (Xinapse Systems,
http://www.xinapse.com/home.php) by expert radiologists at each hospital. Then, the proton-attenuation-weighted images and lesion masks were coregistered with T1-weighted images by affine registra-tion.11The average means and SD lesion volumes for H1, H2, and H3
were 4.15⫾4.35 cm3(minimum⫽0.11, maximum⫽11.22 cm3),
21.79⫾17.79 cm3(minimum⫽0.18, maximum⫽52.45 cm3), and
4.78⫾4.60 cm3(minimum⫽0.43, maximum⫽16.34 cm3).
All T1-weighted patient images were processed following the same pipeline (Fig 2). Internal skull-stripping and intensity-cor-rection options were disabled on SPM5, SPM8 (http://www.fil. ion.ucl.ac.uk/spm/software/), and FAST. Instead, to reduce the differences in brain area and signal image intensity produced by different preprocessing tools, we skull-stripped all images by using the Brain Extraction Tool (http://fsl.fmrib.ox.ac.uk/fsl/ fslwiki/BET)12and intensity-corrected them by using N3.13
As a second step, 2 sets were produced from preprocessed images: an original set that included WMLs as part of current tissue and a masked set in which the WMLs were masked out before tissue segmentation and relabeled as WM after, following the same procedure used by radiologists of the 3 hospitals.
Segmentation Methods
[image:2.594.326.507.47.370.2]SPM8. ANN and FCM were implemented for our study, while the rest of the methods were obtained from available repositories. The ANN method is based on self-organizing maps, also known as Kohonen networks.14ANN was implemented for our study by
using the Matlab 7.12 environment (MathWorks, Natick, Massa-chusetts) following the technique proposed by Tian et al.15FCM16
and FANTASM17are both based on fuzzy-clustering techniques.
FCM implements the classic fuzzy-clustering approach, while FANTASM adds neighboring information to increment the ro-bustness of the method to intensity inhomogeneity artifacts and noise. FCM was also implemented by using the Matlab environ-ment and following the technique described in Pham,16in which
clusters were initialized according to Bezdek et al.18FANTASM is
included in the MIPAV toolbox (http://mipav.cit.nih.gov). FAST8guides the segmentation with spatial information through
the optimization of Hidden Markov Random Fields, and the method is included in the fMRI of the Brain Software Library toolbox (http://fsl.fmrib.ox.ac.uk/fsl/fslwiki/). SPM5 and SPM87
are based on an iterative Gaussian Mixture Model optimization, weighting the probability of belonging to a certain tissue class with a priori spatial information from tissue-probability atlases. How-ever, SPM8 comes with a set of different characteristics to im-prove registration and tissue segmentation. Both methods are in-cluded in the SPM8 toolbox (http://www.fil.ion.ucl.ac.uk/spm/ software/spm8). All methods were run with default parameters.
Evaluation
Images from both the original and masked sets were segmented into GM, WM, and CSF tissue classes by using the 6 presented segmentation methods. Then, we computed the normalized tis-sue volumes as the number of voxels classified as GM, WM, and CSF, respectively, divided by the total number of voxels. Three different analyses were performed on these data. First, we ana-lyzed how lesion voxels were classified by each segmentation
method to establish to what extent the tissue volumes reported by each algorithm on the original and masked images could be expected to be different. Second, we analyzed the direct effect of lesions in the global volume estimation by computing the differences in total tissue volume as the percentage of change between original and masked images. For example, in the case of GM tissue:
%GM⫽NGMVOriginal⫺NGMVMasked
NGMVMasked ⫻
100,
whereNGMVOriginalandNGMVMaskedstand for the normalized gray matter volumes of original and masked images, respectively. Third, we also investigated the indirect effects of lesions in the rest of the tissue volume outside lesion regions. These are tissue vol-ume estimations that incorporate lesions in the segmentation process but do not consider them when the volume is evaluated.
Statistical Analysis
The correlation among factors (differences in tissue volume, le-sion load, and lele-sion intensity) was calculated by using Pearson linear correlation coefficient (r). The significance level␣was set at .05. This level was used both for confidence interval computation and 95% significance hypothesis 2-tailed ttests. All statistical analyses were calculated by using the Matlab environment.
RESULTS
Lesion Classification
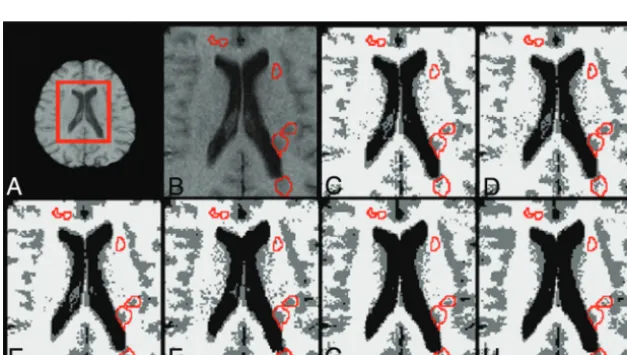
Figure 3 depicts the percentage of WML voxels classified either as WM (Fig 3, top) or GM (Fig 3, bottom). Percentages are detailed for each segmentation method and hospital. The amount of WMLs that were classified as GM varied for each method, mostly due to the differences among algorithms. Figure 4 illustrates the differences among methods by showing the output classification performed by each of the 6 segmentation methods.
[image:3.594.55.531.46.266.2]els as GM and WM between hospitals can be attributed to each particular scanner acquisition configuration that defines the tis-sue signal-intensity distributions. The distance between WML and WM mean signal intensities was highest in H3 as computed by each of the 6 methods (range, from 89.2⫾4.45% to 92.22⫾ 4.45% of WML mean signal intensity with respect to WM) and was lowest in H2 (range, from 95.3⫾1.76% to 100.34⫾6.39%). As shown in Fig 1, there is a better contrast between GM and WM tissue on the H3 images compared with the H1 and H2 images.
The correlation between the percentage of lesion classification and lesion size was not significant in all cases (r⬍0.33,P⬎.05). In contrast, the percentage of WML classified as GM or WM and the distance between the mean WML and WM signal intensities showed a moderate correlation in all hospitals (r⬎0.6,P⬍.01). On the basis of our data, the contrast between tissues computed as the normalized difference between the mean GM and WM signal intensity distributions was correlated with the distance between the WM and WML mean signal intensities (r⫽0.6,P⬍.001).
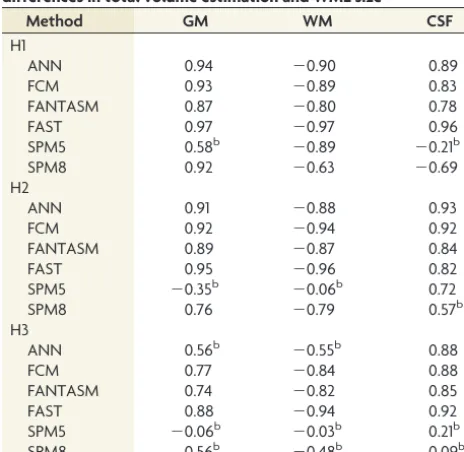
Differences in Total Tissue Volume Estimation
The mean percentage differences in total tissue volume between the original and masked images are presented in Table 1. All methods overestimated GM tissue in original scans, regardless of
the hospital, but the overestimation was increased in H2 com-pared with H1 and H3 due to greater lesion volumes in H2. The differences among methods for the same hospital and tissue were also significantly greater in H2 than in H1 and H3. Abnormally low mean and high SD values observed in SPM5 for both GM (0.10⫾2.68) and WM (1.04⫾3.01) in H2 were caused by 2 patients who exhibited very high opposite differences between their respective original and masked images, decreasing the over-all mean difference and increasing the SD.
Correlation between the differences in total mean tissue vol-ume and lesion size was significant in all hospitals: Lesion size had a direct effect on tissue segmentation. Table 2 shows the Pearson correlation values obtained between differences in tissue volume and lesion size across methods. All methods except SPM5 pre-sented a positive correlation in GM and a negative correlation in WM in H1 and H2. SPM5 correlated in H1 but not in H2, where it was influenced by abnormal values in the 2 images with highest lesion load. In H3, only FCM, FANTASM, and FAST were posi-tively correlated in GM and negaposi-tively correlated in WM. The correlation coefficients for ANN, SPM5, and SPM8 in H3 were weak and not significant in GM and WM.
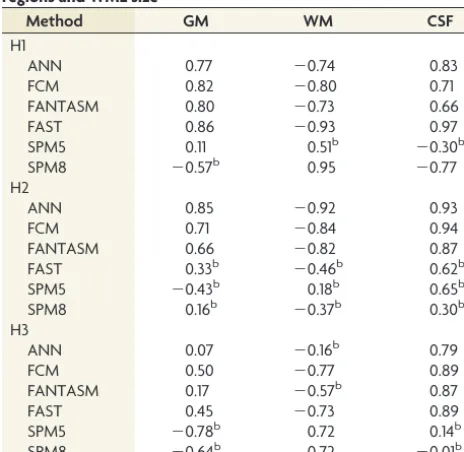
Volume Estimation of Tissue Outside Lesion Regions The mean percentage differences in tissue volume outside lesion regions between original and masked images are presented in Ta-ble 3. The differences between the images segmented with lesions and images in which the lesions were masked before tissue seg-mentation were again higher in H2, and the methods still substan-tially overestimated the GM outside the lesion regions to the det-riment of WM, even though analyzed tissues were free of lesion regions. In contrast, only SPM5 and SPM8 reported a noticeable underestimation of GM in H3, also to the detriment of WM.
Differences in tissue volume outside the lesion regions correlated with lesion size for all tissues and hospitals, indicating an effect of lesion size not only on lesion voxels but also on tissue that is not affected by lesions. Table 4 presents the correlation values obtained across methods. In H1, there was a remarkable correlation for ANN, FCM, FANTASM, and FAST in all tissues. The obtained values for SPM8 were also significant in GM and CSF. In H2, the correlation was significant in ANN, FCM, and FANTASM in all tis-sues. In H3, only FCM and FAST showed a significant correlation in all tissues, whereas FCM, FAST, SPM5, and SPM8 correlated significantly only in WM. All methods except SPM5 and SPM8 re-ported a significant correlation for CSF.
DISCUSSION
Previous studies have shown that the range of voxel signal intensities compos-ing each of the tissue distributions can be altered by WMLs if these voxels are included in the segmentation process.4,5
Lesion load and the apparent lesion sig-nal intensity lead to observed changes in tissue segmentation in original images. FIG 3. Percentage of voxels in WML regions having been classified as
GM (top) and WM (bottom) for each segmentation method and hos-pital, H1 (䉫), H2 (䡺) or H3 (E). Reported values are means and SDs.
[image:4.594.54.286.340.464.2] [image:4.594.58.372.511.688.2]For instance, if a portion of the lesion voxels is classified as WM, the mean overall WM intensity decreases, shifts WM boundaries into darker intensities, and narrows GM tissue distribution.4,6
Voxels that should have been classified as GM are assigned to WM, increasing the WM volume estimation and decreasing GM volume. If some of the WML voxels are classified as GM, the apparent GM mean intensity increases and the WM tissue distri-bution narrows. This change occurs because voxels that are theo-retically classified as WM are assigned to GM, increasing GM estimation against a lower WM volume estimation.
We compare our results with those in previous studies regard-ing the effects of WMLs on brain tissue volume measurements. However, given the differences in image data, criterion standards, simulated lesions, and lesion voxel intensities among studies, a direct comparison further than an analysis of trends with similar WML intensities and lesion loads should be carefully performed. Our experiments follow the same trend presented by Battaglini et al,4and both studies show that FAST overestimates total GM
volume on images segmented with lesions. Similarly, our results also coincide with those found by Chard et al5in simulated data,
and in both studies, SPM5 overestimated GM tissue on images with lesions. In contrast, our results appear to be inconsistent with those reported by Gelineau-Morel et al.6These studies showed a
significant correlation between WML intensity and an
underesti-mation of GM volume outside the lesions, especially when the lesions had intensities similar to those of the mean GM. The ob-served differences are caused by distinct signal-intensity profiles of WMLs in each study. In the case of Gelineau-Morel et al,6the
WML signal intensities were noticeably more hypointense com-pared with our data. The probability of voxels to be classified as GM dropped as a result of the influence of hypointense WML intensities in tissue distributions. Part of WML voxels with a sig-nal intensity similar to that of GM were still classified as WM, reducing the signal intensity threshold between GM and WM. As a result, most of the partial volume voxels with signal intensity in the boundary between GM and WM were classified as WM, arti-ficially reducing the overall number of GM voxels.
Our results show that the classification of WML regions is highly dependent on lesion voxel signal intensities and the varia-tion of their signal intensity in terms of the WM signal distribu-tion. Lesion segmentation is clearly determined by this variation because the probability of WML voxels being classified as WM will be higher as long as WML intensities resemble those of WM. However, the signal-intensity contrast among tissues also plays an important role because it can influence the amount of WML vox-els that are classified as GM or WM. As long as the contrast among distributions increases, more lesion voxels will be added into the GM distribution. Although the main factor in the observed dif-ferences in tissue volume across methods is caused by lesion vol-ume, the percentage of lesion voxels that are classified as GM and WM might also be a remarkable factor in the observed tissue-volume differences, especially in images with high lesion loads. Therefore, the relationship between image quality and lesion load also might have to be considered to explain the differences in tissue volume.
SPM8 was the method with the lowest difference in total tissue volume between original and masked images. In contrast, FAST was the method that was more affected by lesions. In general, all methods overestimated GM in original scans, though values were more significant in H2 than H1 and H3 due to higher lesion loads in H2. In H1 and H3, most of the underestimated WM was shifted into GM. The small percentage of lesions that were segmented as CSF, especially the low lesion volume, limited the impact of WML voxels on the overall CSF tissue distribution of original images.
[image:5.594.54.532.56.145.2]SPM8 and FANTASM were the methods with the lowest inci-dence of WML in tissue volume measurements outside lesion regions, while FCM and FAST showed the largest differences among all methods. Lesion volume also explains the limited effect of WML on tissue segmentation outside lesion regions in H1 and H3, compared with images with higher lesion loads such as the H2 images. In H1 and H3, although the behavior differs slightly for Table 1: Average percentage of change in total tissue volume estimation between original and masked imagesa
Method
H1 H2 H3
GM WM CSF GM WM CSF GM WM CSF
ANN 0.33⫾0.42 ⫺0.23⫾0.28 0.11⫾0.11 1.59⫾1.37 ⫺0.56⫾0.46 0.78⫾0.76 0.25⫾0.31 ⫺0.16⫾0.28 ⫺0.09⫾0.09 FCM 0.28⫾0.37 ⫺0.22⫾0.29 0.09⫾0.11 2.28⫾2.26 ⫺0.90⫾0.83 0.94⫾0.90 0.28⫾0.23 ⫺0.25⫾0.20 0.08⫾0.09 FANTASM 0.23⫾0.26 ⫺0.18⫾0.21 0.08⫾0.08 1.34⫾1.13 ⫺0.49⫾0.37 0.80⫾0.73 0.26⫾0.22 ⫺0.24⫾0.19 0.07⫾0.08 FAST 0.29⫾0.36 ⫺0.29⫾0.36 0.12⫾0.13 1.92⫾1.59 ⫺1.28⫾1.03 0.47⫾0.39 0.34⫾0.28 ⫺0.37⫾0.31 0.12⫾0.17 SPM5 0.20⫾0.30 ⫺0.21⫾0.20 ⫺0.14⫾0.54 0.10⫾2.68 ⫺1.04⫾3.01 0.53⫾0.51 0.04⫾0.17 ⫺0.18⫾0.36 0.15⫾0.23 SPM8 0.08⫾0.09 ⫺0.08⫾0.08 ⫺0.04⫾0.18 0.55⫾0.34 ⫺0.93⫾0.55 0.54⫾0.42 0.09⫾0.15 ⫺0.23⫾0.25 0.17⫾0.23
aThe results are divided by tissue and hospital. Reported values are the means⫾SD. Positive values indicate a tissue overestimation on original images compared with masked.
Table 2: Pearson correlation coefficients between method differences in total volume estimation and WML sizea
Method GM WM CSF
H1
ANN 0.94 ⫺0.90 0.89
FCM 0.93 ⫺0.89 0.83
FANTASM 0.87 ⫺0.80 0.78
FAST 0.97 ⫺0.97 0.96
SPM5 0.58b ⫺0.89 ⫺0.21b
SPM8 0.92 ⫺0.63 ⫺0.69
H2
ANN 0.91 ⫺0.88 0.93
FCM 0.92 ⫺0.94 0.92
FANTASM 0.89 ⫺0.87 0.84
FAST 0.95 ⫺0.96 0.82
SPM5 ⫺0.35b ⫺0.06b 0.72
SPM8 0.76 ⫺0.79 0.57b
H3
ANN 0.56b ⫺0.55b 0.88
FCM 0.77 ⫺0.84 0.88
FANTASM 0.74 ⫺0.82 0.85
FAST 0.88 ⫺0.94 0.92
SPM5 ⫺0.06b ⫺0.03b 0.21b
SPM8 0.56b ⫺0.48b 0.09b
a
Correlation was computed for each method and hospital separately. All values were found to be significant (Pvalue⬍.05) unless otherwise noted.
b
[image:5.594.53.285.181.407.2]each method, the differences in tissues outside the lesion regions are very small.
The differences outside the lesion regions are especially im-portant because they highlight the bias introduced by WMLs on the estimation of tissue volume that is not pathologically affected. If one compares the results between total tissue volume and tissue volume outside lesion regions, it can be observed that an impor-tant part of the overestimated total GM is essentially derived from the same hypointense WML voxels that are classified as GM. Moreover, it is important to highlight the differences in the algo-rithms. Methods such as FCM and ANN, which only rely on signal intensity, introduce more errors in tissue segmentation compared with methods such as SPM8 and SPM5, which incorporate spatial information. This reinforces the necessity for selecting a segmen-tation algorithm that does not depend on signal intensity only. However, even though WML voxels have not been considered for computing tissue volume outside the lesion regions, there is still a clear tendency toward overestimating GM. On images with a high lesion load, the observed differences in GM volume outside lesion regions reach values that are equivalent to the yearly expected GM atrophy.9,10 Following these assumptions, SPM8, FANTASM,
and SPM5 are the methods with the lowest reported incidence of
WML on brain tissue volume measurements, especially on images with a high lesion load.
The present study is not free of limitations. The principal lim-itation is the lack of tissue expert annotations, given that the study incorporated a relatively large number of images from 3 different hospitals and this task was time-consuming. A second limitation of the study is the sensitivity of the tissue segmentation methods to changes in the skull-stripping mask. Errors in the brain mask may lead to the inclusion of blood vessels such as the internal carotid arteries with hyperintense signal intensity, which might bias the tissue distributions. A final limitation of the study is the inherent difficulty of comparing previous studies, given the dif-ferences in the scanner protocols used to acquire the images of patients with MS. The differences in the acquisition protocol may cause the observed differences in the lesion intensity profile com-pared with previous works.8,10Our study shows that such an
in-tensity profile introduces variations in GM and WM tissue distributions.
CONCLUSIONS
The results of this study indicate a direct relationship between the differences in brain tissue volume and changes in lesion load and WML intensity. Of the analyzed methods, SPM8 exhibited the lowest incidence of WMLs in volume estimation, whereas FCM yielded the highest GM overestimation. Furthermore, all methods were affected by WMLs in tissue volume outside the lesion re-gions. SPM8 and FANTASM exhibited the lowest differences in tissue volume outside the lesion regions, whereas the influence of WMLs outside the lesion regions is more important in methods such as FCM and FAST. The latter results are especially important because even when masking lesions after segmentation to avoid the inclusion of lesion voxels segmented as GM into the volume estimation, the methods tend to overestimate GM tissue on im-ages segmented with lesions. On imim-ages with high lesion load, this bias might conceal or falsify part of the GM and WM tissue atrophy.
Disclosures: Sergi Valverde—RELATED:Grant: FI-DGR2013 research grant from the Generalitat de Catalunya. Mariano Cabezas—RELATED: holds a 2014 European Com-mittee for Treatment and Research in Multiple Sclerosis–Magnetic Resonance Imag-ing in MS research fellowship.
REFERENCES
1. Llado´ X, Oliver A, Cabezas M, et al.Segmentation of multiple scle-rosis lesions in brain MRI: a review of automated approaches. In-formation Sciences2012;186:164 – 85
2. Llado´ X, Ganiler O, Oliver A, et al.Automated detection of mul-tiple sclerosis lesions in serial brain MRI. Neuroradiology
[image:6.594.57.533.57.146.2]2012;54:787– 807
Table 3: Average percentage change in the volume estimation of tissue outside the lesion regions between original and masked scansa
Method
H1 H2 H3
GM WM CSF GM WM CSF GM WM CSF
ANN 0.15⫾0.26 ⫺0.10⫾0.18 0.07⫾0.08 0.70⫾0.61 ⫺0.31⫾0.24 0.67⫾0.69 ⫺0.01⫾0.28 0.04⫾0.24 ⫺0.12⫾0.08 FCM 0.09⫾0.16 ⫺0.07⫾0.13 0.05⫾0.08 1.27⫾1.69 ⫺0.56⫾0.62 0.82⫾0.81 0.01⫾0.03 ⫺0.03⫾0.05 0.05⫾0.07 FANTASM 0.06⫾0.05 ⫺0.05⫾0.05 0.03⫾0.05 0.48⫾0.48 ⫺0.25⫾0.18 0.68⫾0.63 0.00⫾0.04 ⫺0.02⫾0.05 0.04⫾0.07 FAST 0.08⫾0.14 ⫺0.09⫾0.14 0.07⫾0.08 0.56⫾0.87 ⫺0.45⫾0.64 0.22⫾0.33 0.02⫾0.07 ⫺0.06⫾0.13 0.08⫾0.16 SPM5 0.06⫾0.25 0.02⫾0.13 ⫺0.19⫾0.54 ⫺0.29⫾2.61 ⫺0.47⫾2.91 0.21⫾0.32 ⫺0.20⫾0.24 0.23⫾0.34 0.06⫾0.15 SPM8 ⫺0.03⫾0.06 0.09⫾0.15 ⫺0.10⫾0.23 0.13⫾0.30 ⫺0.29⫾0.33 0.25⫾0.26 ⫺0.15⫾0.12 0.14⫾0.15 0.10⫾0.20
aThe results are divided by hospital and tissue. Reported values are the means⫾SD. Positive values indicate a tissue overestimation on original images compared with masked.
Table 4: Pearson correlation coefficients among method differences in volume estimation of tissue outside the lesion regions and WML sizea
Method GM WM CSF
H1
ANN 0.77 ⫺0.74 0.83
FCM 0.82 ⫺0.80 0.71
FANTASM 0.80 ⫺0.73 0.66
FAST 0.86 ⫺0.93 0.97
SPM5 0.11 0.51b ⫺0.30b
SPM8 ⫺0.57b 0.95 ⫺0.77
H2
ANN 0.85 ⫺0.92 0.93
FCM 0.71 ⫺0.84 0.94
FANTASM 0.66 ⫺0.82 0.87
FAST 0.33b ⫺0.46b 0.62b
SPM5 ⫺0.43b 0.18b 0.65b
SPM8 0.16b ⫺0.37b 0.30b
H3
ANN 0.07 ⫺0.16b 0.79
FCM 0.50 ⫺0.77 0.89
FANTASM 0.17 ⫺0.57b 0.87
FAST 0.45 ⫺0.73 0.89
SPM5 ⫺0.78b 0.72 0.14b
SPM8 ⫺0.64b 0.72 ⫺0.01b
a
Correlation was computed for each method and hospital separately. All values were found to be significant (Pvalue⬍.05) unless otherwise noted.
b
[image:6.594.53.285.189.415.2]3. Zivadinov R, Bergsland N, Dolezai O, et al.Evolution of cortical and thalamus atrophy and disability progression in early relapsing-re-mitting MS during 5 years.AJNR Am J Neuroradiol2013;34:1931–39 4. Battaglini M, Jenkinson M, De Stefano N.Evaluating and reducing the impact of white matter lesions on brain volume measurements.
Hum Brain Mapp2012;33:2062–71
5. Chard DT, Jackson JS, Miller DH, et al.Reducing the impact of white matter lesions on automated measures of brain gray and white mat-ter volumes.J Magn Reson Imaging2010;32:223–28
6. Gelineau-Morel R, Tomassini V, Jenkinson M, et al.The effect of hypointense white matter lesions on automated gray matter seg-mentation in multiple sclerosis.Hum Brain Mapp2012;33:2802–14 7. Ashburner J, Friston K. Unified segmentation. Neuroimage
2005;26:839 –51
8. Zhang Y, Brady M, Smith S.Segmentation of brain MR images through a hidden Markov random field model and the expectation-maximization algorithm.IEEE Trans Med Imaging2001;20:45–57 9. Horsfield MA, Rovaris M, Rocca MA, et al.Whole-brain atrophy in
multiple sclerosis measured by two segmentation processes from various MRI sequences.J Neurol Sci2003;216:169 –77
10. Rudick RA, Lee JC, Nakamura K, et al.Gray matter atrophy corre-lates with MS disability progression measured with MSFC but not EDSS.J Neurol Sci2009;282:106 –11
11. Rueckert D, Sonoda LI, Hayes C, et al.Nonrigid registration using free-form deformations: application to breast MR images.IEEE Trans Med Imaging1999;18:712–21
12. Smith SM.Fast robust automated brain extraction.Hum Brain Mapp2002;17:143–55
13. Sled JG, Zijdenbos AP, Evans CP.A nonparametric method for au-tomatic correction of intensity nonuniformity in MRI data.IEEE Trans Med Imaging1997;17:87–97
14. Kohonen T. The self-organizing map. Proceedings of the IEEE
1990;78:1464 – 80
15. Tian D, Fan L.A brain MR images segmentation method based on SOM neural network.In:Proceedings of the 1st International Confer-enceonBioinformatics and Biomedical Engineering ICBBE,Wuhan, People’s Republic of China.July 6 – 8, 2007:686 – 89
16. Pham DL.Spatial models for fuzzy clustering.Computer Vision and Image Understanding2001;84:285–97