Modeling of Silicon Vapor Phase Epitaxy Using Stefan-Maxwell Formalism
Ramanujam Rajagopal and Yalamanchili Krishna Rao
Department of Materials Science and Engineering, Roberts Hall, Box 352120 University of Washington, Seattle, WA 98195, USAThe vapor-phase homoepitaxy of monocrystalline silicon by reduction of chlorosilanes is modeled using a novel approach. With digital computer calculation, the growth rate of silicon is predicted under ambient pressure (1.0 atm or 101.325 kPa) in the high-temperature regime 1200–1600 K, where silicon growth is expected to be mass-transport limited. This study considers four different initial stoichiometries, namely, 0.1% SiH4+ 0.4% HCl + H2, 0.1% SiCl4+ H2, 0.5% SiCl4+ H2, and 0.2% SiHCl3+ H2in the Si-Cl-H system in order to make comparisons
between the predicted and the experimentally determined growth rates. By combining the iterative equilibrium constant method with the Stefan-Maxwell relations for diffusion in a multi-component gas-phase, the respective molar fluxes of nine gaseous species that include SiCl4, SiHCl3,
SiH2Cl2, SiH3Cl, SiH4, SiCl2, SiCl, SiCl3, and Si(g) were computed for steady-state condition; and the data on fluxes enabled the determination
of the net silicon flux to the surface of the substrate. The computed rates were compared to the measured deposition rates of silicon.
(Received January 19, 2004; Accepted May 14, 2004)
Keywords: diffusion, virtual equilibrium, steady-state, silicon growth from vapor phase, chlorosilanes, molar fluxes, stagnant gas-film, inclined pedestal, temperature-gradient
1. Introduction
Vapor phase epitaxy (VPE) of silicon remains a main process route in the semiconductor industry.1) Current methods of conducting VPE growth of silicon are well-established, but room exists for fundamental models that can predict the growth rates for the set of parameters selected by the operator. The present work focuses on the reduction of chlorosilanes, a desirable method for homoepitaxy of silicon at high temperatures.
Bloem,2) Van den Brekel and Bloem,3) and Bloem and Claassen4)published valuable data on equilibria and kinetics of VPE of silicon; the respective effects of etching agents, temperature gradients, and mass-transfer of species to and from the growth surface have received careful study. Silicon growth in the diffusion-limited regime is especially interest-ing from the viewpoint of modelinterest-ing the behavior of species in the dynamic system at virtual (or near) equilibrium con-ditions. The best models are based upon thermodynamic analysis, requiring only free energy data and molecular diffusivities.
In this investigation, a model is presented for determining the equilibrium concentrations (or partial pressures) of species in a chlorosilane VPE system; and the mass-transport processes are described using Stefan-Maxwell formalism. In sum, these analyses are combined for predicting the growth rate of silicon in the diffusion-limited domain; and predic-tions are compared to the growth rate data of Bloem.2,5)
2. Gas-Phase Partial Pressures in Silicon VPE System
In the RF heated cold-wall reactor, silicon-bearing vapor species are introduced with a carrier gas. Usually, SiHCl3,
SiH2Cl2, SiH4or SiCl4is chosen as reactant, with hydrogen
reductant as the carrier.1)The gas-mixture admitted to the reactor subsequently attains the temperature of the susceptor (1100–1600 K); and several reactions occur at and within the boundary layer adjacent to the substrate.5,6) The delivery of the reactant and carrier gases is maintained such that the
bulk-gas stream composition is constant; and the gas/solid reactions that are listed in Table 1 occur at the silicon substrate surface, ensuring a steady-state condition.5–7)
The diffusion of gaseous species between the bulk-gas stream and the silicon-surface results in a virtual equilibrium state (which is a sub-set of the steady-state). The partial pressures of the various gas species at the solid-surface are computed by means of the iterative equilibrium constant method described by Rao.8) These data together with the bulk-gas pressures enable the determination of steady-state molar fluxes for the various silicon-bearing species; the net silicon flux is readily found by summation and the growth-rate (inmm/min) ascertained therefrom.
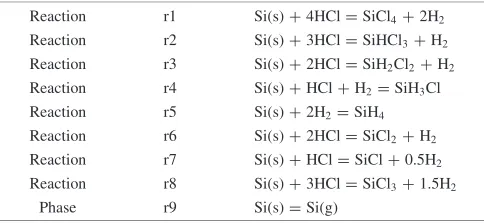
[image:1.595.305.547.331.443.2]Depending upon the entailed standard free energy change,6,9–13)the relative contribution to the VPE from each of the reactions (Table 1) varies widely. There are eleven species involved, with an atom-matrix rank of three, thus allowing a maximum of eight independent chemical reac-tions; the system has three degrees of freedom. To construct an equilibrium model for this system, the input gas composition, temperature, and pressure must be specified. Once these input conditions are defined, free energy equations are deduced for each of the reactions (Table 1) using thermodynamic data drawn from the foregoing pub-lications.6,9–13) The equations for the eight chemical equi-libria and solid/vapor-phase equilibrium spanning the 1200– 1600 K range are given in Table 2.
Table 1 Independent Reaction and Phase Equilibria in Si-Cl-H system.
Reaction r1 Si(s) + 4HCl = SiCl4+ 2H2
Reaction r2 Si(s) + 3HCl = SiHCl3+ H2
Reaction r3 Si(s) + 2HCl = SiH2Cl2+ H2
Reaction r4 Si(s) + HCl + H2= SiH3Cl
Reaction r5 Si(s) + 2H2= SiH4
Reaction r6 Si(s) + 2HCl = SiCl2+ H2
Reaction r7 Si(s) + HCl = SiCl + 0.5H2
Reaction r8 Si(s) + 3HCl = SiCl3+ 1.5H2
Phase r9 Si(s) = Si(g)
The Iterative Method of Rao8) is used to determine the equilibrium state for the Si-Cl-H system at a selected temperature in the 1200–1600 K range for specified input gas composition at 1.0 atm (= 101.325 kPa) total pressure. The Cl/H atom-ratio of the gas-phase remains the same, but the Si/Cl ratio falls as the system reaches equilibrium. The nine equilibrium constants (Table 1), total pressure and Cl/H ratio together provide eleven equations that enable one to determine partial pressures of species H2, HCl, Si, SiCl4,
SiHCl3, SiH2Cl2, SiH3Cl, SiH4, SiCl2, SiCl, and SiCl3. A
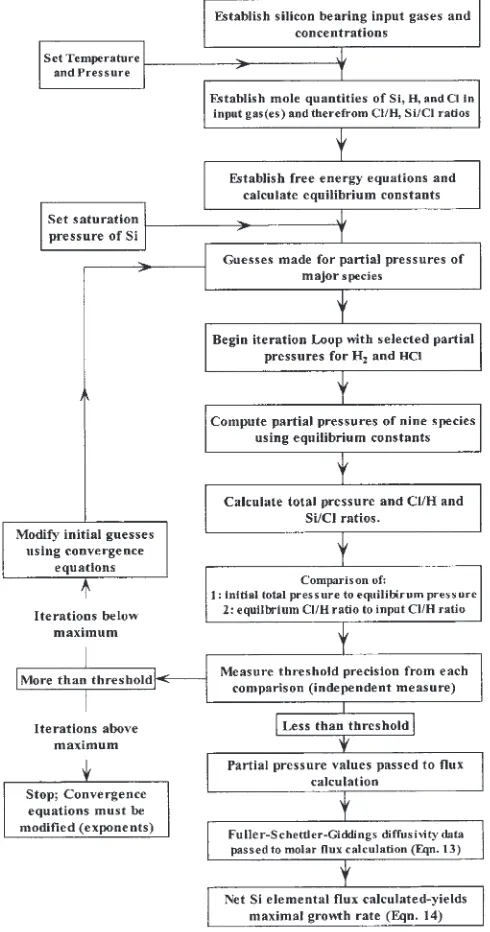
detailed description of the iterative equilibrium constant method has appeared in the literature.8)It is well to note that the flowchart of Fig. 1 provides a concise view of the iterative algorithm used in the present work.
Two ‘majors’-H2and HCl, in this case - are selected from
amongst the eleven species and reasonable (but arbitrary) guesses are made for their partial pressures. The non-linear equilibrium constant expressions, shown below, are then used to compute the partial pressures of the nine remaining species:
K1¼ ðPSiCl4P
2 H2Þ=P
4
HCl; PSiCl4¼K1 ðP
4 HCl=P
2 H2Þ
K2¼ ðPSiHCl3PH2Þ=P
3
HCl; PSiHCl3¼K2 ðP
3 HCl=PH2Þ
K8¼ ðPSiCl3P
1:5 H2Þ=P
3
HCl; PSiCl3¼K8 ðP
3 HCl=P
1:5 H2Þ
K9¼PSi; PSi¼K9
These results enable the calculation of total pressure (Pe) and Cl/H atom ratio (Re). It is seen that Pe6¼Po andRe6¼Ro wherePo¼1:0atm andRois the input gas Cl/H atom-ratio.
Pe¼
PSiCl4þPH2þPHClþPSiHCl3þPSiH2Cl2
þPSiH3ClþPSiH4þPSiCl2þPSiClþPSiCl3þPSi
andRe¼Clt=Htis the final or equilblrium Cl/H atom-ratio, where
Clt¼4PSiCl4þ3ðPSiHCl3þPSiCl3Þ þ2ðPSiH2Cl2þPSiCl2Þ
þPHClþPSiH3ClþPSiCl
Ht¼4PSiH4þ3PSiH3Clþ2ðPH2þPSiH2Cl2Þ
þPHClþPSiHCl3
The ‘‘guesses’’ are modified for the succeeding iteration using convergence equations:
ðPH2Þnew ¼ ðPH2Þold ðPo=PeÞ ðRe=RoÞ
0:05
ðPHClÞnew¼ ðPHHClÞold ðPo=PeÞ ðRo=ReÞ
0:05
The iterative calculation is continued until convergence is secured with respect to the twin constraints (PoandRo). The equilibrium partial pressures thus obtained are employed in finding molar fluxes.
3. Prediction of Silicon Growth Rate in a Chlorosilane Reduction System
[image:2.595.305.550.74.540.2]In general, a variety of species are produced in the inclined-pedestal silicon VPE system during reduction of chlorosilanes in the feed-stream. Such a complex system requires an array of masstransport and kinetic quantities -either predicted or measured - in order to optimize the growth of silicon. Maximizing the epitaxial growth rate may be facilitated by understanding the mechanism of the processes; Table 2 Three-term, non-linear form free energy equations for the nine
equilibria in the Si-Cl-H system (cal/mole withTin Kelvins).
r1 G
1¼ 70401 ð2:895TLnðTÞÞ þ ð59:840TÞ
r2 G
2¼ 52169 ð1:814TLnðTÞÞ þ ð43:124TÞ
r3 G
3¼ 33703 ð1:046TLnðTÞÞ þ ð34:380TÞ
r4 G
4¼ 13955 ð0:562TLnðTÞÞ þ ð28:219TÞ
r5 G
5¼3950 ð1:186TLnðTÞÞ þ ð33:389TÞ
r6 G
6¼4429þ ð0:558TLnðTÞÞ ð9:358TÞ
r7 G
7¼69955þ ð1:081TLnðTÞÞ ð31:136TÞ
r8 G
8¼ 27101 ð1:291TLnðTÞÞ þ ð23:361TÞ
r9 G
9¼108764þ ð1:639TLnðTÞÞ ð48:014TÞ
[image:2.595.47.288.95.205.2]especially whether the rate is limited by surface-reaction kinetics or mass-transport. Once the rate-limiting mechanism is established, a growth rate for silicon may be predicted. In this work, a diffusion-limited model is developed to predict epitaxial silicon growth rates in inclined-susceptor reactor operating at atmospheric pressure. The present model combines the Stefan-Maxwell treatment of multi-component diffusion due to Wilke14) and Hsu and Bird15) with the iterative equilibrium constant method of Rao.8)It is well to note that the molar flux of a specific gaseous species depends on boundary layer thickness, species concentration-gradient across the boundary layer, diffusion coefficient of the species in the bulk carrier gas, substrate temperature, and total pressure.
[image:3.595.307.551.86.111.2]In brief, the growth rate of silicon in the VPE system is calculated using the diffusion-limited model. The pair-wise diffusivities for the various species in the Si-Cl-H system are found using the Fuller-Schettler-Giddings (FSG) equation.16) By combining these diffusion parameters with the virtual equilibrium partial pressure (mole fraction) data from the previous section, the molar flux of each species in the chlorosilane reduction system can be calculated. These results together provide the ‘net’ molar-flux of silicon to the substrate; and the silicon growth rate (inmm/min) can be readily found therefrom.
Figure 1 provides a concise description of the iterative method for calculating the partial pressures of species in a quasi-equilibrium system. The assumption is that a stagnant gas-film or boundary layer develops between the bulk input stream and the silicon surface; the computed partial pressures prevail at the substrate. For the steady-state concentration-profile across the ‘film’,
ðdCi=dtÞ ¼0 ð1Þ
whereCiis the concentration of the i-th species at a specified position in the ‘film’ and ‘t’ is time. Under these conditions, the steady-state mass transport of the species across the boundary layer is the product of equivalent binary diffusivity and the concentration-gradient.
The mass transport mechanisms in the system under consideration include ordinary diffusion, Stefan flow (bulk), and thermal diffusion.5,7)Following the formulation of Rao and Do,7) natural convection effects and thermal diffusion contribution in the reported reactor configuration are con-sidered negligible. Furthermore, the ‘net’ silicon transport rate across the film or boundary layer may be obtained in terms of the molar fluxes of the speciesNi:
NSi¼ ðNSiCl4þNSiHCl3þNSiH2Cl2þNSiH3Cl
þNSiH4þNSiCl2þNSiClþNSiCl3Þ
ð2Þ
In the diffusion-limited regime for the system, virtually all of the silicon transported to the surface is expected to be incorporated in the crystal nucleation and crystal growth processes. Therefore, the quantityNSimay be considered to reflect the steady-state growth rate of the crystal.5)
The Stefan-Maxwell formalism is employed in deducing an expression for the silicon fluxNSi. As shown by Rao,17–19) the Stefan-Maxwell relations can be used successfully in representing the diffusion of gaseous species in complex multi-component systems. In the case of the chlorosilane
VPE system, the gas mixture consists of eleven species with designations A through K (Table 3). For brevity, the general treatment for only silicon tetrachloride (species ‘A’ in Table 3) is presented; the formalism can easily be extended to other species. Moreover, the predominance of carrier gas H2in the system under consideration permits simplifications.
Though the presence of each species affects the diffusion of the other species, cross-coefficients can be neglected in the flux equation for every species that occurs in low concen-tration.7)
The Stefan-Maxwell formalism leads to the following equation for the diffusion of species A (= SiCl4) in a
multi-component gas mixture composed of species A through K,
dPA¼RT
1
DAB
ðBNAANBÞ
þ 1
DAC
ðCNAANCÞ þ. . .
þ 1
DAK
ðKNAANKÞ
dZ
ð3Þ
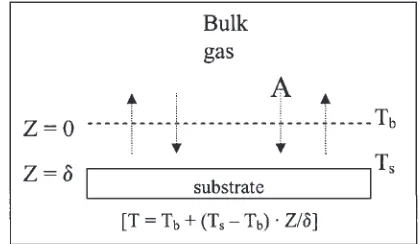
in whichPAis partial pressure of species A;R, the universal gas constant;T, the temperature in degrees Kelvin;DAB, the diffusivity of the A-B pair,DAC, the diffusivity of the A-C pair, etc.;NA,NB,etc.the fluxes of species A, B,etc.;A,B, and so on are the mole fractions of species A, B, and so forth; anddZthe increment of distance co-ordinate in the boundary layer. A schematic for this is presented in Fig. 2. The above expression may be rearranged to yield a relation for the flux of species A (= SiCl4), as follows,
1
RT
dPA dZ
¼NA
1
DAB
ðBABaÞ
þ 1
DAC
ðCACaÞ þ. . .
þ 1
DAK
ðKAKaÞ
ð4Þ
[image:3.595.340.548.292.378.2] [image:3.595.333.548.495.582.2]withBa¼NB=NA,Ca¼NC=NA,Da¼ND=NA,etc. repre-senting flux ratios. A final redistribution of terms leads to the Stefan-Maxwell expression for the flux of species A,
Table 3 Species occurring in Si-Cl-H system and designations.
SiCl4: A H2: B HCl: C SiHCl3: D SiH2Cl2: E SiH3Cl: F
SiH4: G SiCl2: H SiCl: I SiCl3: J Si(g): K —
[image:3.595.320.530.634.756.2]NA¼
1
RT
dPA dZ
B
DAB
þ C
DAC
þ. . .þ K
DAK A Ba DAB þ Ca DAC
þ. . .þ Ka
DAK
ð5Þ
Alternatively, the molar flux of species A can be expressed using the binary equivalent (or effective) diffusivity of A in the gas mixture as follows:7,17)
NA¼ DAV dCA
dZ
þAðNAþNBþ. . .þNKÞ ð6Þ
with terms:NA, the flux of species A; DAV, the effective or equivalent binary diffusivity; CA, the concentration of species A; A, the mole fraction of species A; NB;. . .;NK are molar fluxes of the other species in the system. Since
NB¼BaNA, NC¼CaNA, and so forth, substitutions into eq. (6) provide the final expression for the ordinary diffusion flux,
NA¼
DAV
1AABaACa. . .AKa
dCA
dZ ð7Þ
On comparing eqs. (5) and (7) for the fluxes it becomes apparent that the effective binary diffusivityDAV, for species A, is
DAV¼
ð1:0AAÞ
A ð8Þ
where the psi-function and the beta-function are given by
A¼
NAþNBþ. . .þNK
NA
¼1:0þBaþCaþ. . .þKa ð9Þ
A¼ B
DAB
þ C
DAC
þ. . .þ K
DAK A Ba DAB þ Ca DAC
þ. . .þ Ka
DAK
ð10Þ
Substitution of eq. (9) in eq. (7) and consolidation of terms provides,
NA¼
DAVP
RgTA
d lnð1:0AAÞ
dZ ð11Þ
[image:4.595.158.536.74.132.2]In the proposed model, the system is taken to be in a quasi steady-state, as mentioned above.7) Considering this, the expression (11) may be integrated, using limits established with respect to the positionZ¼0at the top of the boundary layer, andZ ¼at the growth surface, and the mole fractions Aoat the top, andAat the growth surface as illustrated in
Fig. 2. The integration produces the following result for the flux,
NA¼
DAVP
RgTA
ln 1:0ðAðAAoÞ
ð1:0AAoÞ
ð12Þ
The flux expression (12) may be simplified by consideration of specific factors known about the chlorosilane system. The carrier gas is hydrogen, and is at nearly one atmosphere pressure, both in the bulk-stream and at silicon-surface. The concentration of the input chlorosilane gas is usually at 0.5% or less. The remaining species are at zero concentration in the bulk gas-stream above the boundary layer. At the surface of the substrate, hydrogen gas is slightly less than one atmosphere and the ten other species resulting from the equilibria contribute partial pressures which are very small in comparison. As a result, it is discovered that the effective binary diffusivity DAV is nearly the same as the binary pair diffusivity of the minor species in the bulk hydrogen gas. Such a conclusion ensues on noting that the mole fraction of the bulk hydrogen gas B!1:0 above and within the boundary layer, while the mole fractions of the other species A, C-K!0. For instance, for small concentrations of SiCl4, A is small and the quantity (1:0A AÞ !1:0.
Since all i’s except B (of H2) are negligible, A ðB=DABÞ. Consequently, from eq. (8), it follows that
DAV¼
ð1:0AAÞ
A ¼
DAB
1:0 ¼DAB for SiCl4-H2
Thus, the effective binary diffusivity becomes the binary diffusivity of any species in the bulk gas, hydrogen. As a result, the flux of each species A, and C through K in hydrogen is calculated using appropriate analogs of the following expression:
NA¼
DABP
RgTA
½AðAAoÞ mol
cm2s ð13Þ
This form of the flux equation may be further applied to the remaining silicon-bearing species in the chlorosilane VPE system to determine the steady-state flux of each species. These fluxes may be summed to arrive atNSiusing eq. (2). The flux may be converted to growth rate (inmm/min) by the following relation,
growth rate (mm/min)¼
Flux mol
cm2s
60 s min 28:0855 g mol
1 ðcm2Þ
1ðcm2Þ 2:328ðg/cm3Þ 10 4
ðmm/cmÞ ð14Þ
4. Method of Calculation of Rates
The computation of molar flux by eq. (13) requires the specification of a number of variables, including: the film or boundary layer thickness; the mole fraction of the species in
flow-velocity and physical properties (density, viscosity) of the gas-stream, can be determined experimentally.21–24) Knowl-edge of the film thickness, usually prerequisite in the study of crystal growth, can also be gained from empirical mass-transfer correlations such as,25)
Sh¼0:664Re1=2Sc1=3¼L
ð15Þ
in whichShis Sherwood number,Reis Reynolds number for a flat plate,Scis Schmidt number for the gas-stream,Lis the dimension of the flat substrate in the direction of gas flow, andis the layer thickness. Uniformity of thickness is usually maintained through the geometry of the apparatus (inclina-tion of the pedestal); a single measure of film thickness will suffice. The diffusivity for each of these species then remains a key parameter. While most of the quantities in the flux eq. (13) are derived from experimental parameters, the diffusiv-ities of the silicon bearing species in the bulk hydrogen gas require calculation. The Fuller-Schettler-Giddings equation for binary diffusivity is employed in the form,16)
DiAB ¼0:001T
1:75
P
1
MA
þ 1
MB
1
2
V 1 3
AþV
1 3
B
2
cm2
s ð16Þ
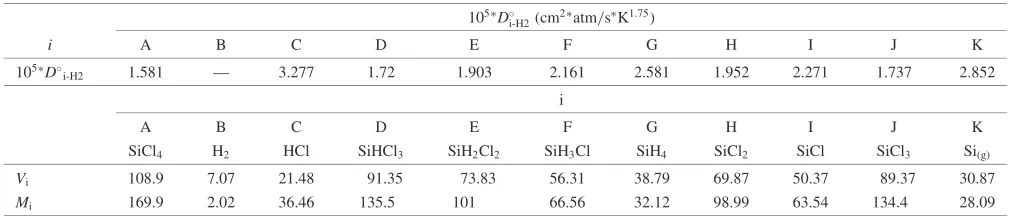
with T in Kelvins, P in atm, MA and MB are molecular weights of species A and species B, hydrogen in this case;VA andVBare the diffusion volumes of species A and species B, that is, hydrogen. Table 4 lists the diffusivities for various species.
The final data required in order to calculate molar fluxes using eq. (13) are the mole fractions in the bulk gas stream and the mole fractions at the surface of the silicon. The composition of the input reactant gas is known; and there-from the mole fractions can readily be found. For species that are not part of the feed, the value is zero. The partial pressures of the 11 species at the substrate surface, calculated using the equilibrium algorithm described earlier (Fig. 1), furnish the gas-phase mole-fractions near the silicon-surface (A; B;. . ., and so forth).
5. Results
The feed-gas mixture composed of 0.1% SiH4, 0.4% HCl,
and 99.5% H2, is selected to illustrate the method of
calculation in accordance with the algorithm of Fig. 1; the results can be compared to the silicon-growth-rates in an
inclined pedestal reactor measured by Bloem2,5) for the specified feed-gas. The atom-ratios are readily found; in the input gas-phase:
ðCl=HÞ ¼ ð0:4=199:8Þ ¼0:002002;ðSi=ClÞ ¼0:25:
It is well to note that the former remains constant as equilibrium is attained, but the latter shows a decline on account of deposition of silicon. At T ¼1400K and
P¼1:0atm, the virtual equilibrium partial pressures near the solid silicon-surface are as follows: in atm
SiCl4; 7:217108; H2; 0:9961; HCl; 3:889103;
SiHCl3; 2:304106; SiH2Cl2; 3:831106;
SiH3Cl; 3:084106; SiH4; 9:132107;
SiCl2; 4:485105; SiCl; 5:802109;
SiCl3; 8:734107; Si(g); 8:3131010:
It is seen that the equilibrium gas-phase at the silicon-surface has a Cl/H atom-ratio of 0.0020037 which is within 0.1% of the initial value; and the drop in the Si/Cl atom-ratio to 0.01399 is attributed to deposition of silicon. The iterative computation employed here is very efficient, requiring only thirty-seven iterations to reach convergence.
The steady-state molar fluxes of each of the nine silicon-bearing species are computed by means of eq. (13) using the foregoing data on partial pressures (which are numerically equal to mole-fractions i at silicon-surface) together with diffusivities (Table 4). The bulk-gas mole-fraction for SiH4
species is the specifiedXGo¼0:001; and for the other eight species, these are assumed negligible. For the inclined-substrate configuration, at a feed-gas flow-rate of about 75 liters(STP)/min, the film-thickness () is reportedly 3-mm.2,5) The molar fluxes, in molecm2s1, are as follows (the
negative sign implies the species is diffusing away from the silicon-surface):
SiH4; 2:397107; SiCl2; 8:137109;
SiH2Cl2; 6:7771010; SiH3Cl; 6:1961010;
SiHCl3; 3:6841010; SiCl3; 1:4111010;
SiCl4; 1:0611011; SiCl; 1:2251012;
Si(g)nil:
Substitutions into eqs. (2) and (14) provide:
net silicon flux at steady-state
[image:5.595.45.552.677.786.2]¼2:297107molecm2s1
Table 4 Binary diffusivities in hydrogen bulk gas with pressure and temperature terms omitted.
105D
i-H2(cm2atm/s
K1:75)
i A B C D E F G H I J K
105D
i-H2 1.581 — 3.277 1.72 1.903 2.161 2.581 1.952 2.271 1.737 2.852
i
A B C D E F G H I J K
SiCl4 H2 HCl SiHCl3 SiH2Cl2 SiH3Cl SiH4 SiCl2 SiCl SiCl3 Si(g)
Vi 108.9 7.07 21.48 91.35 73.83 56.31 38.79 69.87 50.37 89.37 30.87
predicted growth-rate of silicon¼1:66mmmin1
[image:6.595.331.519.67.308.2]Similar calculations were made for the same feed-gas at four other temperatures: 1200, 1300, 1500, and 1600 K, with total pressure held at 1.0 atm (= 101.325 kPa). These results are summarized in Table 5.
Figure 3 shows the computed silicon growth-rate (RSi) plotted on semi-log scale versus reciprocal temperature. Comparison is made with measurements of Bloem.2,5) Reasonable agreement is seen, especially over the 1300– 1600 K range; it is well to note that the film-thickness employed in the present calculation is an estimate.
The experimental work of Bloem2,5) included three other feed-gas mixtures: 0.2% SiHCl3+ 99.8% H2, 0.1% SiCl4+
99.9% H2, and 0.5% SiCl4 + 99.5% H2. The virtual
equilibrium diffusion-limited silicon-growth model (Figs. 1 and 2) was applied to these and predicted growth rates were obtained in each case over the 1200–1600 K temperature range for a total pressure of 1.0 atm (= 101.325 kPa). The results (inmm/min) are listed in Table 5. For the chlorosilane (0.2% SiHCl3)-containing feed, good agreement was noted
between the predicted rates and the measurements of Bloem,2,5) akin to that for the silane (0.1% SiH4)-bearing
mixture shown earlier in Fig. 3.
In contrast, the computed rates (RSi) for the SiCl4 + H2
mixtures (Fig. 4) deviate markedly from the experimental data reported by Bloem.2,5) The predicted rates are consis-tently larger than the measured values, with better agreement approached at higher temperatures, particularly for the 0.5% SiCl4 + 99.5% H2 feed. It will be noted that the effective
diffusivity of SiCl4in the gas-mixture is smaller than that of
SiHCl3 or SiH4 (Table 4); thus, the higher rates must be
attributed to the larger steady-state concentration-gradient of SiCl4 computed using the present model. In the following
section, an explanation is offered for the discrepancies between the predicted and experimental rate data.
6. Discussion
Across the stagnant gas-film (Fig. 2) there develops a steep gradient in temperature with the silicon-substrate at a substantially higher temperature (Ts) as compared to the bulk gas stream (Tb). The steady-state molar flux of the A-th species across the gas-film can be expressed by the following relation which is analogous to that reported earlier for chemical vapor transport by Rao and Do:7)
NA0 ¼ D
AB!
4RgðTs1=4Tb1=4ÞA
lnð1:0AAÞ
ð1:0AAoÞ
ð17Þ
Upon simplification, using!¼ ðTsTbÞ=,
NA0 ¼ D
AB ðTsTbÞ 4RgðTs1=4Tb1=4Þ
ðAoAÞ ð18Þ
where
DAB¼DABP ðTsÞ1:75; cm2atms1(K1:75) ð19Þ
From eqs. (13), (18), and (19) it is readily apparent that Fig. 3 The computed silicon growth-rate (RSi) for the feed-gas mixture
composed of 0.1% SiH4, 0.4% HCl, and 99.5% H2plotted on semi-log
scale versus reciprocal temperature.
Fig. 4 The computed silicon growth-rate (RSi) for the feed-gas mixture composed of 0.1% SiCl4and 99.9% H2 and another composed of 0.5%
SiCl4and 99.5% H2plotted on semi-log scale versus reciprocal
temper-ature. Table 5 Predicted growth rate data (mm/min).
T, K 0.1% SiCl4 - 0.5% SiCl4 - 0.1% SiH4 + 4HCl - 0.2% SiHCl3
1200 8.23E-01 1.97 1.42 1.77
1300 9.25E-01 3.09 1.56 2.01
1400 9.90E-01 3.71 1.66 2.15
1500 1.04 4.01 1.75 2.27
[image:6.595.60.279.83.439.2] [image:6.595.307.549.662.769.2]N0
A
NA
¼ 0:25ðTsTbÞ ðTsTs3=4Tb1=4Þ
ð20Þ
For the diffusion of species SiH4in hydrogen atTs¼1400K and Tb¼1100K, corresponding to a temperature-gradient (!) of 1000 K per cm, eq. (20) yields
NSiH0
4¼0:9156NSiH42:19510
7
mole/cm2s
This corresponds to a predicted rate (RSi) of 1.52mm/min; as a result, there is less disparity between the computed rates and experimental data (Fig. 3).
The thickness ofstagnant-film was the subject of careful investigation; the streaming patterns obtained by Eversteyn
et al.21) with TiO2-haze for hydrogen flowing past the
susceptor (held at 1323 K) showed that the film-thickness decreased from¼0:65-cm at a flow-velocity of 45 cm/s to ¼0:46-cm at a higher gas velocity of 180 cm/s. A semi-empirical relationship that links the film-thickness to stream-velocity was recommended by these authors.21)
The horizontal reactor employed by Bloem2,5)was an 80-cm long quartz section with rectangular cross-section (10-80-cm
2.5-cm); the graphite susceptor was 10-cm 24-cm
1.25-cm in size. For a susceptor-tilt of 1.5, with a hydrogen flow of 75 L/min, the film thickness can be estimated using the semi-empirical approach of Eversteyn et al.21) At a distance of-cm from the leading-edge of the substrate,
ðÞ ¼7 ½VðÞ1=20:2; cm ð21aÞ
in which the gas-velocityVðÞis given by
VðÞ ¼Vo ðTm=ToÞ=ð10:01Þ; cm/s ð21bÞ
whereVo¼50cm/s atTo¼300K for 75 L/min flow used by Bloem;2)T
m= mean gas-temperature = 750 K. It is seen that at¼4-cm,VðÞ ¼130:5cm/s andðÞ ¼0:413-cm; similar calculations show that the estimated film-thickness is 0.399-cm at¼8-cm and 0.371-cm for¼16-cm.
Thus, the stagnant film-thickness () appears to fall in a narrow-range of 0.371-cm to 0.413-cm. With an average value of ¼0:39-cm, the predicted growth-rate (RSi) becomes smaller — only three-fourths of that shown in Fig. 3. Hence, closer agreement with the experimental rate data is indicated.
It is well to note that the measured rates for 0.1% SiCl4+
99.9% H2 and 0.5% SiCl4 + 99.5% H2 gas mixtures are
markedly lower (in Fig. 4) as compared to the predicted values. The presence of HCl in the feed-gas appears to ensure that the substrate is free of surface oxide(s); the latter may be native or formed by infiltrating oxygen and water vapor; faster growth rates are obtained with substrates free of oxide impurities. Bloem2)reported treating the surface with flowing hydrogen gas at 1523 K for fifteen minutes prior to growth experiments. The reduction of surface-oxide (SiO2) by
hydrogen does not appear to be thermodynamically favored:
SiO2 (s)þH2 (g)¼SiO (g)þH2O (g) ð22Þ
G¼555517202.387.T; J:Rao8Þ
For feed-gas containing HCl, the following two-step mech-anism involving a chlorine intermediate makes the foregoing reaction feasible at 1523 K:
SiO2 (s)þ2HCl (g)¼SiO (g)þH2O (g)þCl2 (g)ð23Þ
G¼743713189.583.T; J:Rao8Þ
For a concentration of 0.4% HCl in the input gas-stream, it is
seen PHCl ¼0:004atm and
PSiO ¼PH2O¼PCl2¼0:158510
6atm at 1523 K. Since
the gas-stream is predominantly hydrogen, the following reaction is expected to occur:
H2 (g)þCl2 (g)¼2 HCl (g) ð24Þ
G¼ 188;19612.804.T; J:Rao8Þ
At PH2¼0:99atm and PHCl ¼0:004atm, the equilibrium
value P0
Cl2¼0:121710
11atm is negligible. It is readily
seen that the net result of reactions (23) and (24) is reduction of the surface-oxide(s).
While HCl (g) at modest concentration is expected to have a favorable influence on growth kinetics, at higher HCl-concentrations, rate-retardation occurs on account of the reaction,
Si (s)þ2 HCl (g)¼SiCl2 (g)þH2 (g) ð25Þ
This etching reaction can take place parallel to growth processes thus having an adverse effect on the overall growth rate.
7. Conclusions
The diffusion-limited vapor phase epitaxial growth rates for silicon, predicted by the virtual equilibrium model, show reasonable agreement with measurements. The differences between measured and predicted rates appear to be the result of residual oxide impurity on the substrate surface. The model can be extended to the chemical vapor deposition of silicon from rich mixtures of SiHCl3(as high as 30 per cent)
and hydrogen in a horizontal reactor.26)
Acknowledgments
Financial support for this work furnished in the form of a teaching assistantship (to RR) by the Department of Materials Science and Engineering is gratefully acknowl-edged. Thanks are also due to the staff of the Academic Computer Center, Mary Gates Hall, University of Wash-ington, Seattle.
REFERENCES
1) H. M. Liaw and J. W. Rose:Epitaxial Silicon Technology, Ed. B. Jayant Baliga, (Academic Press, Inc., New York, 1986) pp. 1–85.
2) J. Bloem: J. Electrochem. Soc.117(1970) 1397–1401.
3) C. H. J. Van den Brekel and J. Bloem: Philips Res. Repts.32(1977) 134–146.
4) J. Bloem and W. A. P. Claassen: J. Crystal Growth49(1980) 435–444. 5) J. Bloem: J. Crystal Growth31(1975) 256–263.
6) F. Langlais, F. Hottier and R. Cadoret: J. Crystal Growth56(1982) 659–672.
7) Y. K. Rao and Yang Do: High Temp. Sci.27(1988) 159–172. 8) Y. K. Rao: Stoichiometry and Thermodynamics of Metallurgical
Processes, (Cambridge University Press, Cambridge and New York, 1985) 957 pp.
D.C., 1982) 509 pp.
10) L. B. Pankratz: Thermodynamic Properties of Halides, Bur. Mines Bull. No. 674, (U.S. Dept. of the Interior, Washington, D.C., 1984) 826 pp.
11) L. B. Pankratz, J. M. Stuve and N. A. Gokcen:Thermodynamic Data for Mineral Technology, Bur. Mines Bull. No. 677, (U.S. Dept. of the Interior, Washington, D.C., 1984) 355 pp.
12) M. W. Chase, Jr., C. A. Davies, J. R. Downey, Jr., D. J. Frurip, R. A. McDonald and A. N. Syverud:JANAF Thermochemical Tables, Third Edn., (American Chemical Society, Washington, D.C., 1986) 1856 pp. 13) O. Knacke, O. Kubaschewski and K. Hesselmann (Ed.): Thermochem-ical Properties of Inorganic Substances, Second Edn., (Springer-Verlag, Berlin and New York, 1991) 2412 pp.
14) C. R. Wilke: Chem. Eng. Progr.46(2) (1950) 95–104. 15) H. W. Hsu and R. B. Bird: AIChE J.6(1960) 516–524.
16) E. N. Fuller, P. D. Schettler and J. C. Giddings: Indust. Eng. Chem.58
(5) (1966) 18–27.
17) Y. K. Rao: Can. Metall. Quart.18(1979) 379–381. 18) Y. K. Rao: Trans. Indian Inst. Metals47(1994) 31–51.
19) Y. K. Rao: Environment & Innovation in Mining and Mineral Technology, Ed. M. A. Sanchez, F. Vergara and S. H. Castro, (University of Concepcion, Chile, 1998) pp. 625–636.
20) D. E. Rosner: AIChE J.9(1963) 321–331.
21) F. C. Eversteyn, P. J. W. Severin, C. H. J. Van den Brekel and H. L. Peek: J. Electrochem. Soc.117(1970) 925–931.
22) C. W. Manke and L. F. Donaghey: J. Electrochem. Soc.124(1977) 561–569.
23) V. S. Ban: J. Electrochem. Soc.122(1975) 1389–1391.
24) V. S. Ban and S. L. Gilbert: J. Electrochem. Soc.122(1975) 1382– 1388.
25) C. N. Satterfield:Mass Transfer in Heterogeneous Catalysis, (M.I.T. Press, Cambridge, Mass., 1970) pp. 91–92.