Comparison among SANS Technique and Conventional Methods
for Cavity Characterization in Superplastically Deformed Ceramic
Stefanus Harjo
1;*, Naoki Kojima
2and Yoshinobu Motohashi
2 1Institute of Materials Structure Science, High Energy Accelerator Research Organization, Tsukuba 305-0801, Japan
2Research Center for Superplasticity, Faculty of Engineering, Ibaraki University, Hitachi 316-8511, Japan
A novel small angle neutron scattering (SANS) method was applied for characterization of cavities in a 3Y-TZP subjected to superplastic deformations under different conditions, and the results were compared with conventional methods,i.e.SEM analysis and density measurement (Archimedes) method. Morphology of cavities formed in the 3Y-TZP specimens varied depending on the deformation condition and the dimension of the specimen. Effects of cavity morphology on the cavity characterization were investigated and were discussed for each method. It was found that: (1) The accuracy of the data obtained from SEM analysis was very sensitive to the morphology of cavities, while (2) Archimedes and SANS methods gave similar results, and showed good reliability for evaluation of bulk properties of cavities.
(Received February 26, 2004; Accepted May 26, 2004)
Keywords: ceramics, yttria stabilized tetragonal zirconia polycrystal, superplasticity, cavities, scanning electron microscopy, density measurement, small angle neutron scattering
1. Introduction
Cavities are formed and grown in polycrystalline materials subjected to superplastic deformations. Cavitation in the polycrystalline materials is one of significant indicators relating to the physical mechanism of superplastic deforma-tion. In superplastic metals, cavities slightly elongated mostly parallel to the tensile axis have been frequently observed after the deformations.1,2) In yttria stabilized tetragonal zirconia polycrystals (Y-TZP) deformed under proper superplastic conditions, a cavitation behavior quite similar to that of superplastic metals has also been found,i.e., cavities grow and coalesce with nearby ones mostly parallel to the tensile axis with the deformation.3,4)Up to date, four
types of cavity shape have been found depending on temperature and strain-rate in Y-TZP specimens pulled superplastically:3–8)They are (i) cavities with spherical-like
shapes, (ii) those elongated mostly parallel to the tensile axis due to their growth and/or coalescence, (iii) relatively large ones coalesced roughly normal to the tensile axis and (iv) crack-like flat ones having very small gaps lying mostly normal to the tensile axis. They are schematically illustrated in Fig. 1. In our previous reports, from small angle neutron scattering (SANS) measurement and scanning electron mi-croscopy (SEM) observation, type (i), (ii) and (iii) cavities were found in 3Y-TZP when deformed under a proper superplastic condition,7–9)and type (i) and (iv) cavities were
found when deformed under high strain rate conditions.7,8)
Despite a large number of published studies concerning cavitation behaviors in superplastic materials,3–6)only a few
data — obtained from exactly as-deformed specimens, i.e., without the surface preparation — have been reported so far. It is probable that the surface preparation of specimens before the evaluation of cavities may give errors in the data.
SANS has been used to study microstructural phenomena in the range of about 1 to104nm in size. Since it can cover a wide range of sizes, this technique is particularly useful in studies of ceramic processing such as fine flaws existing in
ceramics,10,11) of porosity in plasma-sprayed materials,12,13)
of sintering effects in a nanostructured zirconia,14) and so
forth. SANS method can be applied to specimens without any surface preparation,7–9) i.e., nondestructive measurement.
The present work focuses on the characterization of cavities formed in 3Y-TZP superplastically deformed under different conditions by means of different measurement methods; image processing using scanning electron microscopy (SEM), density measurement and SANS method. The obtained data from different measurement methods were compared and were discussed with deformation conditions, to clarify the reliability of respective data.
2. Experimental
The material used in this study is a fine-grained 3Y-TZP with an average initial grain size of 390 nm, produced by sintering powder of ZrO2 containing 3 mol% Y2O3 in solid
solution at 1773 K under atmospheric pressure. The chemical composition of the 3Y-TZP is as follows: Y2O3=5.15,
Al2O30.10, SiO20.02, Fe2O30.01, Na2O0.04 and
ZrO2=balance, in mass%. Flat tensile specimens were
manufactured to provide a gauge part of 25 mm in length, 4 mm in width and 3 mm in thickness. Tension tests with constant crosshead speeds were carried out in air. The details
(a) Deformation under proper superplastic condition
(b) Deformation at high strain rate (or low temperature)
type (i) type (ii) type (iii)
type (iv)
type (i)
Fig. 1 Schema of cavity types in Y-TZP deformed superplastically.
*Corresponding author, E-mail: [email protected]
of testing conditions are shown in Table 1.
Characterization of cavities was performed on the gauge section of the deformed specimens by means of image processing using SEM images (hereafter refers to SEM analysis), density measurement and SANS method. SEM analysis was conducted using twenty pieces of SEM images which covered an area of about 1.0 mm2. The SEM images
used for the analysis were taken at the gauge section of each specimen after polishing. Thermal etching was not conduct-ed. Polishing was carried out using a diamond-lapping machine ML-150, and was conducted by the following process: lapping using the lapping disc, polishing using a diamond (;2mm) polishing liquid and finishing using a slurry diamond (;1mm) liquid. There was no drop-out of grains during the polishing process. A layer of about 100mmwas removed from the specimen surface by the polishing. The obtained SEM images were digitized and examined using an image analysis system to obtain quantitative information on
the variation in the level of cavitation with strain, strain rate and temperature. An areal analysis method15)was adopted as
a technique for the quantitative evaluation of area fraction of cavities. For the observation of grain sizes, the polished specimen was thermal etched for 1.8 ks at a temperature 100 K lower than the temperature used for the superplastic deformation. The density measurement was carried out by the Archimedes’ method using ethyl iodide solution. The speci-men surfaces were polished to remove any surface irregu-larities formed during the deformation and then washed using the ultrasonic cleaning machine in acetone and water, and dried in vacuum at 403 K prior to the density measurements. The SANS experiments have been conducted at two types of double-crystal (DC) system instruments: the high-resolution double-bent-crystal (DBC) instrument (DN-2, NPI, R˘ ez˘) and the ultra high resolution Bonse-Hart type instrument (S18, ILL, Grenoble). Each specimen was measured in both vertical and horizontal orientations with respect to the scattering (horizontal) plane, in order to get information about the anisotropy of microstructures. More detailed description of the SANS methods used in this investigation has been reported in our previous work.9)In this study, the
SANS measurements were conducted for as-deformed speci-mens,i.e., those without any surface preparation.
3. Results and Discussion
[image:2.595.46.289.94.181.2]3.1 Under low strain rate superplastic condition
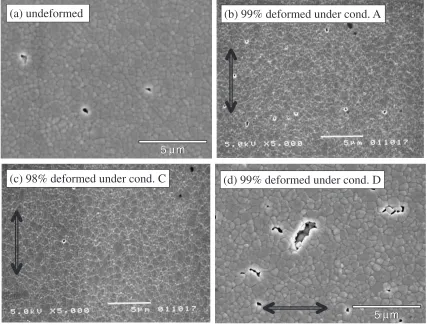
Figure 2 shows SEM images of an undeformed specimen
Table 1 Conditions for superplastic deformations of 3Y-TZP tensile specimens.
Condition Temperature
(K)
Initial strain rate (s1)
Nominal strain (%)
A 1623 3:3105 99
B 1623 4:0104 99
C 1723 3:3105 98
D 1723 3:3104 10198
E 1723 6:7103 100
(b) 99% deformed under cond. A
(c) 98% deformed under cond. C
5
µ
m
5
µ
m
(d) 99% deformed under cond. D
5 m
5
µ
m
(a) undeformed
µ
[image:2.595.84.511.433.758.2]and those deformed under the conditions of low strain rates (conditions A, C and D) to about 100%. In the undeformed one (Fig. 2(a)), small pores are observed, showing that the specimen before deformation may contain residual pores left after the sintering processes. They are isolated, and possess diameters smaller than 1.0mm and nearly equiaxial shapes,
i.e., type (i) cavities. In the specimen deformed under condition A (Fig. 2(b)), the grain size is almost kept unchanged in comparison with that in Fig. 2(a), but the number of cavities is increased. The cavities in Fig. 2(b) are also isolated, nearly equiaxial and have diameters less than 1.0mm,i.e.type (i) cavities. In the specimen deformed under condition C (Fig. 2(c)), except for the grain growth, no increase in cavity number or cavity size is observed. More likely, the cavities or pores seem few in number compared to those in Fig. 2(a). In the specimen deformed under condition D (Fig. 2(d)), grain growth and coalescence of cavities are evident. However, this cavitation behavior seems different from that observed for the deformation under condition A. That is, besides the number of cavities is increased, large cavities with their diameters larger than 1.0mmare observed in addition to the isolated equiaxed-ones. These large cavities are considered to be formed due to coalescence of nearby ones and are mostly elongated along tensile direction, i.e.
type (ii) ones.9)
Careful inspections of Figs. 2(b), (c) and (d) reveal, that there exist cavities with their sizes smaller than those in Fig. 2(a). This means that newly cavities formed due to the superplastic deformations have sizes smaller than the residual pores, which is consistent with SANS results reported in Ref. 9).
The obtained SANS curves are skipped here since they have been already reported in Refs. 7, 9). To evaluate characteristics of the cavities, such as volume fraction, specific surface, average radius and aspect ratio, in each specimen, the data obtained at both DBC and Bonse-Hart instruments measured in both vertical and horizontal ori-entations were fitted simultaneously, using a single set of model parameters.9,16)As the model, we have assumed two
sets of cavities with sizes (radii) varying between 20 nm and 10mm. As for the first set, cavities were assumed to have shapes of spheres, while they were rotation-ellipsoids with the longest diameters parallel to the tensile direction for the second set. For the details of the fitting procedures and analyzed results including specific surface of cavities, volume fraction of all cavities, size distribution and average cavity radius, please refer to Refs. 9, 16).
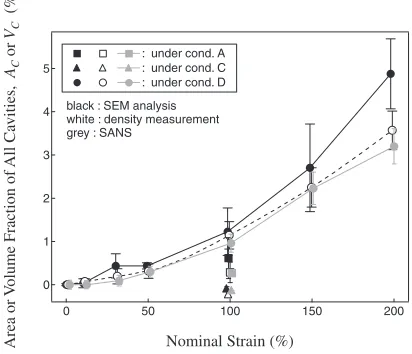
Figure 3 displays the volume fraction of all cavities,VC,
measured by the density measurement method and the area fraction of all cavities,AC, by the SEM analysis together with
the result of the DC-SANS method. Here, the contribution of residual pores left after the sintering process was previously subtracted to show only the results of cavitation during the deformations. The volume fraction of residual pores meas-ured by the DC-SANS and the area fraction of residual pores measured by the SEM analysis were 0.27% and 0.26%, respectively.9) It is seen in Fig. 3, both Archimedes and SANS methods give similar results for a whole strain range measured in this study, regardless of the deformation condition. They agree also well with theACvalues obtained
from the SEM analysis for strain below about 100%. At larger strains, however, the area fractions evaluated from SEM analysis are fairly higher than other data.
In the present study, the procedure used to estimate theAC
value is similar to that reported elsewhere for the quantitative estimation of cavities or a second phase in dual phase materials.3,9,15,17) That is to say, the measured area of all cavities or all second phases appearing on SEM or optical microscopy (OM) images is directly compared to the area of images. If cavities in a specimen are large in the number and distribute nearly uniformly in the whole specimen, the area fraction of cavities may be considered to nearly equal to the volume fraction of cavities. For simplicity, we assume here theACis nearly equal to theVC.
To clarify the difference between ACfrom SEM analysis
and VC from SANS method, we have calculated the
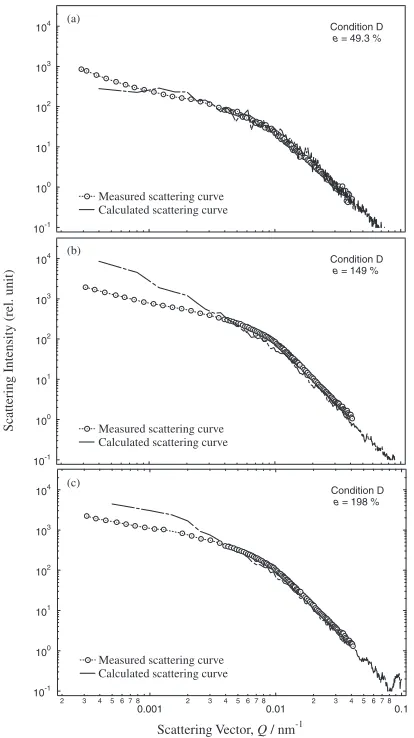
DC-SANS scattering curves directly from the SEM images used for the evaluation of the area fractions and compared them with the measurements. The detailed procedures and results have been reported in Ref. 18). Typical results for the specimen deformed under condition D to 49.3, 149 and 198% in nominal strains are displayed in Fig. 4 together with the measured ones already reported in Refs. 7, 9). The con-version between Q and real scales can be assumed as r¼ =Q(r is cavity radius). The scattering intensity is propor-tional to the product of cavity volume fraction multiplied by cavity size. When the deformation amounts are small the calculated curves agreed comparatively well for allQregion (see Fig. 4(a)). When the deformation amounts become large, the calculated curves agree comparatively well with the measurements, except for the smallQregion. It indicates that the small cavities observed on SEM images are well identified and can represent the bulk microstructural state of the specimen. The small cavities also contributed to the SANS signals. On the other hand, the difference appeared at the smallQregion may be due to the large cavities for which the calculation could not work well. Such large cavities appear only in small number on the SEM images, but they contribute significantly to the total scattering intensity, particularly at the small Q region. Consequently, the
5
4
3
2
1
0
Area or
V
olume Fraction of
All Ca
vities,
AC
or
VC
(%)
200 150
100 50
0
Nominal Strain (%)
: under cond. A : under cond. C : under cond. D
black : SEM analysis white : density measurement grey : SANS
[image:3.595.324.530.79.256.2]accuracy of the calculated curve in this study is low due to the statistical fluctuation in the number, size and shape of large cavities appearing on the SEM. A careful inspection of Fig. 4 reveals that, the intensities of the calculated scattering curves for highQregion seem to be lower than the measured ones, especially for the specimens deformed to large strain amounts (Figs. 4(b) and (c)). The reasons will be described latter.
Figure 5 shows size distributions of cavities measured by SEM analysis for a specimen deformed under condition D to 198% for (a) area fraction and (b) cavity number. It is shown in Fig. 5, though cavities with large diameters contribute largely to the area fraction, their number is very small. From these results, it is clear that the accuracy of measurement of large cavities by SEM analysis using even 20 images (covering an area of 1.0 mm2) cannot represent well the bulk
microstructure of the material. Large cavities with their diameters larger than 1.0mmare hardly observed when the specimens deformed to about 100% under condition D9)and under condition A and C (see Fig. 8 shown later).
The followings are other possible explanations for the difference between the results from SEM analysis and those from SANS method for cavity characterization of 3Y-TZP specimens deformed at low strain rates: (1) The large cavities
observed on SEM might not be distributed uniformly in the sample volume measured by SANS, or (2) the large cavities had jagged surfaces which might affect the neutron scatter-ing, or (3) the large cavities observed on SEM might be evaluated larger due to the cavity identification procedure which might interpret some regions of the 3Y-TZP matrix as parts of the cavities.
3.2 Under high strain rate or low temperature condition
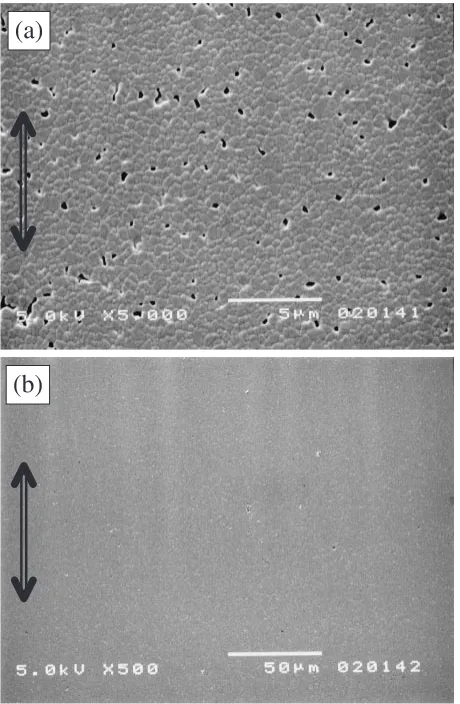
Figure 6 shows SEM images for a specimen deformed to around 100% under condition E. In an image taken at a high magnification (Fig. 6(a)), cavities with their diameters and number larger than those in the specimens deformed under conditions A and C (Figs. 2(b) and (c), respectively) are observed. Many of the cavities are isolated and possess diameters less than 1.0mm. They are mostly spherical and isolated (type (i)), but some of them are slightly stretched along the tensile direction (distorted type (i) or type (ii)). As reported in Refs. 7, 8, 19), from the SANS measurements, the existence of the flat cavities lying roghly normal to the tensile axis (type (iv)) has also been determined in specimens deformed under conditions B and E. However, it is difficult to identify such cavities in the SEM image8) in Fig. 6(a).
Meanwhile, in the SEM image taken at a low magnification (Fig. 6(b), no large cavities due to significant cavity growth and/or coalesce are seen.
Figure 7 shows the AC and VC values for specimens
deformed to around 100% under different conditions. The volume fraction obtained from SANS was evaluated by fitting scattering curves (reported in Ref. 8)) measured at both DBC and Bonse-Hart instruments simultaneously for vertical
10-1
100
101 102 103
104 Condition D
e = 49.3 %
Measured scattering curve Calculated scattering curve (a)
10-1 100 101
102
103 104
Scattering Intensity (rel. unit)
Condition D
e = 149 %
Measured scattering curve Calculated scattering curve (b)
10-1
100 101 102 103
104
2 3 4 5 6 7 8
0.001 2 3 4 5 6 7 80.01 2 3 4 5 6 7 80.1
Scattering Vector, Q / nm-1
Condition D
e = 198 %
Measured scattering curve Calculated scattering curve (c)
Fig. 4 Comparison between the scattering curves directly calculated from SEM and measured SANS data, for specimens deformed under condition D to the strain amount of 49.3% (a), 149% (b) and 198% (c).
50
40
30
20
10
0
Ca
vity Number
,
NC
/ 10
mm
3-2
2.8 2.4 2.0 1.6 1.2 0.8 0.4
Cavity radius, rC / µm Condition D
e = 198 % 6
5
4
3
2
1
0
Area fraction of ca
vities,
AC
(10
)
-3 Condition De = 198 % (a)
(b)
[image:4.595.66.273.71.440.2] [image:4.595.318.532.71.356.2]specimen orientation, using the similar procedures described in section 3.1. Since only a simple model of an uncorrelated system of polydisperse spheres20,21)was used, the resulting
volume fraction could be biased due to the model assump-tions, which were obviously too simple. A more realistic model should include both the cavity anisotropy observed on 2-dimensional SANS data7–9)and SEM images shown in Fig. 6(a), and pair correlations due to the existence of the flat cavities.7,8,19)It is clearly seen in Fig. 7 that theACandVC
values are increased with increasing strain rate and lowering temperature. The AC and VC values for the specimens
deformed at comparatively low strain rates (conditions A, C and D) agree relatively well with each other, if we take experimental errors of volume fraction values or a statistical error of area fraction values into consideration. However, the
VCvalues are fairly larger than theACones for the specimens
deformed at high strain rates (conditions B and E). This difference might stem from the difficulties in SEM analysis due to different morphology of cavities that depends strongly on the deformation condition,7–9) and/or also from the presence of flat cavities8) having sizes lower than the resolution limit of SEM used here.
As can be seen in Fig. 2(d), in a specimen deformed to nominal strain of 99% under the condition D, most cavities are type (ii) ones and the remains are type (i) ones. The type
(ii) cavities are large enough. Cavities larger than the largest one shown in Fig. 2(d) are observed at different regions of the surface of the specimen deformed under the condition D. They may be caused by coalescence of type (i) ones. In a specimen deformed to 100% under the condition E (see Fig. 6(a)), most cavities are type (i) ones. Only few type (ii) cavities are observed, but large ones like those appeared in Fig. 2(d) are not found. As stated above, flat cavities having sizes lower than the resolution limit of SEM8)should exist in the specimen. It has been reported also in Ref. 8) that, the flat cavities may be intergranular crack-like ones, resulting from separation of grain boundaries existing among fine type (i) cavities formed at grain boundary triple points, mostly normal to the stress axis. It implies that the sizes of the fine cavities are too small to observe by SEM. This fact may be one of the origins of the lowACvalue obtained from the SEM
analysis for the specimens deformed at the high strain rate or low temperature (see Fig. 7). Taking these facts into consideration, the lower intensities of the calculated scatter-ing curves for highQregion than the measured ones (see Fig. 4(b) and (c)) may stem from the facts that SEM analysis may overlook the fine cavities due to the SEM resolution limit.
Another different morphology of cavities may be due to the specimen dimensions. That is, the morphology of cavities may be different at the surface and at interior regions of specimen, as will be explained as follows: Morphology of cavities at the surface region of the deformed specimen is inferred to be different from that at its interior due to different constraints for the cavitation behaviors between surface and interior regions of the specimen. Cavities at surface region are predicted to be larger in size and number than those at the interior one because the constraint at surface region may be looser than at interior due to the existence of the free surface. Figure 8 shows size distributions of cavities in number, evaluated by SEM analysis at surface and at interior regions for specimen deformed to 100% under condition E. The characterization of cavities at the interior region was conducted by cutting the gauge part of the specimen parallel to the tensile axis into two pieces. Then, SEM analysis was
(a)
(b)
Fig. 6 Appearances of cavities at gauge section in a specimen deformed to 100% under condition E: (a) taken at a high magnification; and (b) at a low magnification. Arrows show tensile direction.
5
4
3
2
1
0
Area or
V
o
lume Fraction of
All Ca
vities,
AC
or
VC
(%)
10-5 10-4 10-3 10-2
Initial Strain Rate,εi / s-1
: under cond. A : under cond. B : under cond. C : under cond. D : under cond. E
black : Ac (SEM analysis) white : Vc (density measurement) grey : SANS
.
[image:5.595.55.285.72.424.2] [image:5.595.324.531.80.258.2]performed at the central part of the cut surface. The cut surface was about 1 mm apart from the surface. It is seen in Fig. 8 that, although the size distributions of cavities measured at surface and interior regions of the specimen peak at a similar cavity radius, the total number of cavities measured at surface region is quite larger than that in interior one. This data also suggest that the distribution of cavities formed during superplastic deformation vary with the dimension of specimen. In addition, the similar tendency of morphology of cavities was also observed for the specimens deformed under different conditions in this study.
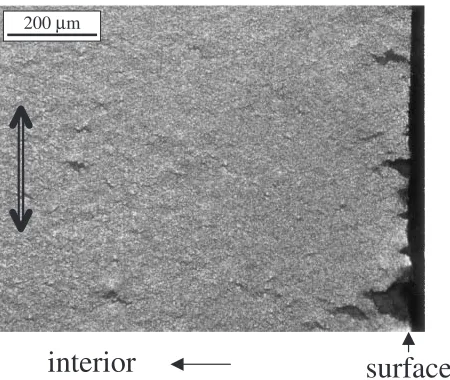
Figure 9 shows an optical micrograph of cavity appear-ances around the corner (surface) part in the parallel part of a tensile test specimen deformed to its fracture limit under condition E.8)As can be seen, cavities at a surface region of
the specimen are larger in size and number than those in its interior. This result clarifies the second problem of SEM analysis described above, that morphology of cavities at the surface region of deformed specimen is different from that at its interior due to different constraints of the cavitation behaviors between surface and interior regions of the specimen. This can also explain the reason of the difference
between the calculated scattering curves directly from SEM images and the measured ones appeared at the small Q
region, shown in Figs. 4(b) and (c).
According to the above stated reasons, an accurate-quantitative measurement of cavities as the bulk data by means of SEM analysis that seems simply to carry out at a laboratory scale needs adversely much attention. Ones must be careful that SEM analysis only gives data for the surface regions used in the observation. Therefore, the area fraction of cavities estimated from SEM analysis for superplastically deformed specimen may show the bulk characteristics of cavitation only qualitatively.
On the other hand, for the measurement using an Archimedes method with the immersion fluid of diethylph-thalate,22) the accuracy for bulk density is reported to be about30mg/cm3. The similar accuracy is assumed to arise in Archimedes method used in this study. Taking the bulk density of 3Y-TZP9) into consideration, the accuracy of
volume fraction of cavities may be about 0:5%. Since the contributions from individual cavities or from cavities having the same size and shape are difficult to distinguish, it is not easy to evaluate size distribution of cavities using this method. The presence of very large cavities (open pores) may also increase the immersion fluid filling them, resulting that the Archimedes method may discount them for cavitation characterization. However, since this method uses bulk information for calculation,i.e.bulk weight and bulk volume, the reliability of the results may not be influenced strongly by the different morphology of cavities at surface and at interior regions of specimen, as long as no open pores exist at the surface region.
It can be concluded here that: 1) SEM analysis may overlook the fine cavities due to the SEM resolution limit, and 2) The coalescence of cavities parallel to tensile direction to form large type (ii) cavities and that perpendicular to tensile direction to form large type (iii) ones might occur mainly at the surface region where SEM analysis was conducted, while the SANS and the density measurement methods cover a measuring volume including surface and interior regions.
SANS technique is one of the nondestructive methods that can be applied to characterize cavitation in superplastic materials. This technique can give bulk properties of pores or cavities with good reliability. However, it is preferable to have a two-component system such as matrix material and precipitates or voids. It is difficult to apply SANS for materials having multiple component system. SANS can be applied to a material having three-component system in which the matrix and one of the inclusions can be assumed unchanged during processes (deformation, heat treatment,
etc.).11)Moreover, SANS needs a good model to analyze the
obtained curves into real space data. To avoid complexity, simple models are generally assumed. Ones must be careful when figuring out the analyzed data.9,11)
The data collected from SANS measurement is averaged along the specimen thickness penetrated by neutron. There-fore, SANS measurement for only an internal part is difficult to conduct for as-deformed specimens. It needs to subtract the surface parts mechanically or chemically, neglecting the availability of nondestructive measurement. Meanwhile,
200 µm
surface
interior
Fig. 9 Appearance of cavities around the corner (surface) part of the parallel part of tensile test specimen for the specimen deformed to the fracture limit under condition E.
Cavity radius, rC / µm
0.0 0.2 0.4 0.6 0.8 1.0 1.2 1.4 1.6 1.8 2.0
50 100 150 200 250 300
at surface
at internal (center) part
Ca
vity number
,
NC
/ 10
mm
3
-2
[image:6.595.70.271.72.217.2] [image:6.595.56.281.555.745.2]preparation of a very thin specimen from a deformed test piece is not easy and is generally time consuming. Archi-medes method also adapts to these problems. Moreover, Archimedes method may give data with large ambiguity if the size of the specimen used in the measurement is too small.
3.3 Influence of cavity morphology on stress-strain curve
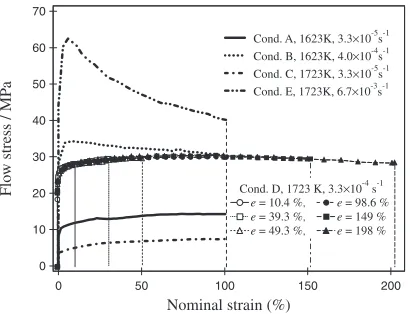
Figure 10 shows true stress vs. nominal strain curves of the 3Y-TZP specimens obtained from the superplastic deforma-tions under the condideforma-tions shown in Table 1. As can be seen, for the deformations under a proper superplastic condition (condition D) their flow stresses are almost constant after they exceeded the yield stress. For the deformations at other low strain rates (conditions A and C), the flow stresses are also almost constant (or slightly increase continuously probably due to a little grain growth) after they exceeded the yield stress. For the deformations at high strain rate or low temperature (conditions B or E), however, a comparatively large strain softening appeared in the stress-strain curves. It has been reported in our previous report8)that, the large strain
softening was due to the formation of crack-like flat cavities having very small gaps lying mostly normal to the tensile axis in addition to normal ones,i.e. type (i) and/or (ii) cavities. Since only the normal cavities are formed when deformed to strain amounts far from the fracture limits under conditions A, C and D and at low strain rates, the flow stresses are almost constant.
4. Conclusions
Characterization of cavities formed in a 3Y-TZP subjected to superplastic deformations under different deformation conditions was conducted by means of conventional meth-ods,i.e.image processing using scanning electron microsco-py images (SEM analysis) and density measurement (Archi-medes) method, and a novel small angle neutron scattering (SANS) method. The obtained data from the different methods were compared with each other to see the reliabilities of each data. Results from this study are summarized as follows:
(1) Morphology of cavities formed in the superplastically deformed 3Y-TZP specimens varied depending on the
deformation condition and the specimen dimension. (2) The accuracy of the bulk properties of cavities obtained
from SEM analysis, that seems easy to carry out at a laboratory scale, was very sensitive to the morphology of cavities. This may be caused by: a) the resolution limit of SEM, b) the measurement only at surface region, c) the observation at a limited area and d) the probability of presence of artifacts formed during surface preparation. SEM analysis has the advantage that it can observe size ditribution of cavities.
(3) Archimedes and SANS methods gave similar results, and show a better reliability than SEM analysis for bulk properties of cavities. The reliability of the data from Archimedes method is good, as long as no open pores and no artifacts due to surface preparation exist in the specimen surface regions. However, it is difficult to evaluate a size distribution of cavities from Archimedes method.
(4) SANS method is thought to be a best method to characterize cavities in the superplastically deformed 3Y-TZP, as long as a realistic model for data analysis is used, since SANS method can be performed without any surface preparation.
REFERENCES
1) N. Ridley and Z. C. Wang:Superplasticity 60 years after Pearson, ed. by N. Ridley (1995) pp. 63–74.
2) D. Pulino-Sagradi, A. M. M. Nazar, J.-J. Ammann and R. E. Medrano: Acta Mater.45(1997) 4663–4666.
3) Y. Ma and T. G. Langdon: Acta Metall.42(1994) 2753–2761. 4) Z. C. Wang, N. Ridley and T. J. Davies: J. Mater. Sci.34(1999) 2695–
2702.
5) S. Tekeli and T. J. Davies: Mater. Sci. Eng.A297(2001) 168–175. 6) D. J. Schissler, A. H. Chokshi, T. G. Nieh and J. Wadsworth: Acta
Metall. Mater.39(1991) 3227–3236.
7) S. Harjo, Y. Motohashi, J. Saroun, V. Ryukhtin, P. Strunz, M. Baron and R. Loidl: Mater. Sci. Forum447–448(2004) 67–72.
8) S. Harjo, J. Saroun, Y. Motohashi, N. Kojima, V. Ryukhtin, P. Strunz, M. Baron and R. Loidl: Mater. Trans.45(2004) 824–832.
9) S. Harjo, N. Kojima, Y. Motohashi, J. Saroun, V. Ryukhtin, P. Strunz, R. Loidl and M. Baron: Mater. Trans.43(2002) 2480–2486. 10) P. W. Schmidt: J. Appl. Crystallogr.24(1991) 414–435.
11) K. Hardman-Rhyne, N. F. Berk and E. R. Fuller, Jr.: J. Res. Natl. Stand. 89(1984) 17–34.
12) P. Strunz, J. Saroun, P. Mikula, P. Lukas and F. Eichhorn: J. Appl. Crystallogr.30(1997) 844–848.
13) J. Ilavsky, G. G. Long, A. J. Allen and C. C. Berndt: Mater. Sci. Eng. A272(1999) 215–221.
14) A. J. Allen, S. Krueger, G. G. Long, H. M. Kerch, H. Hahn and G. Skandan: Nanostructured Materials7(1996) 113–126.
15) J. E. Hilliard and J. W. Cahn: Trans. Metall. AIME 221 (1959) 344–352.
16) J. Saroun: J. Appl. Crystallogr.33(2000) 824–828. 17) A. H. Chokshi: Key Eng. Mater.56–57(1991) 349–364.
18) V. Ryukhtin, J. Sˇaroun, S. Harjo, Y. Motohashi, M. Baron and R. Loidl: J. Appl. Crystallogr.36(2003), 478–483.
19) V. Ryukhtin, J. Sˇaroun, S. Harjo, Y. Motohashi, A. Wiedenmann and P. Strunz: In Proc. of the ECNS 2003, September 3–6, 2003, Montpellier, France.
20) For example: M. Kotlarchyk, S. H. Chen, J. S. Huang and M. W. Kim: Phys. Rev. A29(1984) 2054–2069.
21) For example: D. I. Svergun and M. H. J. Koch: Rep. Prog. Phys.66 (2003) 1735–1782.
22) M. Hoffmann and R. Birringer: Acta Mater.44(1996) 2729–2736. 70
60
50
40
30
20
10
0
Flo
w stress / MP
a
200 150
100 50
0
Nominal strain (%)
Cond. A, 1623K, 3.3×10⁻⁵s-1 Cond. B, 1623K, 4.0×10⁻⁴s-1 Cond. C, 1723K, 3.3×10⁻⁵s-1 Cond. E, 1723K, 6.7×10⁻³s-1
[image:7.595.68.273.71.228.2]Cond. D, 1723 K, 3.3×10⁻⁴ s-1 e = 10.4 %, e = 98.6 % e = 39.3 %, e = 149 % e = 49.3 %, e = 198 %