Frequent Sequential Pattern Discovery for Data
Screening
Hisashi Tsuruta, Takayoshi Shoudai, and Jun’ichi Takeuchi
Abstract—To early detect and defend the threats in the Internet caused by botnet, darknet monitoring is very important to understand various botnet activities. However, common illegal accesses by ordinary malwares makes such detection difficult. In this paper, in order to remove such accesses by ordinary malwares from the results of network monitoring, we propose a data screening method based on finding frequent sequential patterns which appear in given traffic data. Besides, we apply our method to traffic data observed in darknet and report the results.
Index Terms—incident detection, frequent pattern mining, sequential pattern, data screening, darknet monitoring.
I. INTRODUCTION
T
HE rapid growth of the high-speed Internet access service and mass storage media brings us not only the benefits of society but also many harmful effects. A notorious example of them is the social damages caused by various computer viruses. The bot worm is a typical example of criminal computer viruses, which is an Internet software controlled by a bot herder. Its infection spreads in a computer network. A bot herder can control the infected computers as a network, which is called botnet, and cause many incidents such as DDos attacks, sending a huge spam mails and so on. To construct efficient countermeasures against these incidents, many researches are studying effective methods for early detection of tendencies of such incidents [1], [2], [3].Our purpose is knowledge discovery to detect signs of inci-dents. If we could prevent them, the safety and the confidence of the Internet would be increased. Many researchers extract tendencies of particular senders or patterns and analyze them to detect evidence of new attacks. For example, Kim et al. [6] proposed a Flow-based method for abnormally detectors and Fukushima et al. [5] proposed a method which focuses on the average number of packets sent by a source address and its frequency of appearances to find the subtle attacks.
On the other hand, when it comes to anomaly detection, illegal packets caused by the well-known malwares make it harder. Then, we focus on finding attack patterns of the well-known malwares. Majority of them could often be detected easily by ignorant people about network incidents. Therefore we define them as a class of time-span sequence patterns which is easily detected by computers. Furthermore we introduce a method to discover a set of frequent patterns which appear in the darknet observation data and delete packets caused by them. Many researchers are interested in
Manuscript received January 7, 2011; revised February 7, 2011. H. Tsuruta, T. Shoudai, J. Takeuchi are with Department of Informatics, Kyushu University, 744 Motooka, Nishi-ku, Fukuoka 819-0395, Japan, and with Institute of Systems, Information Technologies and Nanotechnologies (ISIT), 2-1-22 Momochihama, Sawara-ku, Fukuoka 814-0001, Japan, e-mail:{hisashi.tsuruta, shoudai, tak}@inf.kyushu-u.ac.jp
frequent pattern discovery from data having structures such as web data [7], chemical compounds [8], and so on.
In this paper, we utilize a data observed in the dark-net, which is a network that cannot be accessed through conventional means. Most of all packets which the darknet receives are illegal, so they could be considered as traces of malicious attacks. Therefore we might detect attack patterns by malwares in the darknet access record.
We think of each packet as a three tuple (transmitter’s address, transmitter’s port, receiver’s port), and call it an event. Moreover We call an event with its received time an incident. The observation data, called an incident database, is a set of incidents. We regard each item of an event as a string and propose a pattern class of sequences of string patterns with time delays. The following pattern is an example of incident patterns, called event pattern delay sequences (EPD sequences) in this paper.
(??.???.∗.∗,∗,445)
0.50
−→ (??.∗.∗.∗,?345,?????)
0.50
−→ (??.∗.∗.∗,?345,?????)
In the above example, ’?’ stands for any one constant symbol, and ’∗’ stands for any string whose length is at least1. Each of the three items in a round bracket respectively denotes transmitter’s address, transmitter’s port number and receiver’s port number. The real number over a right arrow means the maximum time delay between the first pattern and the second pattern (or the second pattern and the third pattern)1.
In this paper, firstly we introduce a class of EPD sequences in order to represent common illegal packets, and formally discuss a computational problem of finding EPD sequences in a given incident database. Next we give an effective heuristic algorithm to discover EPD sequences in an incident database. Lastly we propose an automatic data screening method and report experimental results on darknet traffic data.
II. PRELIMINARIES
LetX be a set of distinct events. For an evente∈X, let
tbe a time when the eventeoccurs. We call a pair(t, e)an incident, and a set of incidents an incident database.
Definition 1 (ED sequences): Let r be a positive integer and Tmax a positive real number. Let a1, a2, . . . , ar be r
events (not necessarily distinct). And letτ1, τ2, . . . , τr−1 be
r−1 positive real numbers which are less than or equal toTmax. Then we call π= (a1, τ1, a2, τ2, . . . , τr−1, ar)an
1This pattern is discovered during a period of receiving first 10,000
(r, Tmax)-event delay sequence(abbreviated to(r, Tmax)-ED
sequence).
Definition 2 (Matching of ED sequences): Let D be an incident database and π = (a1, τ1, a2, τ2, . . . , τr−1, ar) an
(r, Tmax)-ED sequence. For a subsetD′ofDwith|D′|=r,
we say thatπ matchesD′ if the following conditions hold: Let ((t1, e1),(t2, e2), . . . ,(tr, er)) be a sorted sequence of
the incidents in D′ with respect to ti (1 ≤ i ≤ r), i.e.,
t1≤t2≤ · · · ≤tr. Then,
(a) for all i(1≤i≤r),ei=ai, and
(b) for all i(1≤i≤r−1),ti+1−ti≤τi.
Definition 3 (Cover rate of ED sequences): For an inci-dent databaseDand an(r, Tmax)-ED sequenceπ, we denote
by D(π) the union of all subsets of D which are matched byπ, i.e.,
D(π) = ∪
D′⊆Ds.t.πmatchesD′ D′.
The cover rate of π for D is defined as coverD(π) = |D(π)|
|D| . Let P be a set of (r, Tmax)-ED sequence and D(P) =∪π∈PD(π). The cover rate ofP for D is defined
as coverD(P) =
|D(P)| |D| .
First of all, we consider the following computational problem, which plays an important role in this paper.
R-EVENT DELAY SEQUENCE COVER (R-EC) INSTANCE: An incident database D, a cover rate σ (0 ≤
σ≤1), a maximum time delay Tmax, and a positive integer
K.
QUESTION: Is there a setPof(R, Tmax)-ED sequences such
that |P| ≤K and the cover rate ofP for D is at leastσ?
We show the following theorem.
Theorem 1: 3-EC is NP-complete.
Proof: It is easy to see that3-EC is in NP. We construct a reduction from the following well-known NP-complete problem X3C.
EXACT COVER BY 3-SETS (X3C)
INSTANCE: A set X with |X|= 3q and a collection C of 3-element subsets ofX.
QUESTION: Does C contain an exact cover for X, i.e., a subcollectionC′ ⊆C such that every element of X occurs in exactly one member of C′?
Let X = {e1, e2, . . . , en} where n = 3q and C =
{c1, c2, . . . , cm} whereci ={a (1)
i , a
(2)
i , a
(3)
i } (1≤i≤m).
We construct an incident database D as follows. Let D′ = {((i−1)(n+ 2) +j, a(ij))|1≤i≤mandj= 1,2,3}and
D′′={(m(n+ 2) +k, ek)|1≤k≤n}. LetD=D′∪D′′,
σ= (3q+n)/(3m+n),Tmax=n−1, andK=q.
First, we suppose that X3C returns true. Then we have an exact cover C′ = {ci1, ci2. . . , ciq} (1 ≤ i1 < i2 <
· · · < iq ≤ m). Let P = {(a(1)i
ℓ , Tmax, a
(2)
iℓ , Tmax, a
(3)
iℓ ) |
1 ≤ℓ≤q}. It is easy to see that |∪π∈PD′(π)|= 3q and |∪π∈PD′′(π)| =n. Then the cover rate of P is equal to σ= (3q+n)/(3m+n). Therefore3-EC returns true.
Conversely, we suppose that 3-EC returns true. Then there is a set P of (3, Tmax)-ED sequences such that
|P| ≤ q. Let P = {(α(1)ℓ , τℓ, α
(2)
ℓ , τℓ′, α
(3)
ℓ ) | 1 ≤ ℓ ≤ q} where α(1)ℓ , α(2)ℓ , α(3)ℓ ∈ {e1, e2, . . . , en} and τℓ, τℓ′ ≤ Tmax. Since |
∪
π∈PD(π)| ≥ 3q +n and |D′′| = n,
|∪π∈PD′(π)| ≥ 3q. Therefore, for each (3, Tmax)-ED
sequence (α(1)ℓ , τℓ, α(2)ℓ , τℓ′, α(3)ℓ ), there is an index f(ℓ) (1≤f(ℓ)≤m)such that3continuous time events{((f(ℓ)− 1)(n+ 2) + 1, a(1)f(ℓ)),((f(ℓ)−1)(n+ 2) + 2, a(2)f(ℓ)),((f(ℓ)−
1)(n+2)+3, a(3)f(ℓ))}are matched by(α(1)i , τi, α(2)i , τi′, α(3)i ).
It is easy to see thatC′={{α(1)f(ℓ), α(2)f(ℓ), α(3)f(ℓ)} |1≤ℓ≤q}
is an exact cover forX.
In the next section, we give an effective heuristic algorithm to compute one of the more generalized problems within the framework of3-EC.
III. EVENTPATTERNDELAYSEQUENCECOVER
Let N and k1, k2, . . . , kN be positive integers. Let ’?’
and ’∗’ be two special symbols. LetΣ be a finite alphabet which include neither ’?’ nor ’∗’ (i.e.,Σ∩ {’?’,’∗’} =∅). Below, an event is an object which consists of N strings
w1, w2, . . . , wN in Σ∗, each of whose length is at most
ki (1 ≤ i ≤ N). Then we denote an event by e = (w1, w2, . . . , wN)∈Σk1×Σk2× · · · ×ΣkN.
An atom pattern is a string inω∈(Σ∪{’?’})+∪{’∗’}. For
any atom patternω, we denote by|ω|the length ofω. For an atom patternω, ifω=’∗’, we can replace ’∗’ with an atom patternω′∈(Σ∪ {’?’})+. Ifω includes ’?’, we can replace
it with a symbol in Σ. We call a set of such replacements a substitution. Let θ be a substitution. We denote by ωθ
the atom pattern which is obtained from ω by applying all replacements inθtoω.
We denote byP the set of atom patterns. For an integer
k, we denote byP[k] the set of atom patterns inP of length
at mostk. For two atom patterns ω, ω′, we writeω′ ⪯ω if there is a substitutionθ such thatω′=ωθ.
Definition 4 (Event patterns): We call a sequence of atom patternsp= (ω1, ω2, . . . , ωN)∈ P[k1]× P[k2]× · · · × P[kN]
an event pattern. For an evente= (w1, w2, . . . , wN)and an
event pattern p = (ω1, ω2, . . . , ωN), we write e⪯ p if for
alli(1≤i≤N),wi⪯ωi.
In a similar way to Def. 1, we define an event pattern delay sequence.
Definition 5 (EPD sequences): Letrbe a positive integer and Tmax a positive real number. Let p1, p2, . . . , pr be r
event patterns. And letτ1, τ2, . . . , τr−1ber−1positive real
numbers which are less than or equal toTmax. Then we call
π= (p1, τ1, p2, τ2, . . . , τr−1, pr) an (r, Tmax)-event pattern
delay sequence(abbreviated to (r, Tmax)-EPD sequence).
Definition 6 (Matching of EPD sequences): Let D be an incident database and π = (p1, τ1, p2, τ2, . . . , τr−1, pr)
an (r, Tmax)-EPD sequence. For a subset D′ of D with
|D′| = r, In similar way to Def. 2, we say that
π matches D′ if the following conditions hold: Let ((t1, e1),(t2, e2), . . . ,(tr, er)) be a sorted sequence of the
incidents in D′ with respect to ti (1 ≤ i ≤ r), i.e.,
t1≤t2≤ · · · ≤tr. Then,
(a) for alli (1≤i≤r),ei⪯pi, and
LetDbe an incident database. In a similar way to Def. 3, we define the cover rate of an EPD sequence πfor D and the cover rate of a set P of EPD sequences forD.
In order to consider a similar computational problem to 3-EC, we have to define an ordering on EPD se-quences. The most generalized EPD sequence is π0 =
(p0, Tmax, p0, . . . , Tmax, p0), where p0 = (∗| {z },∗, . . . ,∗
N
). All
incidents in any incident database can be covered byπ0 but
it is meaningless.
Definition 7 (Size of delay sequences): For an event pat-ternp∈ P[k1]×P[k2]×· · ·×P[kN], we denote byn
Σ(p)the
number of symbols in Σwhich appear in p, and by n’?’(p) the number of ’?’ which appear inp. We define the size of an event patternpas
size(p) =nΣ(p)×(Q+ 1) +n’?’(p),
whereQ=
N ∑
i=1
ki.
Letπ= (p1, τ1, p2, τ2, . . . , τr−1, pr)be an(r, Tmax)-EPD
sequence. We define the size ofπas follows:
size(π) =
r ∑
i=1
size(pi) + r−1
∑
i=1
(Tmax−τi).
For any (r, Tmax)-EPD sequence π, size(π) ≥ 0. And
size(π0) = 0 for π0 = (p0, Tmax, p0, . . . , Tmax, p0), where
p0= (∗,∗, . . . ,∗).
In a similar way to the definition ofR-EC, we defineR -EVENT PATTERN DELAY SEQUENCE COVER (R-EPC) as follows:
R-EVENT PATTERN DELAY SEQUENCE COVER (R -EPC)
INSTANCE: An incident database D and the following four parameters:
(a)K: a maximum number of EPD sequences, (b) σ: a minimum cover rate(0≤σ≤1), (c)S: a minimum size of event patterns, (d) Tmax: a maximum time delay.
QUESTION: Is there a set P of (R, Tmax)-EPD
se-quences that satisfy the following conditions: for all π = (p1, τ1, . . . , τR−1, pR)∈P,
(a)|P| ≤K, (b) coverD(P)≥σ,
(c)size(pi)≥S (1≤i≤R), and (d) τi≤Tmax (1≤i≤R−1).
We can easily see the following theorem from Theorem 1.
Theorem 2: 3-EPC is NP-complete.
IV. HEURISTICALGORITHMS FORR-EPC
A. An Apriori-like method
In this section, we give a heuristic algorithm for computing
R-EPC by using an Apriori-like method twice.
LetDbe an incident database. We denote byDithe set of all the i-th stringswi of the incidents(t,(w1, w2, . . . , wN))
inD. For anyi(1≤i≤N)and atom patternω∈ P[ki], let
f reqDi(ω) = |{wi∈Di |wi⪯ω}|
|Di| . For any event pattern p∈ P[k1]× P[k2]× · · · × P[kN], let
f reqD(p) =
|{e| ∃ts.t. (t, e)∈D ande⪯p}|
|D| .
Algorithm FIND EPD SEQUENCES(FES);
Input: D = {(t, e) | t > 0 ande ∈ Σk1 ×Σk2 × · · · ×
ΣkN.}: an incident database,σ: a minimum cover rate, S: a
minimum size of(R, Tmax)-EPD sequences;
Let δ be a positive real number smaller than σ. This parameter δ plays an important role in this algorithm to produce a good set of(R, Tmax)-EPD sequences.
1) LetDa
i :={wi|(t,(w1, . . . , wi, . . . , wN))∈D}(1≤
i≤N); For all i (1≤i≤N), we compute the sets
Ai:
Ai:={ω∈ P[ki]|f reqDa
i(ω)≥δ};
2) We compute the set of event patterns F (Procedure FREQ EVENT PATTERNS (Fig. 1)):
F ={p∈ P[k1]×P[k2]×· · ·×P[kN] |f req
D(p)≥δ};
3) We compute the set of (R, Tmax)-EPD sequences P
(Procedure FREQ PATTERN SEQUENCES (Fig. 2)):
P ={π= (p1, Tmax, . . . , Tmax, pR)|f reqD(π)≥δ};
4) For each (R, Tmax)-EPD sequence π =
(p1, τ1, . . . , τR−1, pR) in P, we try to decrease
each time delay τℓ (1 ≤ ℓ ≤ R − 1) as much
as possible (Procedure UPDATE TIME DELAYS (Fig. 3)).
5) OutputP.
B. A machine learning method
Here we define a partial order on EPD sequences and a concept of maximal EPD sequences on a given incident database. And then we give an idea of an algorithm for solving our problem.
Let π = (p1, τ1, p2, τ2, . . . , τr−1, pr) be an (r, Tmax
)-EPD sequence and π′ = (p′1, τ1′, p′2, τ2′, . . . , τr′′−1, p′r′) an
(r′, Tmax)-EPD sequence. We write π′ ⪯ π if r′ ≥ r and
there are rintegers j1, j2, . . . , jr with1≤j1 < j2<· · ·<
jr≤r′ such that for alli (1≤i≤r),
p′ji⪯pi and ji∑+1−1
ℓ=ji
t′ℓ≤ti.
Definition 8 (Maximal EPD sequences): LetD be an in-cident database and σa minimum cover rate (0 ≤σ ≤1). We say that π is a maximal (r, Tmax)-EPD sequence with
respect toDandσif there is no(r, Tmax)-EPD sequenceπ′
(π′̸=π)such thatπ′ ⪯π andcoverD(π′)≥σ.
LetP be a set of(r, Tmax)-EPD sequence. we say thatP
is a maximalK-set of(r, Tmax)-EPD sequences with respect
toD andσ if the following four conditions hold:
1) |P| ≤K, 2) coverD(P)≥σ,
3) for any pair π, π′ ∈ P (π ≠ π′), neither π⪯π′ nor
Procedure FREQ EVENT PATTERNS(D, δ, N,{Ai});
Input:D: an incident database,δ: a real number,N: an integer,{Ai}: a collection of sets of atom patterns; begin
F1:=
∪
1≤i≤N
∪
ω∈Ai{p= (ω1, . . . , ωℓ, . . . , ωN)|ifℓ=ithenωℓ=ω else ωℓ=’∗’};
fork:= 2 to N do begin
Fk :=∅;
foreachp, p′ ∈Fk−1 do begin
Let p= (ω1, ω2, . . . , ωN)andp′= (ω1′, ω′2, . . . , ω′N);
if there are two indicesi andj (i < j)which satisfy the following conditions: 1. ωℓ=ω′ℓ (1≤ℓ≤N, ℓ̸=i, andℓ̸=j),
2. ωi̸=’∗’ andωℓ=’∗’(i+ 1≤ℓ≤N), and
3. ω′j̸=’∗’ andω′ℓ=’∗’(i≤ℓ≤j−1, j+ 1≤ℓ≤N) then begin
Letp′′= (ω1′′, . . . , ωℓ′′, . . . , ω′′N)be the event pattern s.t. if ℓ=j thenωℓ′′=ω′ℓ elseω′′ℓ =ωℓ; iff reqD(p′′)≥δthen Fk :=Fk∪ {p′′}
end end end;
returnF :=∪1≤k≤NFk
[image:4.595.46.530.50.299.2]end;
Fig. 1. Procedure FREQ EVENT PATTERNSwhich is used at Step 2 in Algorithm FES.
Procedure FREQ PATTERN SEQUENCES(F, D, δ, R);
Input;F: a set of event patterns,D: an incident database,δ: a real number,R: an integer; begin
P1:=F;
forr:= 2 to Rdo begin
Pr:=∅;
foreachπ, π′ ∈Pr−1do begin
Let π= (p1, Tmax, . . . , Tmax, pr−1)andπ′= (p′1, Tmax, . . . , Tmax, p′r−1);
if πandπ′ satisfy the following conditions: for all i(1≤i≤r−2),pi =p′i, andpr−1̸=p′r−1
then begin
Letπ′′:= (p1, Tmax, . . . , Tmax, pr−1, Tmax, p′r−1);
ifcoverD(π′′)≥δthen Pr:=Pr∪ {π′′}
end end end; returnPR
end;
Fig. 2. Procedure FREQ PATTERN SEQUENCESwhich is used at Step 3 in Algorithm FES.
4) for any π ∈ P, there is no (r, Tmax)-EPD sequence
π′ ̸∈ P such that π′ ⪯ π and coverD(P − {π} ∪
{π′})≥σ.
We define R-MAXIMAL EVENT PATTERN DELAY SEQUENCE COVER (R-MEPC) as follows:
R-MAXIMAL EVENT PATTERN DELAY SEQUENCE COVER (R-MEPC)
INSTANCE: An incident database D and the following four parameters:
K: a maximum number of EPD sequences, σ: a minimum cover rate (0≤σ≤1),Tmax: a maximum time delay.
QUESTION: Is there a maximal K-set P of (R, Tmax
)-EPD sequences that satisfy the following conditions: (i)
coverD(P)≥σand (ii) for allπ= (p1, τ1, . . . , τR−1, pR)∈
P,τi≤Tmax.
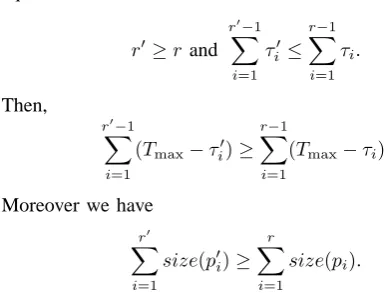
Proposition 1: Let π andπ′ be (r, Tmax)-EPD sequence
and(r′, Tmax)-EPD sequence, respectively. Then, if π′⪯π
thensize(π′)≥size(π).
Proof: First, we show that p′ ⪯ p ⇒ size(p′) ≥
size(p). By the definition of the size of an event pattern, we have
size(p′)−size(p)
= (Q+ 1)(nΣ(p′)−nΣ(p)) + (n’?’(p′)−n’?’(p)).
From the definition of ’⪯’, symbols in Σwhich appears in
p must appear in p′. Therefore we have nΣ(p) ≤ nΣ(p′)
anytime. Since the absolute value of the first term is larger than or equal to that of the second term,size(p′)−size(p)≥ 0is satisfied even if the absolute value of the second term is negative. Therefore, we havep′ ⪯p⇒size(p′)≥size(p).
Let π = (p1, τ1, p2, τ2, . . . , τr−1, pr) and π′ =
[image:4.595.43.538.309.536.2]Procedure UPDATE TIME DELAYS(P, D, σ, S);
Input:P: a set of EPD sequences,D: an incident database, σ: a real number,S: an integer; begin
foreach π= (p1, Tmax, . . . , Tmax, pR)∈P do begin
π′:=π; P:=P− {π};
T(π) :={(t1, t2, . . . , tR)|there is a subsetD′={(t1, e1),(t2, e2), . . . ,(tR, eR)} ⊆D s.t.
πmatches D′ wheret1≤t2≤ · · · ≤tR};
forℓ:= 1 toR−1 do begin
Let Tℓ(π) ={tℓ+1−tℓ|(t1, . . . , tℓ, tℓ+1, . . . , tR)∈T(π)};
Let Tord
ℓ (π)be the decreasing ordered sequence of Tℓ(π), i.e.,Tℓord(π) = (τ
(1)
ℓ , . . . , τ
(|Tℓ(π)|)
ℓ ),
whereTℓ(π) ={τ
(1)
ℓ , . . . , τ
(|Tℓ(π)|)
ℓ }andτ
(1)
ℓ >· · ·> τ
(|Tℓ(π)|)
ℓ ;
fori:= 1to |Tℓ(π)| do begin
Letπ′′ be the EPD sequence obtained fromπ′ by replacing thei-th time delay withτℓ(i); ifcoverD(P∪ {π′′})≥σand size(π′′)≥S thenπ′ :=π′′;
end end;
P :=P∪ {π′}
end; returnP
[image:5.595.46.240.351.498.2]end;
Fig. 3. Procedure UPDATE TIME DELAYSwhich is used at Step 4 in Algorithm FES.
equations hold:
r′≥rand
r∑′−1
i=1
τi′≤ r−1
∑
i=1
τi.
Then,
r∑′−1
i=1
(Tmax−τi′)≥ r−1
∑
i=1
(Tmax−τi).
Moreover we have
r′ ∑
i=1
size(p′i)≥
r ∑
i=1
size(pi).
From the definition of the size of an EPD sequence, we have
π′ ⪯π⇒size(π′)≥size(π).
We can solve R-MEPC by specializing EPD-sequences step by step with a machine learning method proposed by Arimura et al. [4]. We omit the detail of the strategy. From Prop. 1, a maximal K-set of (R, Tmax)-EPD sequences has
a local optimal solution with respect to its size. In the next section, we use Algorithm FES rather than a strategy based on maximalities, in order to obtain a set of EPD sequences which has a sufficient large size.
V. APPLICATION TO ASCREENINGMETHOD FOR INTERNETACCESSLOGS
A. A screening method
In this section, we propose a screening method for remov-ing irregular packets which are supposed to be occurred by well-known malwares.
We assume that any eventeis an element ofΣk1×Σk2×
· · · ×ΣkN.
Algorithm SCREENING(SCR);
Input: D = {(t, e) | t > 0 ande ∈ Σk1 ×Σk2 × · · · ×
ΣkN.}: an incident database, σ: a minimum cover rate,S: a
minimum size of(R, Tmax)-EPD sequences;
Output:D′: screened incident database;
1) Let P be an output of Algorithm FES for inputs D,
σ, andS;
2) OutputD−D(P);
Algorithm SCR takes exponentially large time depending on the size of a given incident database|D|. To overcome this difficulty, we divide a given database into some smaller databases whose sizes are specified previously.
Algorithm LARGE SCREENING(LSC);
Input: D = {(t, e) | t > 0 ande ∈ Σk1 ×Σk2 × · · · ×
ΣkN.}: an incident database,σ: a minimum cover rateσ,S:
a minimum size of (R, Tmax)-EPD sequences, s: a size of
small databases;
Output:D′: screened incident database.
1) Let ((t1, e1),(t2, e2). . . ,(t|D|, e|D|)) be the
time-sorted sequence of D, i.e., t1 ≤ t2 ≤ · · · ≤ t|D|;
Letκ:=⌊|D|/s⌋;
2) For all i (1 ≤ i ≤ κ), let Di :=
{(ts·(i−1)+1, es·(i−1)+1), . . . ,(ts·i, es·i)}; Ifκ·s <|D|,
letDκ+1:={(ts·κ+1, es·κ+1), . . . ,(t|D|, e|D|)};
3) For eachDi (1≤i≤κ+ 1), let Di′ be an output of Algorithm SCR for inputs Di,σ, andS;
4) OutputD′:=∪1≤i≤κ+1D′i;
B. Experiments on Internet access logs
24th May, 2009 !" #!!!!" $!!!!" %!!!!" &!!!!" '!!!!!" '#!!!!" '$!!!!" !( !!" !( )!" '( !!" '( )!" #( !!" #( )!" )( !!" )( )!" $( !!" $( )!" *( !!" *( )!" %( !!" %( )!" +( !!" +( )!" &( !!" &( )!" ,( !!" ,( )!" '!( !!" '!( )!" ''( !!" ''( )!" '#( !!" '#( )!" ')( !!" ')( )!" '$( !!" '$( )!" '*( !!" '*( )!" '%( !!" '%( )!" '+( !!" '+( )!" '&( !!" '&( )!" ',( !!" ',( )!" #!( !!" #!( )!" #'( !!" #'( )!" ##( !!" ##( )!" #)( !!" #)( )!"
Before screening After screening
25th May, 2009
!" #!!!!" $!!!!" %!!!!" &!!!!" '!!!!!" '#!!!!" '$!!!!" '%!!!!" !( !!" !( )!" '( !!" '( )!" #( !!" #( )!" )( !!" )( )!" $( !!" $( )!" *( !!" *( )!" %( !!" %( )!" +( !!" +( )!" &( !!" &( )!" ,( !!" ,( )!" '!( !!" '!( )!" ''( !!" ''( )!" '#( !!" '#( )!" ')( !!" ')( )!" '$( !!" '$( )!" '*( !!" '*( )!" '%( !!" '%( )!" '+( !!" '+( )!" '&( !!" '&( )!" ',( !!" ',( )!" #!( !!" #!( )!" #'( !!" #'( )!" ##( !!" ##( )!" #)( !!" #)( )!"
[image:6.595.107.490.64.243.2]Before screening After screening
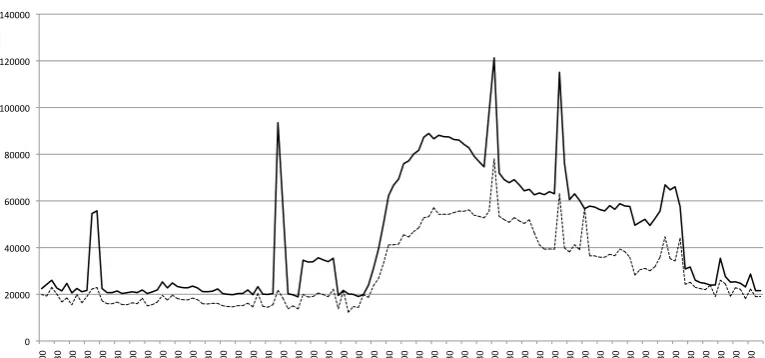
Fig. 4. The solid line (resp. dotted line) means the number of packets before (resp. after) screening every ten minutes. The numbers of packets after screening are 4,258,470 (24th May, 2009, remaining rate 66.98%) and 3,039,185 (25th May, 2009, remaining rate 75.55%), respectively.
port-1 and port-2. Then, we have a set of atom data Da i
(1≤i≤6)(defined in Algorithm FES) which includes all atom data about address-i(1≤i≤4)and port-i(i= 1,2). Each address-i is a string in {0,1, . . . ,255}, and port-i is a string in {0,1, . . . ,65535}. Then an event consists of 6 strings whose lengths are at most3,3,3,3,5,5, respectively. In the following experiment, we consider only (3, Tmax
)-EPD sequences. The second parameter Tmax is specified
later.
In the screening algorithm LSC, if an input incident database is larger than s which is the maximum quantities of packets in each data, we divide it to some data whose quantities of packets are s. We call the time span between the first received packet and the last received packet in each data the attack period of the data. When the attack period is short, many packets are received in a short period of time.
• Experimental Data.
The observation data and the quantity of packets, which
[image:6.595.107.491.288.483.2]we used in each experiments, are shown in Table I.
TABLE I
DARKNET OBSERVATION DATE AND QUANTITIES OF RECEIVED PACKETS
Observation day Total packets received 8th Nov, 2006 4,039,197 10th Sep, 2008 2,864,698 23rd Jan, 2009 2,884,381 2nd Apr, 2009 10,261,071 24th May, 2009 6,358,187 25th May, 2009 4,022,849 21th Jun, 2009 2,275,630 12th Jul, 2009 6,691,671
• Parameters for screening. – Cover rate: σ= 0.1.
– Maximum time delay:Tmax= 0.5(second).
!" #" $" %" &" '!" '#" '$" '%"
!" (" '!" '(" #!" #(" )!" )(" $!" $(" (!" ((" %!" %(" *!" *(" &!" &(" +!" +(" '!!"
(1.2,1.6)-peak (1.6,2.0)-peak 2.0-peak
!" #!" $!" %!" &!" '!!" '#!" '$!" '%!" '&!" #!!"
!" (" '!" '(" #!" #(" )!" )(" $!" $(" (!" ((" %!" %(" *!" *(" &!" &(" +!" +(" '!!"
[image:7.595.154.439.56.421.2]non-peak
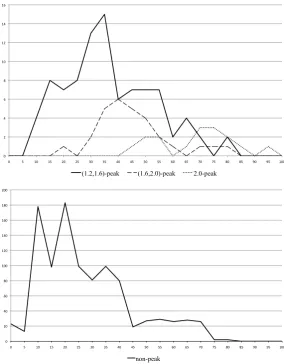
Fig. 5. In the upper graph, the solid line, broken line, and dotted line show the numbers of peaks against their cover rates of the(1.2,1.6)-peak set,
(1.6,2.0)-peak set, and2.0-peak set, respectively. Similarly, the lower graph describes the line for the non-peak set (i.e.,(0,1.2)-peak set). The average cover rates are 38.44%, 47.73%, 70.72%, and 29.90% for the(1.2,1.6)-peak set,(1.6,2.0)-peak set,2.0-peak set, and non-peak set, respectively.
– Upper bound of packets in each divided data: s= 10,000. For example, the observation databases of 24th May, 2009 and 25th May, 2009 are divided into 637 and 403 files (incident databases), respec-tively.
We show the relationship between the quantities of screened database and the unit time in Fig.4, where the upper graph is for 24th May, 2009 and the lower graph for 25th May, 2009. Those two graphs shows the transition of quantities of packets which is received per 10 minutes in the time sequence each day and the quantities of packets which is left by screening the packets. The horizontal and vertical axes mean time sequence and the quantities of packets, respectively. The solid and dotted lines mean the quantities of packets before and after screening, respectively. A peak of the solid lines shows a mass of packets are received during a short period. In the graph for 24th May, 2009, there is no peak of the dotted line. And so, we can say attacks indicated by peaks of the solid line are caused by well-known malwares, and our screening method could detective them. Therefore, we achieved our purpose, removing of packets caused by well-known malwares. Furthermore, in the graph for 25th May, 2009, most of the peaks of the solid line are removed by the screening. But, around 16:30, a peak of the
solid line still remains after screening. There are also many packets caused by complex attack patterns which cannot be detected by our method.
In Table II, we show the quantities of remained packets obtained from databases in Table I with their cover rates. The average cover rate of all databases is 36.39%.
TABLE II
QUANTITIES OF REMAINED PACKETS AFTER SCREENING AND THEIR COVER RATES
Observation day Total remained packets Cover rate (%) 8th Nov, 2006 2,006,190 50.33 10th Sep, 2008 1,736,558 39.38 23rd Jan, 2009 1,775,265 38.45 2nd Apr, 2009 7,336,516 28.50 24th May, 2009 4,258,470 33.02 25th May, 2009 3,039,185 24.45 21th Jun, 2009 1,797,655 21.00 12th Jul, 2009 3,109,089 53.54
[image:7.595.318.534.612.701.2]-peak but not ann-peak. LetI be a 10 min interval. Lett(I) and r(I) be a start time of I and the cover rate of I after screening. We call the set of all pairs(t(I), r(I))ofm-peaks
I an m-peak set. We define an(m, n)-peak set similarly. We obtained the(1.2,1.6)-peak set,(1.6,2.0)-peak set and 2.0-peak set from screened results of all data in Table I. We show the distribution of the number of peaks against their cover rates in Fig. 5, where the upper graph describes the (1.2,1.6)-peak set,(1.6,2.0)-peak set and2.0-peak set, and the lower graph describes the non-peak set (i.e.,(0,1.2)-peak set). The horizontal and vertical axes mean the cover rates and the number of peaks, respectively. In the upper graph, the solid, broken, and dotted lines mean (1.2,1.6)-peak, (1.6,2.0)-peak, and2.0-peak, respectively. For example, for the(1.2,1.6)-peak set, the number of peaks whose cover rate is more than or equal to 15% and less than 20% is8. We can say the higher the peak is, the larger the cover rate. In other words, our method succeeds to detect attacks by malwares that has simple attack patterns even if the quantities of them are large.
VI. CONCLUSIONS
In this paper, we proposed a screening method taking advantage of time-span sequential patterns. Moreover we applied our proposed method to darknet observation data and showed its effectiveness for identification of packets caused by well-known malwares. In many cases the reduction rate before and after screening is proportional to the frequency of receiving packets. But experiments showed there are some cases the reduction rate is low despite the concentrated attacks.
As future works, we should inspect to declare the relation between the reduction rate and the frequency of receiving packets on tuning appropriate establishments. Furthermore, to attain the online screening, we are considering efficient algorithms to find a set of time-span sequential patterns.
Acknowledgments
This research is partially supported by the National Institute of Information and Communications Technology (NICT) of Japan, entitled ”Research and Development for Widespread High-speed Incident Analysis”, and partially supported by the Japanese Ministry of Education, Science, Sports and Culture, Grant-in-Aid for Scientific Research (C), 20500016, 2008-2010.
REFERENCES
[1] nicter project.
https://www2.nict.go.jp/y/y211/index.html
[2] SANS Internet Storm Center. http://isc.sans.org/
[3] JPCERT/CC.http://www.jpcert.or.jp
[4] H. Arimura, T. Shinohara, and S. Otsuki. Finding Minimal Generaliza-tions for Unions of Pattern Languages and Its Application to Inductive Inference from Positive Data. In Proc. the 11th STACS, Springer, LNCS 775, pages 649–660, 1994.
[5] Y. Fukushima, Y. Hori, K. Sakurai. A Consideration of Feature Extraction for Attacks on Darknet. IEICE technical report, Vol.109, No.285, pages 37–42, 2009 (in japanese).
[6] M. Kim, H. Kang, S. Hong, S. Chung, and J.W. Hong. A Flow-based Method for Abnormal Network Traffic Detection. Proc. IEEE/IFIP
Network Operations and Management Symposium, pages 599–612,
2004.
[7] T. Miyahara, Y. Suzuki, T. Shoudai, T. Uchida, K. Takahashi, and H. Ueda. Discovery of Frequent Tag Tree Patterns in Semistructured Web Documents. Proc. 5th PAKDD, Springer, LNAI 2336, pages
341–355, 2002.