Classification method of cultivated land based on UAV visible light remote
sensing
Weicheng Xu
1,2,
Yubin Lan
1,2*,
Yuanhong Li
1,
Yangfan Luo
1,
Zhenyu He
1(1. College of Engineering, South China Agricultural University, Guangzhou 510642, China; 2. National Center for International Collaboration Research on Precision Agricultural Aviation Pesticide Spraying Technology, Guangzhou 510642, China)
Abstract: The accurate acquisition of the grain crop planting area is a necessary condition for realizing precision agriculture. UAV remote sensing has the advantages of low cost use, simple operation, real-time acquisition of remote sensor images and high ground resolution. It is difficult to separate cultivated land from other terrain by using only a single feature, making it necessary to extract cultivated land by combining various features and hierarchical classification. In this study, the UAV platform was used to collect visible light remote sensing images of farmland to monitor and extract the area information, shape information and position information of farmland. Based on the vegetation index, texture information and shape information in the visible light band, the object-oriented method was used to study the best scheme for extracting cultivated land area. After repeated experiments, it has been determined that the segmentation scale 50 and the consolidation scale 90 are the most suitable segmentation parameters. Uncultivated crops and other features are separated by using the band information and texture information. The overall accuracy of this method is 86.40% and the Kappa coefficient is 0.80. The experimental results show that the UAV visible light remote sensing data can be used to classify and extract cultivated land with high precision. However, there are some cases where the finely divided plots are misleading, so further optimization and improvement are needed.
Keywords: UAV, visible band, remote sensing, extraction of cultivated land area, object oriented method
DOI: 10.25165/j.ijabe.20191203.4754
Citation: Xu W C, Lan Y B, Li Y H, Luo Y F, He Z Y. Classification method of cultivated land based on UAV visible light remote sensing. Int J Agric & Biol Eng, 2019; 12(3): 103–109.
1 Introduction
The determination of the boundary and area of cultivated land is fundamental in the development of precision agriculture[1]. Accurate acquisition of the type and spatial distribution of cultivated land in the region is of great significance for precision agricultural management, optimization of planting space and maximization of input and output ratio of agricultural products[2,3].
As a new kind of technology, UAV remote sensing technology is low cost and highly efficient, high resolution, and flexible with advantages[4]. Visible light remote sensing technology further
reduces the demand for remote sensing images of the band, thus greatly reducing the difficulty of image acquisition which can make up for the shortcomings of existing aerial and ground remote sensing systems. Aviation and ground remote sensing systems work together to improve crop monitoring systems on the ground[5-8], particularly for remote sensing operations in small and medium-sized areas, the advantages of UAV visible remote sensing
Received date: 2018-11-05 Accepted date: 2019-04-21
Biographies: Weicheng Xu, PhD candidate, research interests: agricultural aviation and UAV remote sensing, Email: [email protected]; Yuanhong Li, PhD candidate, research interests:agricultural engineering and machine vision, Email: [email protected]; Yangfan Luo, MS candidate, research interests: agricultural mechanization engineering, Email: luoyangfan@ stu.scau.edu.cn; Zhenyu He, MS candidate, research interests: agricultural mechanization engineering, Email: [email protected].
*Corresponding author: Yubin Lan, PhD, Professor, research interests: agricultural aviation application. National Center for International Collaboration Research on Precision Agricultural Aviation Pesticide Spraying Technology, South China Agricultural University, Guangzhou 510642, China. Tel: +86-20-85281421, Email: [email protected].
image are more prominent and have a wide range of application scenarios[9-12]. Therefore, it is of great practical significance to
study the method to obtain the information of cultivated land area by using UAV visible remote sensing technology.
At present, the main method to extract cultivated land information is to use satellite remote sensing images for calculation. This method has the disadvantages of high activity cost and long cycle, etc. Therefore, it is necessary to study a method to acquire cultivated land area information in real-time, efficient, convenient and low-cost[13]. Some domestic scholars have done relevant research on the extraction of cultivated land area. Li et al.[14] and his team used small electric drones fitted with digital cameras, and extracted the growing area of corn by using red, green and blue mean texture features, with a minimum error of 0.3%. It provides a way of thinking about land classification using UAV visible remote sensing images. By studying the phrenological calendar of cotton and other crops, Li et al.[15] analyzed the spectral characteristics of cotton in the field by selecting multispectral remote sensing images of similar time phases over many years, obtaining the planting area and distribution information of cotton in the experimental area provided a reference for preliminary arable land separation using spectral characteristics. Niu et al.[16] and his
collects data. Current research work uses only three wavelengths in the visible light remote sensing image as the basis of analysis. The use of a UAVs digital camera to collect images, utilization of cultivated land and other features in the remote sensing image, spectral color, and texture characteristics, research to identify the cultivated land area and obtain the method of distribution.
2 Data acquisition and preprocessing
2.1 Study area overview
In this paper, the study area is in the experimental base of South China Agricultural University, which is located in Feng Village, Xintang Town, Zengcheng District, Guangzhou, China (113°38'38.0616"N, 23°14'34.745999"E). The climate of the test area is a Marine subtropical monsoon climate, which is warm and rainy, has plenty of light and heat, with a long summer and short frost period. There are three main types of land, forest and houses in the experimental area.
2.2 Remote sensing image acquisition
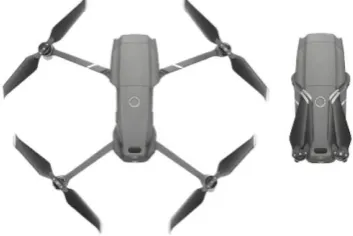
The experimental image acquisition platform adopts Mavic2 Zoom quadrotor UAV (as shown in Figure 1) from Shenzhen DJI Company. It is equipped with a 1/23-inch 12-megapixel CMOS sensor, the lens can achieve an optical zoom of 24-48 mm (equivalent to full frame). The camera is equipped with a tri-axis stabilization cradle head to eliminate the remote sensing image distortion caused by aircraft pitch and increase the image accuracy. No special field for landing and takeoff is required, and it can hover in the air for long periods of time which provides great convenience for obtaining remote sensing images. GPS and six-way visual sensors can make flying safer and more stable.
Figure 1 DJI Mavic2 Zoom aerial photograph
The data used in this article is from October 18, 2018. We used Litchi ground station for route planning, as shown in Figure 2. The remote sensing image height was 400 m, the route length was 4650 m, and the UAV cruising speed was 20 km/h, and 147 RAW images were collected.
Figure 2 Route planning
2.3 The data processing
First, the RAW image was transformed into a JPG image using Lightroom, and the image and its corresponding POS data were imported into PIX4DMAPPER software for the orthophoto
correction and image Mosaic. Finally, the image meets the requirement of 1:10000 flatland plane precision in The Code of Aerial Triangle for Digital Aerial Photogrammetry was obtained[18]. The image contains 10 707×6860 pixels, with a spatial resolution of 4.11 cm and an area of about 187 mu (1 mu = 667 m2). In this paper, the farmland concentration area in the middle of the orthophoto image is selected as the area of interest. The gray-level values of R, G, B, are stored with in a TIF format image. Each color contains 8-bit color information, the numerical range is 0-255, and the color space is sRGB, as shown in Figure 3.
Figure 3 Orthophoto image of the study area
3 Method of extracting cultivated land
This paper uses object-oriented method to extract the information of cultivated land area. Its advantage is that it can make full use of spectral, texture, and shape information of high-resolution images for automatic recognition of ground objects which improves the classification accuracy of objects, and reduces the “salt and pepper” phenomenon of pixel classification effectively.
3.1 Spectral features of different types of cultivated land
It can be found that the types of cultivated land in the region can be divided into three types, as shown in Figure 4. Firstly, the spectral characteristic parameters of different types of cultivated land were statistically analyzed. The most appropriate characteristic parameters were selected to distinguish different types of cultivated land as the basis for extraction.
a. Cultivated land that has been planted
b. Cultivated land without crops
c. Covered farmland
Although the remote sensing image can only have grayscale information of red, green and blue, after color space conversion, the difference between ground object information in the image can be enhanced, which is of great help for ground object classification and area extraction. Therefore, this paper studied the values of various features on different ground objects.
The spectral feature information used in this study is vegetation index based on visible band, mainly including VDVI (visible-band difference vegetation index)[10], ExG (excess green)[19], NGRDI (normalized green-red difference index)[20] and RGRI (red-green ratio index)[21]. The calculation Equation is as follows, where R, G, B, represent the normalization values of red, green, and blue wave segments respectively.
2 2
G R B VDVI
G R B
(1) 2
ExG G R B (2)
G R NGRDI
G R
(3)
R RGRI
G
(4)
The vegetation index can be used as a standard for classification because the cultivated land has a significant difference in green vegetation information compared with other types of cultivated land. In order to select the most appropriate vegetation index as the experimental standard, this paper selected 10 regions for data statistics for three different types of cultivated land, and analyzed the differences between different bands. The selection of sample regions is shown in Figure 5, and the statistical information is shown in Table 1.
Table 1 Table of differences of pixel values of different cultivated land types in red, green, and blue bands
Typical land cover
Pixel value for red band
Pixel value for green band
Pixel value for blue band Mean Standard
deviation Mean
Standard deviation Mean
Standard deviation Has been planted 107.32 18.34 129.30 11.69 91.37 11.07
Without crops 187.00 21.12 161.13 18.39 141.01 16.39 Covered farmland 154.79 63.67 164.68 53.56 182.13 44.16
Figure 5 Distribution of sample collection
According to the data in Table 1, it can be seen that the band reflectivity of cultivated land has the following characteristics: G>R>B. The spectral reflectance characteristic of the uncultivated cultivated land is not R>G>B. However, in a shed or covered field, it is B>G>R, but all bands in this kind of sample have large standard deviation. Data of all kinds of samples have a certain degree of dispersion, especially those with cover or mulch. Therefore, when the data mean difference is not large, there will be a partial intersection, so it is difficult to separate them through a single band.
It is not difficult to see from the Equation of calculating vegetation index that the separated vegetation does not rely on a single band, but the combined operation of multiple bands, which can play the effect of amplifying the difference between vegetation and non-vegetation. Through the research of other scholars on visible vegetation index[24-27], VDVI index, and ExG index were more accurate in the extraction of vegetation information. Therefore, the study selected the above two planted indexes for research calculation and extraction results are shown in Figure 6.
a. ExG b. VDVI
Figure 6 Calculation results of each vegetation index The value range of ExG is [–255, 255], and the value range of VDVI is [–1, 1]. The vegetation index selected in the study was determined by the mean value and standard deviation of the above two planting data in the same sample area, as shown in Table 2.
Table 2 Differences of different cultivated land types under ExG and VDVI
Typical land cover
VDVI ExG
Distribution interval
Standard deviation
Distribution interval
Standard deviation Has been planted [0.008,0.333] 0.0374 [5,116] 13.6735
Without crops [–0.093,0.122] 0.0163 [–40,61] 8.7864 Covered farmland [–0.067,0.143] 0.009 [–37,72] 5.0096
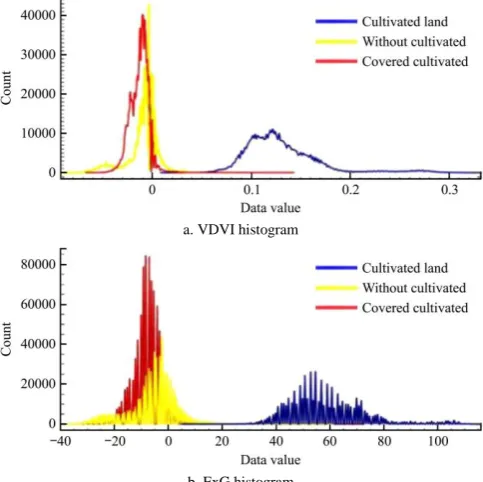
It can be seen that the distributions of the three types of cultivated land are repeated, so it is difficult to separate them solely on the distributions. The histogram can show where the vegetation index values of different types of cultivated land are most concentrated, so as to select the appropriate threshold to separate the ground objects. The gray histogram of VDVI and ExG is shown in Figure 7.
a. VDVI histogram
b. ExG histogram
As can be seen from the histogram, both indexes can make a good distinction between cultivated and other types of land. The optimal separation threshold of VDVI and ExG is 0.4 and 20 respectively by using bimodal method based on histogram. However, the vegetation index can only separate vegetation from non-vegetation, and is difficult to distinguish cultivated land from other vegetation. Therefore, the extraction of cultivated land should rely on other features besides color, such as shape, and texture features. In this study, based on the object-oriented method, a variety of feature combinations were used to extract cultivated land with crops. The process included image segmentation, feature selection, and establishment of rule classification.
3.2 Determination of remote sensing image segmentation parameters
Remote sensing image segmentation is a process of segmenting an image into many non-overlapping parts. The segmentation results conform to the principle of homogeneity
within image blocks and heterogeneity between the image blocks[22] .
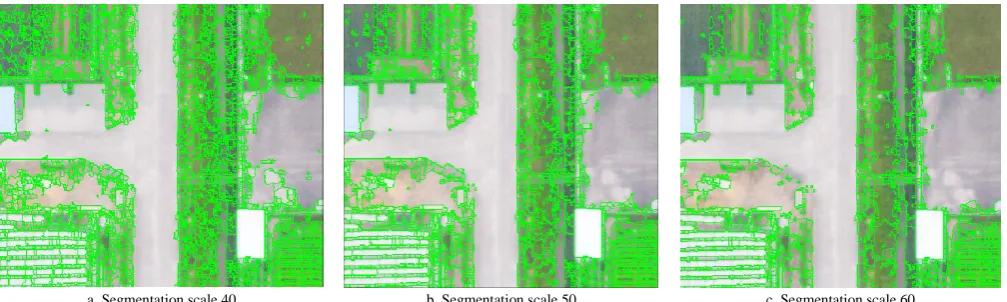
The segmentation scale affects the final result of the graph classification directly. If the scale of segmentation is too small, the number of remote sensing image blocks after segmentation is too large. If the segmentation scale is too large, the remote sensing image segmentation is not complete, resulting in increased extraction errors. According to existing studies, the optimal segmentation scale is the corresponding scale when the internal spectral standard deviation of the graph block reaches the peak value and the change rate of standard deviation begins to decline[23]. In ENVI5.3, the object-oriented feature extraction tool has the function of real-time preview of segmentation results and can select the appropriate threshold for image segmentation through real-time preview. After repeated experiments on different segmentation scales, the segmentation scale is more appropriate around 50, so this paper mainly compares the segmentation effect when the segmentation scale is 40, 50 and 60, as shown in Figure 8.
a. Segmentation scale 40 b. Segmentation scale 50 c. Segmentation scale 60
Figure 8 Different segmentation scale effects
As can be seen from Figure 8, when the segmentation scale is 60, the cement pavement is not well separated from the land, as shown in Figure 8c. There are too many small image spots, which is unbefitting for classification and calculation. Therefore, the segmentation scale selected in this study was 50.
As can be seen from Figure 8b, when the segmentation scale is 50, there are still lots of spots in the same ground object, so it is necessary to solve this problem through the merging algorithm. After previewing and comparative analysis of different merging parameters, we found that the merging scale of 90 can better meet the requirements.
3.3 Feature selection and rule establishment
3.3.1 Selection of characteristics of cultivated crops and establishment of rules
Spectral features are the most intuitive information in the image. For the cultivated land, vegetation index can be used to obtain a better extraction effect. However, there are still some small map spots that are incorrectly divided into arable land. By zooming in, we found that lots of the vegetation, such as weeds and shrubs are located on the roadside. The difference between them and the cultivated land can be used to remove and separate part of the map spots. In addition, some cultivated land fallow for a long time, and there will be some vegetation in its scope, which will affect our extraction process. However, the shape of cultivated land is mostly rectangular, which can be separated by setting a threshold value for rectangularity. After repeated experiments, the area threshold is set to 300 and the rectangle threshold is 0.4, which can be used to extract cultivated land.
3.3.2 Feature selection and rule establishment of unplanted crop farmland
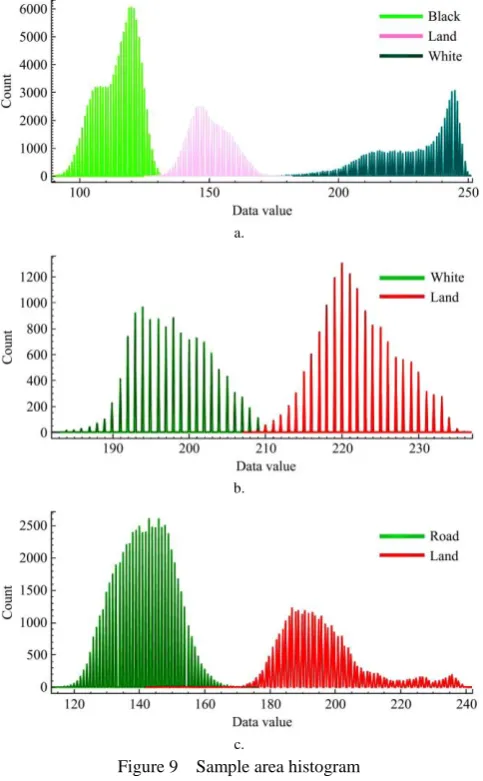
Cultivated land without crops (fallow land) is mostly bare land, but it can’t be separated from roads, buildings and other non-vegetation only through vegetation. Through spectral analysis of the land and road samples, we found that the histogram of the two in the blue light band has obvious bimodal characteristics, as shown in Figure 9a. Therefore, the blue light band can be easily separated by the threshold method, and the threshold value set to 170 according to the bimodal method.
The extraction of fallow land still had the situation that small map spots were misclassified. Some of the speckles can be removed by the same method as that used to separate cultivated crops.
3.3.3 The selection of characteristics and rules for building shelter or mulch cultivated land
As can be seen from the orthophoto image, this kind of cultivated land has two colors: black and white, while the spectrum of black and white is quite different. Therefore, this paper adopts the method of stratified classification to extract the black and white cultivated land. Firstly, as this kind of land is non-vegetation and the rest cultivated land, it needs to be separated. After observing the gray histogram of each band in the selected sample, we found that the blue light band can achieve a good classification effect, as shown in Figure 9b.
threshold to distinguish the black and white ground objects and land. Of these, less than 132 and more than 178 were extracted as sheds or mulched farmland. However, findings from the preview figure show that this rule cannot separate the white ground objects from the road. By observing the histogram, we found that the overlap rate of the two ground objects in the blue band is very high, so other methods should be selected to separate them. After comparing the histogram of other wave bands, we found that there were significant differences between the two ground objects in the red light band, as shown in Figure 9c. The corresponding band value of pixel intersection is 210, so it was selected as the threshold to separate the road and the white shed cultivated land.
a.
b.
c.
Figure 9 Sample area histogram
And for the white mulch farmland, compared with the road, its brightness is higher, closer to white, it is difficult to distinguish by spectral information. However, the laminated cultivated land has obvious texture features, which can be extracted by texture information. Texture core’s average data Range (Texture Range) has a good extraction effect on mulch farmland. After repeated experiments, when the threshold is 11, the mulch field can be separated from the road.
4 Extraction results and error analysis
4.1 Calculation of extraction accuracy
The three types of cultivated land extracted based on the above rules are shown in Figure 10, in which the red represents the cultivated land, the yellow represents the fallow land, and the blue represents the covered land.
Figure 10 Classification results
In this study, the accuracy evaluation was carried out by using the obfuscation matrix, which is a visualization display tool to evaluate the quality of classification model. A series of evaluation indexes can be used to evaluate the classification extraction results. Samples are selected for verification through visual sampling. Sampling of samples follows the principle of randomness to ensure that the probability (i.e. probability) of each individual sample being selected is completely equal. A total of 500 pixels were selected as samples in the image to construct the confusion matrix.
The confusion matrix in Table 3 shows that the overall accuracy is 86.40%. According to Equation (5), Kappa coefficient is 0.80, where po represents the overall accuracy and pc
represents the contingency and consistent pixel proportion, the numerical value can be calculated by Equations (6) and (7).
1 o c
c
p p k
p
(5)
0 a11 a22 a33... ann
p
N
(6)
1 1 2 2 3 3...
e a b a b a b a bn n
p
N N
(7) where, n is the order of the confusion matrix in the equation; N is the total number of samples and the value is 500; an (bn) is the sum of all the values in column (line) n. Observations from the results show that the classification extraction method in this study is highly consistent with the actual results.
Table 3 Accuracy evaluation based on confusion matrix
Category Has been planted
Without crops
Covered farmland
Other objects
Total sample size
User accuracy
Has been planted 232 8 0 2 242 95.87%
Without crops 6 64 3 13 86 74.42%
Covered farmland 1 8 71 10 90 78.88%
Other objects 12 4 1 65 82 79.27%
Total sample size 251 84 75 90 Producer’s accuracy 92.43% 76.19% 94.67% 72.20%
4.2 Error analysis
In a high-resolution image, the number of broken small ground classes is greatly increased compared with the satellite remote sensing image, which has a certain impact on the classification accuracy. As can be seen from the confusion matrix, the extraction accuracy of this method is significantly lower than that of the remaining two types of ground objects, both of which are less than 80%, resulting in the lowest classification accuracy of other ground targets.
mistaken for fallow land, road smoothness leads to increased brightness in the image, and it is difficult to separate from white film, even through setting thresholds for area and rectangularity, it cannot be completely removed. The planting structure and growth of some crops will lead to obvious bare soil between the rows, and some small mulch residues remain in the field after harvest, as shown in Figure 11. These can lead to the misallocation of cultivated land under high-resolution images.
In the classification and extraction of cultivated land based on visible and high-resolution remote sensing data, there are a lot of mounds have been misextracted or omitted. In the next step of the research work, more samples can be taken as training objects and combined with the rule-based object-oriented classification method and the sample-based object-oriented classification method to improve the accuracy and integrity of farmland classification.
a. Dirt covered road b. Residual plastic film c. Bare soil Figure 11 Easily misclassified objects
4.3 Verification test
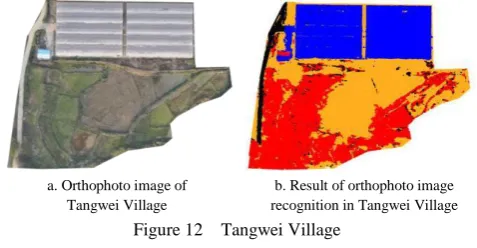
In order to verify the universality of the test results, the same data acquisition method was used to collect a set of remote sensing data in Tangwei Village, Huizhou City, Guangdong Province (114°31'12.1903"N, 23°31'0.550"E), as shown in Figure 12a.
The proposed method is used to process remote sensing data and the same accuracy evaluation criteria are used to process the data. The classification results are shown in Figure 12b. The overall accuracy is 82.48%, which is close to the experimental results. Through observation and classification, we found that the main reason for the decrease in accuracy is that the crop boundary is more complex and covered by vegetation. Therefore, the inability to segment land blocks well leads to a certain decrease in accuracy.
a. Orthophoto image of Tangwei Village
b. Result of orthophoto image recognition in Tangwei Village Figure 12 Tangwei Village
5 Conclusions
The visible light remote sensing image of UAV has great potential in the field of agricultural situation monitoring and intelligent agriculture. Compared with traditional satellite remote sensing methods, visible remote sensing data lack some spectral information of specific bands, such as near infrared band. However, UAV remote sensing has higher spatial resolution, more flexible acquisition methods and high timeliness, which can be used as an effective supplementary means of cultivated land survey methods. Moreover, the small electric UAV has no special requirements for the takeoff and landing sites, and has a certain adjustment ability for flight conditions. It is suitable for all kinds
of non-runway areas. Therefore, the cost and difficulty of collecting remote sensing images in the region are greatly reduced, and it can provide real-time images for agricultural situation analysis.
In this study, high resolution visible light remote sensing images were obtained by using an aerial camera and spliced to generate orthophoto images. Object oriented method was adopted to comprehensively consider spectral features, texture features and shape features to classify and extract cultivated land. The results show that this method can make full use of the characteristics of high resolution visible remote sensing data, effectively identify and classify cultivated land types in agricultural plots, and has high accuracy. The conclusions are as follows:
(1) Both VDVI and ExG index can be used to distinguish between vegetation and non-vegetation well. In this study, ExG index is adopted. When the threshold value is set at 20, vegetation and other ground objects can be well separated, and non-agricultural vegetation such as cultivated crops, weeds, and green belts cannot be distinguished. When the area threshold is set to be 300 and the rectangle threshold is 0.4, the non-crop vegetation can be effectively separated.
(2) The threshold value of the blue light band is set at 170 to separate the cultivated land and road of uncultivated crops, because there is a significant difference in the blue light band between the cultivated land and the road. The same area threshold and rectangle threshold are used to separate the fine speckle.
(3) For the cultivated land with white mulch, its brightness is higher and it is closer to white than that with the shelter. It is difficult to distinguish it by spectral information. Therefore, it can be separated by texture feature.
(4) Through the precision evaluation of the confusion matrix, the method adopted in this study can accurately separate and extract various types of cultivated land, and the overall accuracy is 86.40% and Kappa coefficient is 0.80. The results show that this method is feasible and has high accuracy in the extraction of classified information of UAVs.
The combination of UAV remote sensing and object oriented method provides a new method for the classification and extraction of cultivated land, and a certain reference for the monitoring of crop planting information and field farmland distribution information.
Acknowledgements
We acknowledge that this research work was financially supported by the Leading Talents of Guangdong Province Program (Project No.2016LJ06G689), Educational Commission of Guangdong Province of China for Platform (Project No.2015KGJHZ007), Science and Technology Planning Project of Guangdong Province (Project No.2017B010117010) and China Agriculture Research System (Project No. CARS-15-22). We also thank the anonymous reviewers for their critical comments and suggestions to improve the manuscript.
[References]
[1] Guo P, Wu F D, Dai J G, Wang H J, Xu L P, Zhang G S. Comparison of farmland crop classification methods based on visible light images of unmanned aerial vehicles. Transactions of the CSAE, 2017; 33(13): 112–119. (in Chinese)
[3] Lv T, Liu C. Study on extraction of crop information using time-series MODIS data in Chao Phraya Basin of Thailand. Advances in Space Research, 2010; 45(6): 775–784.
[4] Wang P, Luo X W, Zhou Z Y, Zang Y, Hu L. Key technologies of remote sensing information acquisition based on micro-mini UAV. Transactions of the CSAE, 2014; 30(18): 1–12. (in Chinese)
[5] Bryson M, Reid A, Ramos F, Sukkarieh S. Airborne vision-based mapping and classification of large farmland environments. Journal of Field Robotics, 2010; 27(5): 632–655.
[6] Torres-Sanchez J, Pena J M, de Castro A I, López-Granados F. Multi-temporal mapping of the vegetation fraction in early-season wheat fields using images from UAV. Computer and Electronics in Agriculture, 2014; 103(2): 104–113.
[7] Gomez-Candon D, De Castro A I, Lopez-Granados F. Assessing the accuracy of mosaics from unmanned aerial vehicle (UAV) imagery for precision agriculture purposes in wheat. Precision Agriculture, 2014; 15(1): 44–56.
[8] Mesas-Carrascosa F J, Notario-García M D, Meroño J E, de la Orden M S, García-Ferrer A. Validation of measurements of land plot area using UAV imagery. International Journal of Applied Earth Observation and Geoinformation, 2014; 33(1): 270–279.
[9] Wang X Q, Wang M M, Wang S Q, Wu Y D. Extraction of vegetation information based on remote sensing of UAVs in visible band. Transactions of the CSAE, 2015; 31(5): 152–159. (in Chinese)
[10] Liu F, Liu S H, Xiang Y. Study on remote sensing monitoring of vegetation coverage in the field. Transactions of the CSAM, 2014; 45(11): 250–257. (in Chinese)
[11] Dong M, Su J D, Liu G Y, Yang J T, Chen X Z, Tian L, et al. Object oriented remote sensing image of tobacco planting area extraction and monitoring. Science of Surveying and Mapping, 2014; 39(9): 87–90. (in Chinese)
[12] Wu W, Qin Q M, Fan Y D. Information extraction of disaster relief tents based on UAV visible remote sensing image. Geography and Geographic Information Science, 2015; 31(2): 20–23. (in Chinese)
[13] Han W T, Zhang L Y, Zhang H X, Shi Z Q, Yuan M C, Wang Z J. Information extraction of field canal system distribution based on UAV remote sensing and object oriented method. Transactions of the CSAM, 2017; 48(3): 206–214. (in Chinese)
[14] Li Z N, Chen Z X, Wang L M, Liu J, Zhou Q B. Extraction of lodging area of corn based on remote sensing of small UAV. Transactions of the CSAE, 2014; 30(19): 207–213.
[15] Li M, Research on information extraction and subdivision management of county cotton based on RS and GIS - A case study of Xiajin County, Shandong Province. Master's thesis, Tai’an: Shandong Agricultural University, 2012. (in Chinese)
[16] Niu Y X, Zhang L Y, Han W T, Shao G M. Fractional vegetation cover extraction method of winter wheat based on UAV remote sensing and vegetation index. Transactions of the CSAM, 2018; 49(4): 213–221. (in Chinese)
[17] Mesas-Carrascosa F J, Rumbao I C, Torres-Sanchez J, Garcia-Ferrer A, Pena J M, Granados F L. Accurate ortho-mosaicked six-band multispectral UAV images as affected by mission planning for precision agriculture proposes. International Journal of Remote Sensing, 2017; 38: 8–10.
[18] Han W T, Li G, Wan M C, Zhang L Y, Shi Z Q. Study on information extraction method of maize planting based on UAV remote sensing technology. Transactions of the CSAM, 2017; 48(1): 140–147. (in Chinese)
[19] Torres-Sanchez J, Pena J M, de Castro A I, López-Granados F. Multi-temporal mapping of the vegetation fraction in early-season wheat fields using images from UAV. Computers and Electronics in Agriculture, 2014: 103: 104–113.
[20] Meyer G E, Camargo N J. Verification of color vegetation indices for automated crop image application. Computers and Electronics in Agriculture, 2008; 63: 282–293.
[21] Verrelst J, Schaepman M E, Koetz B, Kneubühler M. Angular sensitivity analysis of vegetation indices derived from CHRIS/PROBA data. Remote Sensing of Environment, 2018; 112(5): 2341 – 2353.
[22] Wu J S, Liu H L, Zhang J S. Object oriented classification method of UAV remote sensing image was used to estimate the rice area in the city. Transactions of the CSAE, 2011; 34(1): 70–77. (in Chinese)
[23] Li Q, Gao X Z, Zhang T, Liu K, Gong J M. Experimental analysis of multilevel remote sensing ground object classification under optimal segmentation scale. Journal of Earth Information Science, 2011; 12(3): 409–417. (in Chinese)
[24] Mesas-Carrascosa F J, Notario-García M D, Meroño J E, de la Orden M S, García-Ferrer A. Validation of measurements of land plot area using UAV imagery. International Journal of Applied Earth Observation and Geoinformation, 2014; 33(1): 270–279.
[25] Du M M, Noguchi Noboru. Monitoring of Wheat Growth Status and Mapping of Wheat Yield's within-Field Spatial Variations Using Color Images Acquired from UAV-camera System. Remote sensing, 2017; 9(3): 1–14.
[26] Meyer George E, Neto Joao Camargo. Verification of color vegetation indices for automated crop imaging applications. Computer and Electronics in Agriculture, 2008; 63(2): 282–293.