PREPARATIVE HPLC SEPARATION OF SUGARS EXTRACTED FROM NON- EDIBLE PORTION OF
RIDGE GOURD (LUFFA ACUTANGULA) AND THEIR IDENTIFICATION BY MASS AND TLC
ANALYSIS
Research Article
R. MYTHILY, C. S. CHIDAN KUMAR
$Department of Studies in Sugar Technology, Sir M. Vishweshwaraya Post-graduate Centre, University of Mysore, Tubinakere, Mandya 571402, Karnataka, India.
AND S. CHANDRAJU*
$
Received: 13 Oct 2011, Revised and Accepted: 17 Nov 2011
Department of Chemistry, G. Madegowda Institute of Technology, Bharathi Nagar 571422, India. Email:[email protected]
ABSTRACT
A rapid, sensitive extraction method was developed using the mixture Methanol-Dichloromethane-Water (MDW) (0.3:4:1v/v/v) and MeOH-H2
Keyword: Sugar extraction; ridge gourd; UV inactive; HPLC; ELSD; Separation; LC/MS; TLC.
O phase was assayed for sugar analysis. Photodiode-array detection (DAD) has been used to prove the extracted compound is UV inactive, High-performance liquid chromatography (HPLC) with Evaporative Light Scattering Detector (ELSD) coupled to electrospray ionization mass spectrometric (ESI-MS) detection in the positive ion mode gave MS and MSn fragmentation data which were employed for their structural characterization. The various standard sugars were spotted using the solvent system n-butanol - acetone - diethylamine - water (10:10:2:6, v/v/v/v) in the cellulose layer for TLC analysis which indicated the presence of lactose, galactose, glucose and xylose. This is the first assay of the sugar profile of the ridge gourd, which can be further developed for characterization and evaluation of their quality with regards to their sugar composition.
INTRODUCTION
The Ridge Gourd is an extremely popular vegetable in the African, Asian and the Arabic countries. It is also known by other names such as loofah, luffa, turai, turiya, tori etc1. It is a dark green, ridged
vegetable having white pulp with white seeds embedded in spongy flesh. All species of ridge gourd/loofah are edible, but they must be consumed before they mature, or else they will be too woody and fibrous to eat. It has many health benefits rich in such as dietary,iron and. It is also low in fat and calories2. The juice prepared from ridge
gourd is a natural remedy for jaundice. Blood purifier because of its blood purifying properties, it helps to purify, restore and nourish liver protecting it from alcohol intoxication3. It contains -like
peptides, alkaloids and charantin, which help to lower blood and urine sugar levels without altering blood insulin levels. Cellulose in ridge gourd helps to overcome constipation and also aids in curing piles4
MATERIALS AND METHODS
. Inspite of all these advantages unlike all vegetables the ridge gourd peels are also thrown as waste. Therefore production of various sugars evaluated from the non edible portion of ridge gourd has considerable promise in the future to achieve economical profit and moreover utilization of the agro-industrial wastes for sugar production will be of immense benefit at preventing the pollutional hazards associated with these wastes.
Extraction
Selected samples are sliced, dried under vacuum at 600C for 48 hr
and powdered. 100.0 g of raw material was extracted with doubly distilled water 75mL, 15mL of 0.1N sulphuric acid and kept under hot plate for about 1 hour at 60°C. Contents are cooled and stirred well with magnetic stirrer for 30’. Neutralized using AR barium hydroxide and precipitated barium sulphate is filtered off. The resulting syrup was stored at 4°C in the dark. The syrup was treated
with charcoal (coir pith) and agitated for 30’ followed by Silica gel (230-400 mesh) packed in a sintered glass crucible for about 2cm thickness connected to suction pump, where rota vapour removed the solvent of the filtrate. The residue was placed in an air tight glass container covered with 200 ml of boiling 80% ethanol. After simmering for several hours in a steam bath, the container was sealed and stored at room temperature. For the analysis, sample was homogenized in a blender for 3-5’at high speed and then filtered through a Buchner funnel using a vacuum source replicated extraction with 80% EtOH (2 x 50mL) each time and the whole
syrup was concentrated. Methanol - Dichloromethane - water (0.3:4:1, v/v/v), Sample tubes fed with the mixture were loosely capped, placed in a water bath for 5S, and left at room temperature for 10’and placed in separating funnel, agitated vigorously by occasional release of pressure, results two phases. The organic phase was discarded which removes the organic impurities and the methanol: water phase was assayed for sugar. The residues were oven-dried at 50°C overnight to remove the residual solvent, and stored in refrigerator for analysis5- 9
Instrumentation
.
The mixture was separated in 26’by reversed phase HPLC on an
Adsorbosphere column-NH2, (250 x 4.6 mm column) using both
isocratic and gradient elution with acetonitrile/water and detected using Waters ELSD 2420. In ELSD, the mobile phase is first evaporated. Solid particles remaining from the sample are then carried in the form of a mist into a cell where they are detected by a laser. The separated fractions were subjected to UV analysis using Agilent 8453 coupled with Diode array detector. HPLC–MS analysis was performed with LCMSD/ Trap System (Agilent Technologies, 1200 Series) equipped with an electrospray interface. The MS spectra were acquired in positive ion mode. The mobile phase consisted of 0.10% formic acid in hplc grade deionized water (A) (milli-q-water (subjected to IR radiation under 3.5 micron filters) and Methanol (B) taken in the stationary phase of Atlantis dc 18 column (50 x 4.6mm - 5µm). The gradient program was as follows: 10% B to 95% B in 4 min, 95% B to 95% B in 1 min, 95% B to 10% B in 0.5 min followed by 10% B in 1.5 min at a flow rate of 1.2 mL min-1
Preparation of chromatoplates
. The column oven temperature was kept at 40°C and the injection volume was 2.0 µL. Product mass spectra were recorded in the range of m/z 150-1000. The instrumental parameters were optimized before the run.
Thin layer chromatography was performed for the concentrated separated fraction using Cellulose MN 300 G. The fractions obtained were subjected to one dimensional chromatogram on a cellulose layer plate. Each plate was activated at 110°C prior to use for 10’.
Standard samples
Pure samples D (-) Arabinose, D (-) Ribose, D (+) Xylose, D (+) Galactose, D(+) Glucose, D (+) Mannose, L (-) Sorbose, D (-) Fructose, L (+) Rhamnose, D (+) Sucrose and D (+) Maltose, D (+) Lactose were used as standard.
One – dimensional chromatography
10 mg of each sugar and the separated fractions were dissolved in 1ml of deionised water. 1µL of each sugar solution was applied to the chromatoplate with the micropipette in the usual manner. The chromatoplate was placed in the chamber containing the developing solvent. The solvent system used was n-butanol - acetone - diethylamine - water (10:10:2:6 v/v/v/v). The plates were developed in an almost vertical position at room temperature, covered with lid10-14. After the elution, plate was dried under warm
air. The plate was sprayed with 5% diphenylamine in ethanol, 4% aniline in ethanol and 85% phosphoric acid (5:5:1v/v/v). The plate was heated for 10’at 105°C. While drying coloured spots appear. The Rf
RESULTS AND DISCUSSION
values relative to the solvent are reported below.
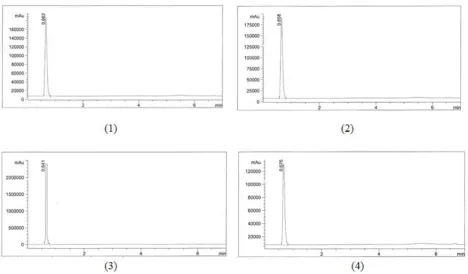
Analysis report showed that the extracted separated components are UV inactive shown in Fig. 1, and their respective retention time falls as follows 0.662, 0.658, 0.641, and 0.675 shown in Fig. 2.
Fig. 1: UV inactive spectrum of the Separated Fractions
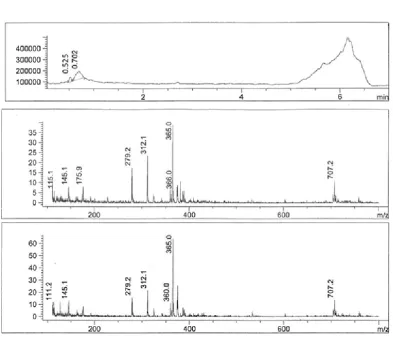
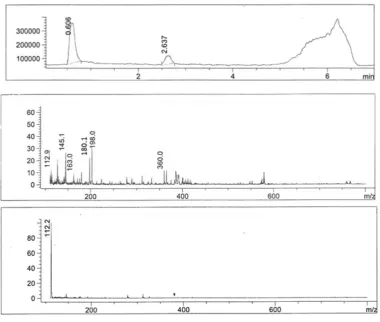
The Mass Spectrum detector gave the following spectrum of fraction1 at 0.578 min, fraction2 at 0.525 and 0.702min, fraction3 at 0.606 and 2.637min, fraction4 at 0.595 and 2.576min. The MS report recorded at the appropriate time as per MSD for Fraction1 scanned between the time period 0.493:0.772 gave m/z values 112.9, 145.1, 163.0, 164.1, 180.1, 202.9. Fraction2 scanned between the time periods 0.480: 0.546 min gave m/z values 115.1, 145.1, 175.9, 279.2, 312.1, 366.0, 365.0,
707.2 and 0.573: 0.812 mingave m/z values 111.2, 145.1, 279.2,
312.1, 360.0, 365.0, 707.2. Fraction3 scanned between the time
period 0.507: 0.798 minand 2.495: 2.760min gave m/z values
112.9, 145.1, 163.0, 180.1, 198.0, 360.0 and 112.1. Fraction4
scanned between the time period 0.520 : 0.745 and 2.508 : 2.667 gave m/z values 111.2, 145.1, 150.1, 272.9, 305.1, 326.1, 327.1, 331.0 and 112.2, 145.1, 278.9, 312.1 respectively which gives a conclusion that these masses corresponds to Hexose, pentose and disaccharides whose masses are 180.1, 150.1 and 360.0 respectively depicted in Fig. 3-6.
Fig. 3: Mass report of Separated Fraction 1
Fig. 5: Mass report of Separated Fraction 3
Thin layer chromatographic analysis report
Four separated and purified sample fractions are spotted in the cellulose layer and the eluted species were mentioned as F 1, F 2, F 3, F 4 in the chromatogram shown in Fig. 7.
The fractions obtained were found to be matching with the standard sugars identified as Lactose, galactose, glucose and xylose. Rf value
for the analytical grade samples which also shows the matching fractions Table 1.
Fig. 7:Developed thin layer chromatogram over a cellulose layer, (La – Lactose, So – Sorbose, Ar- Arabinose, Rh – Rhamnose, Ri – Ribose, Xy-Xylose, Gal – Galactose, Gl - Glucose, Man – Mannose, Fr - Fructose, Su – Sucrose and Mal –Maltose).
Table 1: Rf Sugars
values matching of the analytical standard samples and the separated samples
Rf ( Scale of Rf =1) Fraction matching
Lactose 0.18 F1
Maltose 0.24 -
Sucrose 0.35 -
Galactose 0.36 F2
Glucose 0.41 F3
Mannose 0.47 -
Sorbose 0.46 -
Fructose 0.46 -
Arabinose 0.46 -
Xylose 0.53 F4
Ribose 0.63 -
Rhamnose 0.70 -
CONCLUSION
The quantity of the discarded portion is very high; therefore, because of disposal problems the household solid wastes are of greater importance. A fruitful and economic industrial application was applied in this current work. Based on the above studies, a rapid method for the extraction of water soluble sugar has been developed. The mixture MDW gives better results as compared with
MCW, i.e dichloromethane was replaced instead of chloroform15
1. Ho Pham-Hoang. An Illustrated Flora of Vietnam. 1991; 1(2): 718 - 727.
. HPLC has proven to be more selective than conventional wet methods; Mass and TLC analysis gives accurate confirmation for the presence of lactose, galactose, glucose and xylose.
REFERENCES
2. Jansen GJ, Gildemacher BH , Phuphathanaphong L, Luffa P, Miller. Plant Resources of South-East Asia, Vegetables 1993; 194 - 197.
3. Xie Zongwa, Yu Youqin, (Editors). Materia Medica, Chinese
Terminology 1996; 1.
4. Bois D. Encyclopédie Biologique, Les Plantes Alimentaires,
Ed.Paul Lechevalier. 1927;
5. Chandraju S, Mythily R, Chidan Kumar CS. J Chem Pharm Res
2011; 3(3): 312-321.
6. Chandraju S, Mythily R, Chidan Kumar CS. J Chem Pharm Res
2011; 3(4): 422-429.
7. Chandraju S, Mythily R, Chidan Kumar CS. Int J Cur Sci Res 2011; 1: 125-128.
8. Chandraju S, Mythily R, Chidan Kumar CS. Asian. J. Chem, 2012, 24(5),2170-2172.
9. Chandraju S, Mythily R, Chidan Kumar CS. Recent Research in
Science and Technology 2011; 3: 58-62.
10. Sharaf A, Ola, Sharaf A, Hegazi SM, Sedky K. Chemical and
biological studies on banana fruit, Cairo University 1979; 18: 8-15.
11. Baldwin E, Bell DJ. Cole's Practical Physiological Chemistry 1955; 189.
12. Schweiger A. Journal of Chromatography 1962; 9: 374.
13. Vomhot DW, Tucher TC. Journal of Chromatography 1963;
17:300.
14. Lato M, Brunelli B Ciuffins G. Journal of Chromatography 1968; 34:26.
15. Pak S, Chow, Simon M, Landhäusser. Tree Physiology 2004;