Research Journal
Volume 12, No. 3, September 2018, pages 173–180
DOI: 10.12913/22998624/94961 Research Article
OPTIMIZATION OF MANIPULATION LOGISTICS USING DATA MATRIX
CODES
Elena Pivarčiová1, Ladislav Karrach1, Zuzana Tučková2
1 Technical University in Zvolen, Masarykova 24, 960 53 Zvolen, Slovakia, e-mail: [email protected], karrach@
zoznam.sk
2 Tomas Bata University in Zlín, Department of Logistics, Faculty of Logistics and Crisis Management, Studentské
nám. 1532, 686 01 Uherské Hradiště, Czech Republic, e-mail: [email protected]
ABSTRACT
In the paper we deal with optimization of manipulation logistics using Data Matrix codes. Our goal is scanning and decoding Data Matrix codes in real-time. We have
designed and verified an efficient computer aided method for location of the Data
Matrix codes. This method is also suited to real-time processing and has been
veri-fied on a test set of images taken from real industrial world. We have proposed a modified, computationally efficient local thresholding technique that uses local mean
and variation under the sliding window. The proposed Data Matrix code localization algorithm utilizes the connecting of the adjoining points into the continuous regions
and determining of the boundaries of the outer region and it works in two basic steps: localization of the Finder Pattern and verification of the Timing Pattern. Part of the al -gorithm deals also with the decoding of the Data Matrix code using external libraries.
Data Matrix codes can be used to mark logistic units, parts, warehousing positions, but also for automated robot navigation. Because of their low cost, accuracy, speed, reli
-ability, flexibility and efficiency, as well as the ability to write large amounts of data on a small area, they still have a great advantage in logistics.
Keywords: Data Matrix, logistics, localization, Finder Pattern, Timing Pattern.
INTRODUCTION
Goods identification has always played an im -portant role in trading. Already in the Middle Ages it was necessary to distinguish our own goods from the goods of competitors. When the industrial revolu-tion began and when the batch producrevolu-tion was intro-duced, it was necessary to mark and control a large quantity of goods coming in and out of the factory, so the process of identification had to be accelerated and automated.
In 1932, the first idea of automatic identification of goods was proposed by students of the University of Harvard, USA using punch cards for the automat -ic despatching of the goods. At present, each product must have its own labelling necessary for production
or trade. The arrival of information technology has brought unlimited possibilities for identification. The two-dimensional codes began to be used in the late 1990s in Japan, expanded into the world and became one of the most widespread forms of automatic iden-tification. At present, code systems are used without which large-scale trade and the developed industry would not be possible. Using codes allows automa -tion and thus more efficient results.
The use of two-dimensional codes is one of the most accurate and fastest ways to load a large amount of data. Two-dimensional code technology is all-purpose, reliable and easy to use. Codes can be used in different environments. They can be printed or laser marked on materials resistant to high tem -peratures, frost, acids, excess moisture, and etc.
Several authors have dealt with code issues. The process of Data Matrix location is based on edge detection, on the connection of the edge points with similar gradient and on searching for the perpendicular regions. This principle is also used by [1], which uses the algorithm to detect linear regions [2, 3]. In addition to this approach, other works have been published in the past, such which use Radon transform [4] or Hough trans -form [5]. Edge detectors in image processing and object classification were also used in work [6]. Waters [7] deals with QR codes and their practi -cal use mainly in business and marketing. Price [8] describes codes in connection with informa -tion transfer, communica-tion, and their use in education. Karrach and Pivarčiová [9, 10] present and compare several methods for locating Data Matrix codes. Lin [11] undertook to look to the mathematical problem of decoding the 2D bar-code. Gaur and Tiwari [12] recognize 2D barcode using edge detection and morphological opera-tions. Li [13] proposed a method of fast code de -tection. Hansen and Nasrollahi [14] suggested to detect barcodes in real time using method Deep Learning. Szymczyk [15] used RFID sensors and QR and AR markers for navigation in large-for -mat buildings.
An important part of logistics is the process of material handling, which are the operations relat -ed to the transport of materials. Transport routes represent a sensitive part of producing and dis-tributing flow, with the potential for traffic and in -formation chaos. This is associated with unpleas-ant situations where not only distortion or delay can occur, but also information itself can be lost on transported products. This is why the means are being sought to ensure the reliable tracking the objects in the course of logistics and distribu-tion operadistribu-tions. One of the possible soludistribu-tions for increasing the reliability of information in trans -port processes is using barcodes which turned out to be successful solution.
The amount of data in the process of handling products and materials during their transporta-tion in the manufacturing or distributransporta-tion process may vary. Their number can range from ten to thousands of various data. The one-dimensional graphic barcodes (1D codes) are often insufficient to hold the necessary amount of data needed to identify the material being handled. Therefore, they are gradually replaced by two-dimensional graphic codes (2D codes) that allow one barcode to hold much more information than a 1D code.
In the paper we deal with optimization of manipulation logistics using Data Matrix codes. We designed our own algorithm using modified adaptive thresholding algorithm, algorithm of connecting the neighbouring point into continu-ous areas, and locating Data Matrix codes in two basic steps: Finder Pattern localization and Tim -ing Pattern verification, and of course, the data matrix code decoding is part of the algorithm.
The proposed method has been tested on 60 Data Matrix images laser marked in metal tools and scanned by Logitech C920, Lindner V6 and Raspberry Pi Camera V2.
DATA MATRIX
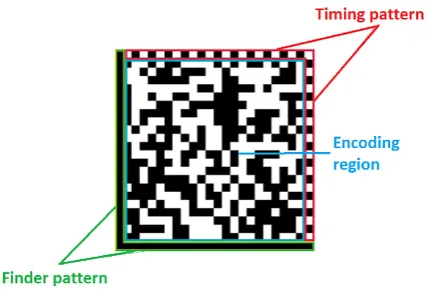
Data Matrix (DMX) is a two-dimensional ma-trix barcode of square or rectangular shape made up of black and white square cells that represent individual bits, one cell is called a module. This DMX code can effectively encode alphanumeric data (i.e. data consisting of digits and letters) as well as raw binary data. One single code can con -tain the product’s serial number, the number of packages in the package, the date of manufacture, the date of consumption, etc.
Data Matrix was created by RVSI Acuity CiMatrix, acquired in 2005 by Siemens AG and in 2008 by Microscan Systems. It is standard -ized according to ISO / IEC16022, International Symbol Specifications, and is public domain, it means, that it can be used by anyone without li -censes and fees.
The Data Matrix was designed to store a large amount of data on a small area. On the left and down, the two solid adjacent edges are filled with the black modules (Finder Pattern), on the oppo -site sides, is alternating the even number of black and white modules (Timing Pattern). The data
itself is encoded inside. Unlike other 2D codes, DMX does not use the centre pattern for location of the code. To determine the location and orien-tation of DMX code the Finder Pattern (an “L” border that has a width of one module) is used. The Timing Pattern is to determine the number of rows and columns. The Data Matrix code sample is shown in Figure 1.
Data Matrix can have up to 30 sizes from 10×10 to 144×144 modules, with a theoretical information density of up to 108 characters per square centimetre. An advantage is the ability to read Data Matrix code even in case of a large code damage up to about 30 %, which is advantageous not only in case of code damage but also when the code is partly covered or if it is glistening.
We can divide the Data Matrix into two sub-groups: older from ECC-000 to ECC-140 that could be repaired by convolution and more re -cent ECC-200s using the Reed-Solomon error correction code.
Data Matrix offers reliability of reading, high -er process speeds and quality, so it is often used in logistics and industrial production. It can be used to mark logistic units, parts, warehouse positions, but also to navigate automated robots and increase the reliability of the robot control [16÷20].
LOGISTICS AND CONVEYORS
Logistics is a discipline that deals with the op-timization, coordination and synchronizatifigon of all the activities necessary to ensure a flexible and economical production process at optimal cost.
Modern logistics centres are not only focused on constantly expanding the storage capacity of their warehouses, but also on the efficiency and the process of operation throughout storage of in-dividual items in a warehouse. At present, each enterprise tries to optimize logistics processes, material flows and stock [21].
Material handling is an important component of logistics. In handling, this is a summary of op -erations consisting of loading, transport, tranship -ment and landing. Other activities concern stor-age, weighing, packing, sorting, measurement and handling of waste.
Handling material as well as transport deter-mines how quickly a product moves from one place to another. In the modern logistic centres you can find automatic, manual and also intelli -gent conveyor belts and hook conveyors. In larger warehouses, their use is necessary to accelerate
the entire process of loading and unloading or transporting pallets between shelves.
The conveyors provide economic transpor -tation of material and the movement of objects. These are transport equipment serving for the smooth transport of material at shorter distances. They are an assistant in all branches of produc -tion, assembly and assembly lines. They are used in the implementation of logistics projects of packing lines, incoming and outgoing warehouse zones. The choice of handling equipment has a significant impact on business productivity and profitability [22÷25].
The primary goal of Data Matrix implementa -tion in logistics is to save time, speed of data in -put and reduce error rate comparing to the manual input. They are used for tracking and identifying goods, collecting data on processing times, data collection in the production cycle and identifica -tion of goods on conveyors.
USING DATA MATRIX IN LOGISTICS
In the paper, we focused on optimizing logis -tics using Data Matrix codes. The processes of packing and storing can be optimised by marking the products with Data Matrix codes. The main ef-fort is to scan and decode the Data Matrix code in real time. At present, relatively expensive scanners are used, e.g. Zebra, so we designed the cheap -est Logitech C920, Lindner Microscope V6 and Raspberry Pi Camera V2 cameras and designed our own algorithm to locate the Data Matrix code in the images. Data Matrix code samples marked with laser on metal tools are shown in Figure 3.
ALGORITHM PROPOSAL
The proposed algorithm uses modified adap -tive thresholding technique, algorithm for connec -tion of adjoining points into continuous areas, and Data Matrix localization in two basic steps: Finder Pattern localization and Timing Pattern verifica
-Fig. 2. Conveyor with entities marked with Data
tion. The algorithm also includes decoding of the Data Matrix code using external libraries.
Algorithm
1. Conversion of the original image to gray-scale image.
2. Conversion of gray image to binary image by adaptive thresholding (Eq. 1), alternatively it -erative global thresholding.
3. Application of 2-pass connected-component la-belling algorithm.
3. A) We have to filter out the regions which do not meet conditions (the area is too small, area is <80 or those where the aspect ratio is not in the range (0.5; 2)).
4. Location of the Data Matrix in two basic steps: 4. A Localization Finder pattern - Find two per -pendicular line segments of the same length. 4. A) I. Identification of 8 boundary points for
each region from step 3 (Figure 4, Figure 5). 4. A) II. Verify if it is possible to select from these
8 boundary points 3 points which are vertices of the isosceles right-angled triangle?
4. A) III. If yes, then for each leg of a such right-angled triangle we will make the location re -finement (Figure 6):
4. A) III. a) First, we shift such leg of a right-angled triangle from its original position in the direction of its normal away from the region. 4. A) III. b) Gradually and alternately , we move
its ends until we reach the contact to the region. 4. A) III. c) Then we approach the end where
there is a smaller overlay of the leg of the right triangle with the region.
4. A) III. d) We stop the approaching when the overlay is > 90%.
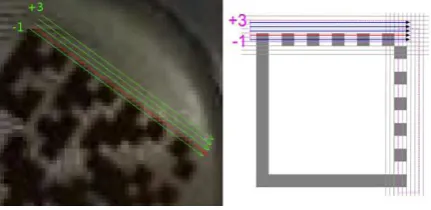
4. B) Verification of the Timing Pattern ,through
the test, if the opposite sides of the Finder Pat -tern have the same number of transitions be-tween black and white.
4. B) I. We are searching the more accurate position of the Timing Pattern in the vicinity of the initial estimate by examining several adjacent posi -tions and looking for the optimum (Figure 7). 5. Decoding the Data Matrix Code.
5. A) Transfer pixels to a binary matrix using bi -linear interpolation.
5. B) Decoding the Data Matrix Code (using an external library).
5. C) In case of failure – micro shifts and rotations and repeat of point 5B.
We have proposed and tested also a modified local thresholding technique, which combines the local point intensity, the mean and the variance under sliding window and calculates the local threshold as follows:
Fig. 4. Sample of an outer boundary of a continuous
(1)
where: m(x, y) – local mean, s2(x, y) – local stan
-dard deviation of the pixel intensities inside the local window, k1 – constant, which controls penalisation of bright points, k2 – constant, which controls de -creasing of local threshold for points in which neighbourhood intensity signifi -cantly varies.
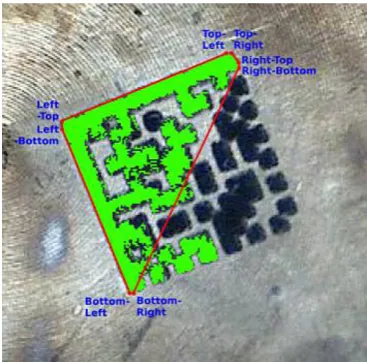
For Finder Pattern location (finding of two mutually perpendicular line segments of the same length) we adopted the identification of 8 bound -ary points. In Figure 4 you can see an example of the marked continuous region (in green colour), which is enclosed by red octagon defined by 8 boundary points. There are at least 3 such bound -ary points which make up vertices of a right-an -gled isosceles triangle.
We take 8 edge points and make up two boundary squares, which are defined by the fol -lowing points:
• Top-Left (TL), Right-Top (RT), Bottom-Right
(BR) a Left-Bottom (LB);
• Top-Right (TR), Right-Bottom (RB), Bottom-Left (BL) a Bottom-Left-Top (LT).
From those squares, we select that one, whose perimeter is bigger one (i.e. it represents outer boundary of a continuous region). This way we get 4 border points, which we name P1, P2, P3, P4. In Figure 5 there are outer boundaries marked with solid red line (unlike the red dashed lines, which also connect boundary points, but do not form outer bounding box).
We test these 4 points subsequently taking 3 of them in one testing step. We check whether we can make up a right-angled isosceles triangle. If we do not find 3 such points, we shrink region by 1 point and repeat step once more with new bound-ary points. If we find 3 such points, we suppose that they are the vertexes of the “L”, which define the Finder Pattern. Their location however, is not completely exact, due to inaccuracy of threshold -ing. This is why we have to get their location more exact in following steps to get the possible best outlines defining the Finder Pattern (Figure 6).
Once the Finder Pattern is found, we verify if the two opposite sides correspond to the Timing Pattern, where the black and white modules al -ternate. Maybe the bounding box does not define Fig. 5. Outer boundaries of region
Fig. 6. Line is approaching region O
exactly the DMX code, so we have to look for a sequence of black and white modules in the wider surrounding of the initial bounding box. We do it by testing several adjacent positions and look -ing for the optimum (Figure 7). The optimum is defined as the maximum of sum of pixel intensity gradients. And the number of transitions between black and white modules is searched as the num -ber of local extremes. If the num-ber of modules is at least 10 (minimum DMX size) and is the same in both directions (both vertical and horizontal) we have found the valid DMX code.
RESULTS ACHIEVED
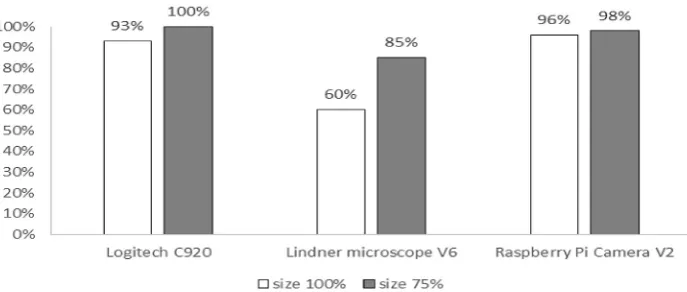
The method mentioned above was tested on the test set consisting of 60 samples of DMX codes marked with laser on metal tools, which were scanned by three different cameras. In the first round the location of the images in the origi -nal size was made. In the second round the im-ages, where location failed, were resized to 75% of the original size and the location operation was repeated. In Figure 8 are the results of the Data
Matrix code location, in Figure 9 are the results of decoding the localized Data Matrix code.
As can be seen from Figure 8 and Figure 9, the results of locating and decoding the Data Ma-trix codes obtained by the Lindner microscope V6 were poor. With the images of 100% size, material errors were highlighted and the Data Matrix code was not correctly recognized. After we smoothed the image with the 3 × 3 Gauss fil -ter, we got better results. Next after resizing the image to 75%, we’ve got a smoother image and we’ve gotten still better results. We can achieve the best results by combining smoothing and ap -propriate size change.
DISCUSSION
We proposed and tested the computationally effective method for locating the Data Matrix in the images. This method is also suited to time processing and has been verified on a real-world set of images. The suggested method uses typical patterns of Data Matrix codes i.e. Finder Pattern and Timing Pattern, local thresholds, Fig. 8. The results achieved in location of DMX codes
connecting of points into continuous areas and outer region boundaries.
We also proposed a modified, computation -ally efficient adaptive thresholding technique that uses local mean and variance under the sliding window. This technique has achieved significantly better results in special cases that we have to solve than classical adaptive thresholding method that use only local mean and delta constant. We have shown that image resolution has impact on recognition rate and we have also shown that the iterative image rescaling and following recognition can fur-ther improve results.
The most common causes of localization failure were the structure of the material on the surface of instruments that caused reflection of the light and consequently caused the incorrect results in the adaptive thresholding. As a solu-tion how to overcome these problems, we’ve improved local thresholding with a equation (1). This technique, unlike the commonly used Ni -black and Sauvola techniques, does not require a square root calculation for each point to calculate a standard deviation, and is less sensitive to the selection of the k parameters.
When deploying the proposed method, it is necessary to resolve the problem of scanning of the image, because many commonly used cam -eras, mobile phones and tablets have auto-focus to focus on the object in front of the lens, and it takes some time to focus on the image, which ap -pears in normal operation as a disadvantage, be -cause the shooting is not smooth.
CONCLUSIONS
Data Matrix is used in many areas of every -day life, we encounter them in shops, offices, warehouses, and scientific workplaces. They serve to identify goods, documents, products, consignments or tools. Their main benefits are speed and low cost of identification, so they are also expanded in industry, food, automotive, and electrotechnics. They are used to designate differ -ent parts and, spare parts, especially in complex logistics areas where there is a high demand for precise and rapid transfer of information about the state of production and storage.
Due to the high density of writing on a small area, they are suitable for use on small objects such as processors, chips, electronic
components, military applications, and so on. Data Matrix Codes are most suitable for use in logistics. Logistics involves a number of ac-tivities whose task is to have the right object at the right time in the right place in the required quantity and quality with the necessary infor -mation at the right price. In the future, Data Matrix codes could replace RFID technology, which hitherto hints at high introductory costs and the need for project solutions. The low cost, accuracy, speed, reliability, flexibility, productivity and efficiency, as well as the abil -ity to write large amounts of data on a small area, is still a great advantage of Data Matrix Codes in Logistics.
Acknowledgements
This paper was prepared within the work on a research project KEGA MŠ SR 003TU Z-4/2016: Research and education laboratory for robotics.
REFERENCES
1. Huang Q., Chen W-S., Huang X-Y. and Zhu Y-Y. Data Matrix Code Location Based on Finder Pattern Detection and Bar Code Border Fitting. Mathematical Problems in Engineering, 2012, 13 p.
2. Burns J.B., Hanson A.R. and Riseman E.M. Ex
-tracting straightlines. IEEE Transactions on Pattern Analysis and Machine Intelligence, 1986.
3. Gioi G.R., Jakubowicz J., Morel J.M. and Randall G. LSD: a fastline segment detector with a false detection control. IEEE Transactions on Pattern Analysis and Machine Intelligence, 2010.
4. Donghong H., Hui T. and Xinmeng C. Radon trans -formation applied in two dimensional barcode
im-age recognition. Journal of Wuhan University, 2005. 5. Chenguang Z., Na Y. and Rukun H. Study of two
dimensional barcode identification technology based on HOUGH transform. Journal of Changc
-hun Normal University, 2007.
6. Hrčková M. and Koleda P. Identifikácia objektov v obraze na základe geometrických príznakov. Acta Facultatis Technicae, XIX(2), 2014, 13–19. 7. Waters J.: QR Codes For Dummies. 1. London: For
Dummies, 2012.
8. Price K.: QR Codes Made EZ. A Complete Guide to Creating and Implementing QR Codes. 1. North Charleston: CreateSpace, 2014.
9. Karrach L. and Pivarčiová E. Data Matrix code lo
Acta facultatis technicae, XXII(2), 2017, 29–38.
10. Karrach L. and Pivarčiová E. The analyse of the
various methods for location of Data Matrix codes
in images. Elektro 2018: 12th International Con
-ference, Mikulov, 2018.
11. Lin J-A., Fuh CH-S. 2D Barcode Image Decoding. Mathematical Problems in Engineering, 2013.
12. Gaur P. and Tiwari S. Recognition of 2D Barcode Images Using Edge Detection and Morphological Operation. International Journal of Computer Sci
-ence and Mobile Computing, 2014.
13. Li S., Shang J., Duan Z. and Huang J. Fast de
-tection method of quick response code based on run-length coding. IET Image Processing, 12(4), 2018, 546 –551.
14. Hansen D.K. and Nasrollahi K. Real-Time Barcode
Detection and Classification Using Deep Learning. 9th International Joint Conference on Computa
-tional Intelligence, 2017.
15. Szymczyk T., Montusiewicz J. and Gutek D. Navi -gation in large-format buildings based on RFID
sensors and QR and AR markers. Advances in Sci
-ence and Technology Research Journal, 10(31), 2016, 263–273.
16. Turygin Y., Božek P., Nikitin Y., Sosnovich E. and Abramov A.: Enhancing the reliability of mobile
robots control process via reverse validation.
In-ternational Journal of Advanced Robotic Systems, 13(6), 2016, 1–8.
17. Božek P. Robot path optimization for spot weld
-ing applications in automotive industry. Tehnicki Vjesnik – Technical Gazette, 20(5), 2013, 913–917. 18. More M., Liska O. and Kovac J. Experimental ver
-ification of force feedback for rehabilitation robot.
International journal of engineering research in
Af-rica, 18, 2015, 123–129.
19. Liptak T., Virgala I., Frankovsky P., Šarga P., Gmiterko A. and Baločková L. A geometric ap
-proach to modeling of four- and five-link planar snake-like robot. International journal of advanced robotic systems, 13, 2016.
20. Umut I., Aki O., Uçar E. and Öztürk L. Detection
of driver sleepiness and warning the driver in real-time using image processing and machine learning
techniques. Advances in Science and Technology Research Journal. 11(2), 2017, 95–102.
21. Neradilova H. and Fedorko G. The Use of Com
-puter Simulation Methods to Reach Data for Eco
-nomic Analysis of Automated Logistic Systems. Open Engineering, 6(1), 2016, 700–710.
22. Molnar V., Fedorko G., Andrejiova M., Grinčová A. and Michalík P. Online monitoring of a pipe conveyor. Part I: Measurement and analysis of se
-lected operational parameters. Measurement, 94, 2016, 364–371.
23. Lonkwic P., Rozylo P. and Debski H. Numerical and experimental analysis of the progressive gear body with the use of finite-element method. Eksp -loatacja i niezawodnosc-maintenance and
reliabil-ity, 17(4), 2015, 544–550.
24. Garbacz T., Jachowicz T., Gajdos I. and Kijewski G. Research on the influence of blowing agent on
selected properties of extruded cellular products.
Advances in Science and Technology Research Journal, 9(28), 2015, 81–88.
25. Fedorko G., Molnar V., Dovica M., Husáková N., Kráľ J. and Ferdynus M. The use of indus