R E S E A R C H
Open Access
Cross-section perimeter is a suitable parameter to
describe the effects of different baffle geometries
in shaken microtiter plates
Clemens Lattermann
1†, Matthias Funke
2†, Sven Hansen
3, Sylvia Diederichs
1and Jochen Büchs
1*Abstract
Background:Biotechnological screening processes are performed since more than 8 decades in small scale shaken bioreactors like shake flasks or microtiter plates. One of the major issues of such reactors is the sufficient oxygen supply of suspended microorganisms. Oxygen transfer into the bulk liquid can in general be increased by introducing suitable baffles at the reactor wall. However, a comprehensive and systematic characterization of baffled shaken bioreactors has never been carried out so far. Baffles often differ in number, size and shape. The exact geometry of baffles in glass lab ware like shake flasks is very difficult to reproduce from piece to piece due to the hard to control flow behavior of molten glass during manufacturing. Thus, reproducibility of the maximum oxygen transfer capacity in such baffled shake flasks is hardly given.
Results:As a first step to systematically elucidate the general effect of different baffle geometries on shaken bioreactor performance, the maximum oxygen transfer capacity (OTRmax) in baffled 48-well microtiter plates as shaken model reactor was characterized. This type of bioreactor made of plastic material was chosen, as the exact geometry of the baffles can be fabricated by highly reproducible laser cutting. As a result, thirty different geometries were investigated regarding their maximum oxygen transfer capacity (OTRmax) and liquid distribution during shaking. The relative perimeter of the cross-section area as new fundamental geometric key parameter is introduced. An empirical correlation for the OTRmaxas function of the relative perimeter, shaking frequency and filling volume is derived. For the first time, this correlation allows a systematic description of the maximum oxygen transfer capacity in baffled microtiter plates.
Conclusions:Calculated and experimentally determined OTRmaxvalues agree within ± 30% accuracy. Furthermore, undesired out-of-phase operating conditions can be identified by using the relative perimeter as key parameter. Finally, an optimum well geometry characterized by an increased perimeter of 10% compared to the unbaffled round geometry is identified. This study may also assist to comprehensively describe and optimize the baffles of shake flasks in future.
Keywords:Shaken bioreactors, Maximum oxygen transfer capacity (OTRmax), Degree of baffling, Relative perimeter, Out-of-phase phenomena
* Correspondence:[email protected] †Equal contributors
1
AVT.Biochemical Engineering, RWTH Aachen University, Worringer Weg 1, 52074 Aachen, Germany
Full list of author information is available at the end of the article
Introduction
Shaken small scale bioreactors like shake flasks or microti-ter plates are typically used for high throughput screening processes today. In the last years, many efforts have been made to characterize small scale bioreactors by describing and modeling liquid distribution, gas transfer, specific power input as well as mixing (reviewed in [1-7]). These efforts are motivated by the need to understand the yet insufficiently characterized screening systems in more detail. Furthermore, knowledge about important process parameters in an earlier stage of process development is desired [7,8]. While shake flasks are already characterized to some extent, there are several open questions regarding microtiter plates. The small dimensions of these reactor systems result in specific problems like the influence of surface tension or the lack of space for on-line measure-ment equipmeasure-ment.
For successful screening processes, sufficient oxygen supply is mandatory [7]. In shaken bioreactors higher maximum oxygen transfer capacities can be achieved by reducing the filling volume or increasing the shaking fre-quency, the vessel diameter or the shaking diameter. How-ever, this approach has clear limits. Another possibility to enhance the maximum oxygen transfer capacity is the use of baffles inside the bioreactor. However, for shake flasks it is known that the reproducibility of oxygen transfer is poor between individual flasks if baffles are introduced [7,9,10]. This is due to the flow character-istics of molten pyrex glass which is very hard to control during the fabrication process of the baffles. As a result, it is nearly impossible to reproduce the exact geometries of the baffles. In most cases this can be proven even by the naked eye. Therefore, some authors even do not recommend the use of baffled shaken biore-actors at all [7,11].
Fabrication of baffles in microtiter plates is much more accurate and reproducible if laser cutting or injec-tion molding is used. A wide variety of different baffled microtiter plates were extensively studied by Funke et al. [12]. An optimal geometry was found, considering differ-ent criteria. The best version is meanwhile commercially available. It shows reproducible oxygen transfer proper-ties on an elevated level.
Up to now, no general method to predict the impact of baffles and its geometries on the maximum oxygen transfer capacity of shaken bioreactors is available. This is mainly caused by the problem to obtain a set of differ-ent baffled bioreactors with reproducible geometries made from glass. Therefore, in this work we utilized the results of Funke et al. [12] which were generated with the sulfite method for a wide variety of different reproducible geom-etries of 48-well microtiter plates as shaken model biore-actors. By using 48-well microtiter plates, an influence of surface tension which is quite prominent in 96-well
microtiter plates is minimized [4,13]. The absolute cross-section areas were consistently kept constant (112 mm2) among the different geometries. The relationship between the geometries of the wells and the maximum oxygen transfer capacities were derived and a respective mathem-atical correlation was developed. This correlation depends on the shaking frequency, the filling volume and the rela-tive perimeter of the cross-section area of the wells as new geometric key parameter. In this equation, the relative perimeter is the only criterion reflecting the degree of baffling. Thereby, all important parameters of baffling like number, size and shape of the baffles are considered in one value. This work is deemed to be the first step in understanding and quantifying the impact of baffles on shaken bioreactor performance. In a future attempt the applicability of the developed approach has to be proven also for baffled shake flasks.
Results and discussion
Influence of baffling on oxygen transfer in microtiter plates
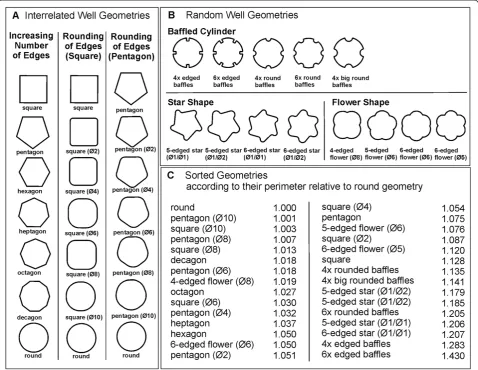
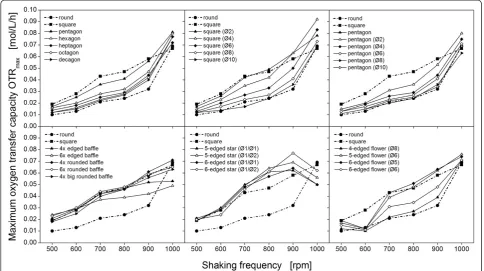
In this study, the maximum oxygen transfer capacity OTRmax of thirty different cross-section geometries in 48-well microtiter plates varying in their degree of baffling, as shown in Figure 1, were investigated. In Figure 2 the OTRmaxvalues of all geometries are exemplarily shown for a filling volume of 600 μL at increasing shaking fre-quencies. The OTRmax increases with increasing shaking frequency. Furthermore, a clear dependency between the maximum oxygen transfer capacity and the cross-section geometry of the wells can be noticed. In particular, the OTRmax values of the baffled geometries shown in Figure 1A (transition edged to round) increases between least pronounced baffling (round) and most pronounced baffling (square) for nearly all shaking frequencies (com-pare upper diagrams in Figure 2). It can be concluded, that the OTRmax systematically depends on the applied baffle geometry. However, until now only an empirical description of the performance of the different baffle designs implemented in this study was available [12]. A mathematical correlation between the degree of baffling and the OTRmax could not yet be established. Moreover, the unexpected stagnation or decrease of the OTRmax with increasing shaking frequency, as it can be observed for some well geometry in Figure 2 (compare edged star geometry, middle of bottom diagram), could not be explained.
both parameters, however, it is not possible to adequately correlate all cross-section geometries and measured maximum oxygen transfer capacities (data not shown). The description of the other well geometries shown in Figure 1B is even more difficult with this approach. A more universal key parameter is required. Therefore, vari-ous further parameters like the ratio between maximum and minimal diameter have been investigated (data not shown). Finally, the perimeter of the cross-section area of the wells has been identified as the parameter resulting in the best correlation between different cross-section geom-etries and measured OTRmax values in the investigated microtiter plates. For comparison, we normalized the per-imeter of the baffled geometry through dividing by the perimeter of the round reference geometry:
Peri:¼ Perimeterbaffled
Perimeterround : ð
1Þ
Eq. (1) represents a universal, dimensionless parameter which includes the number as well as the size and the shape of the baffles. For example, the relative perimeter of highly pronounced baffles with a steep slope is greater than that of less pronounced baffles. Also, the number of baffles is considered by using the relative perimeter as correlating parameter. This property characterizes the relative perimeter as a powerful parameter allowing a ranking of investigated geometries as shown in Figure 1C. Furthermore, the relative perimeter enables the pooling of all measurement data for one filling volume (as shown in Figure 2) in one diagram (Figure 3). Thus, the maximum Figure 1Designs of MTP well geometries (48-well plate format). (A)3 different sets of well geometries represent the gradual transition from the most pronounced baffling (square and pentagon geometry, respectively) to the least pronounced geometry (round geometry);(B)3 groups of well designs attained by introducing different types of baffles in round (baffled cylinders) or edged (star and flower shapes) well geometries. All geometries have an equivalent cross-section area of 112 mm2. The diameters of the edge roundings or the introduced half-circular baffles are
oxygen transfer capacity for all different geometries can easily be compared.
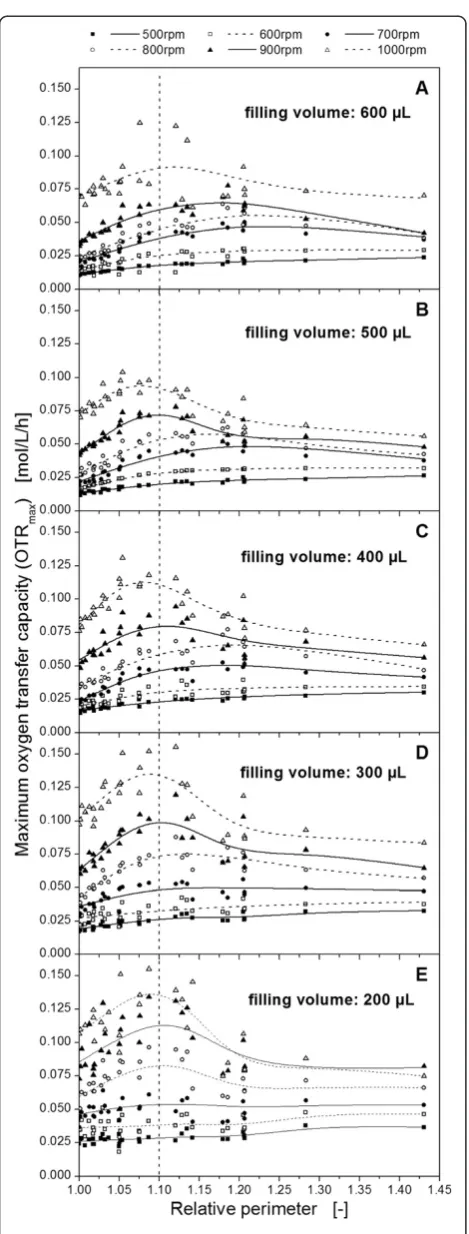
In Figure 3, the OTRmaxis plotted as a function of the relative perimeter of all investigated geometries to system-atically characterize the influence of baffles on the max-imum oxygen transfer capacity. The smoothing splines between the measurement points were calculated by ap-plying a modified L-curve criterion. As expected, the max-imum oxygen transfer capacity increases with decreasing filling volume, as illustrated in Figure 3. This result agrees with the theory and literature, since the surface-to-volume ratio, and, thus, the oxygen transfer into the bulk liquid increases with decreasing filling volume in surface aerated bioreactors [11]. The measured OTRmaxvalue in general increases with increasing shaking frequency. This trend also agrees with literature [14]. Furthermore, the shapes of the OTRmaxcurves over the relative perimeter for filling volumes of 200 - 400 μL equal each other. For example, looking at a specific shaking frequency, the OTRmaxcurves are merely shifted in their absolute height depending on the filling volume. For filling volumes of 500μL and 600μL the shape of the OTRmaxcurves seem to be smoother.
The most important result depicted in Figure 3 is the development of the OTRmaxcurves as a function of the relative perimeter. Starting at a relative perimeter of 1.0, up to a relative perimeter of approximately 1.05, a linear
increase of the OTRmaxvalues can generally be observed. Subsequently, always a maximum is reached at a relative perimeter of about 1.075 to 1.12. For even higher relative perimeters, the OTRmax values remain either constant (<700 rpm) or decrease (>700 rpm). Obviously, there is a common limit of the OTRmaxfor all applied shaking fre-quencies, filling volumes and well geometries. Expressed in other words, increasing the degree of baffling increases the maximum oxygen transfer capacity until an upper limit value is reached. This maximum is generally observed at baffled geometries with a perimeter 10% larger than the one of the unbaffled round geometry. The result is quite astonishing because it reflects the abstract character of the relative perimeter, taking number, size and shape of the baffles indirectly into account. According to Figure 1C, the maximum oxygen transfer capacity at a relative perimeter of 1.1 corresponds to a geometry between square (Ø2) and the 6-edged flower (Ø5). It is remarkable that this result excellently agrees with the qualitative observations made by Funke et al [12]. It can now be quantitatively described by means of the relative perimeter.
Influence of baffling on liquid distribution in microtiter plates
The phenomenon of stagnant or decreasing OTRmax values at relative perimeters > 1.1 in Figure 3 has to be Figure 2Maximum oxygen transfer capacity (OTRmax) obtained by the sulfite system at increasing shaking frequencies.OTRmaxvalues
are determined for different well geometries with 112 mm2cross-section area (48-well plate format). The filling volume is kept constant at
evaluated in detail to entirely explain the whole data. In order to understand the mass transfer data, the behav-iour of the rotating liquid has to be considered. The bulk liquid in shaken bioreactors typically rotates inside the vessel if in-phase conditions exist. In contrast, at out-of-phase conditions the major part of the liquid remains on the bottom of the vessel and does not move anymore. Simultaneously, the maximum liquid height and the maximum oxygen transfer capacity into the liquid is reduced.
Three different reasons for inducing these unsuitable out-of-phase conditions in shake flasks were identified in literature [15]. One effector is elevated viscosity. In this case, out-of-phase conditions are provoked, if the rotating centrifugal force is not strong enough to over-come the viscous forces [16]. A new Phase-Number Ph was defined and concluded that Ph > 1.26 is the relevant constraint for desired in-phase operation [16]. Another reason for out-of-phase conditions are unsuitable high ratios between the maximum diameter of the shaken bioreactors and the shaking diameter of the applied shaker, as shown for non-baffled large shake flasks by Büchs et al. [15] and for microtiter plate with round geometry by Kensy et al. [17]. The third reason for un-suitable out-of-phase operating conditions in shake flasks is the introduction of baffles which are too in number large in size. Problems may already occure at water-like viscosities. The probability of out-of-phase conditions increases with decreasing shaking diameter [7,15]. The undesired phenomenon appears if the rotating centrifugal force generated by the shaker is not strong enough to overcome the negative impact of the baffles preventing the bulk liquid from rotating in the flask. Although this third reason for out-of-phase conditions resembles the first reason, the above mentioned Phase-Number can not be used to evaluate the impact of baffles.
Considering the decreasing mass transfer at higher degrees of baffling (relative perimeter > 1.1) it can be speculated that out-of-phase conditions exist at relative perimeters higher than 1.1 in the investigated 48-well microtiter plates. Therefore, an experimental examination of the appearance of out-of-phase conditions has been conducted in this study. As mentioned above, the shaken liquid remains at the bottom of the well if out-of-phase
Figure 3Maximum oxygen transfer capacity (OTRmax) as a
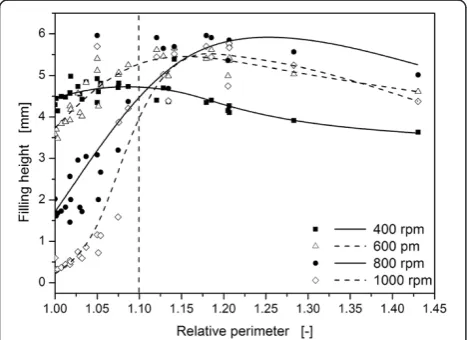
conditions are present. This implies that the liquid height at the well center is elevated compared to in-phase condi-tions. Hence, an optical measurement of the liquid height provides further information about the flow conditions in the microtiter wells and, thus, may help to explain the observations of the mass transfer study.
In Figure 4 the measured liquid heights in microtiter plates are shown for an exemplary filling volume of 500 μL and different relative perimeters and shaking frequencies. For the unbaffled round geometry (relative perimeter = 1.0) the liquid height decreases with increas-ing shakincreas-ing frequency (follow data points on the y-axis top down in Figure 4). These measurements agree with the theory that the liquid rises up the well wall the higher the centrifugal forces are and, simultaneously, drains off the well bottom. However, for all elevated perimeters < 1.1, the liquid height at the center of the wells is higher compared to the unbaffled geometry at the same shaking frequencies. In this case, more liquid is located on the well bottom due to the higher degree of baffling and the breakup and restricted movement of the bulk liquid. Although the liquid rotation is reduced, the OTRmax still increases at these operating conditions (refer to Figure 3) since the breakup of the bulk liquid also increases its surface area and introduces turbulence into the bulk liquid. For relative perimeters higher than 1.1, the liquid level remains more or less constant at high level. An increased degree of baffling completely pre-vents the rotation of the liquid. The rotating bulk liquid does not exist anymore and nearly all liquid swashes at the center of the well as illustrated by pictures for shake
flasks by Büchs [7]. As a consequence, the maximum oxy-gen transfer capacity is reduced which can be seen for relative perimeters higher than 1.1 in Figure 3. Finally, these results indicate the transition from in-phase to out-of-phase operating condition beyond the dashed lines in Figure 3 and Figure 4. Thus, the existence of optimal well geometries concerning high maximum oxygen transfer capacity in microtiter plates at a relative perimeter of about 1.1 has been confirmed by applying a completely different measurement method (liquid height) compared to the OTRmaxmeasurements.
The relative perimeter as integral parameter to calculate OTRmaxin microtiter plates
The aforementioned investigations revealed that the OTRmax of the investigated microtiter plates increases linearly with the relative perimeter until a maximal value is reached (Figure 3). For relative perimeters larger than 1.1, a constant or even decreasing trend was noticed. This observation is explained above by prevailing out-of-phase conditions. Therefore, a correlation to calculate OTRmax values depending on the relative perimeter, shaking frequency and filling volume can only be derived for relative perimeters smaller than 1.1, where regular in-phase conditions exist. By fitting the experimental re-sults with a least square method, the following equation can be obtained:
OTRmax ¼2:5⋅10−7⋅ Peri6:0⋅n2:37 ⋅V−L0:64 þ 3:3⋅ 10−4:
ð2Þ
Equation (2) represents a novel equation to pre-cal-culate the maximum oxygen transfer capacity OTRmaxin baffled 48-well microtiter plates at in-phase operating condition. The OTRmax is calculated dependent on the relative perimeter of the well geometry (Peri), the shaking frequency (n) and the filling volume (VL). From literature it is known that the shaking diameter also has a strong influence on the oxygen transfer in shaken bioreactors [14]. However, for optical on-line measurements in shaken microtiter plates using the BioLector technique, a constant shaking diameter of 3 mm is established [18]. Therefore, the shaking diameter in this study was kept constant to 3 mm and the influence of the shaking diameter is not considered in Eq. (2). The constant second term in Eq. (2) is explained by the fact that a basal oxygen transfer is accomplished by sole diffusion at static condition (without any convective flow). This effect has originally been dis-covered by Hermann et al. [13] for 96-well plates and later been verified by Kensy et al. for 48-well plates [17].
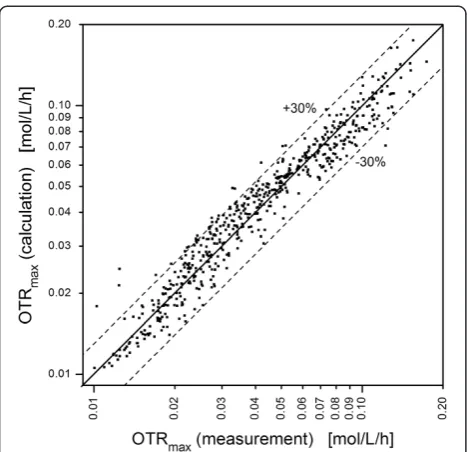
With Eq. (2) the OTRmaxvalues of the different geom-etries in Figure 1 were calculated and plotted over the values obtained by the oxygen transfer measurements. Figure 5 illustrates the comparison of the measured and Figure 4Filling height as a function of the relative perimeter.
calculated OTRmax values. It can be seen that all mea-sured data for in-phase operating condition fit to the calculated data within an accuracy of ± 30%. The few outliers which can be seen in Figure 5 do not follow a systematic behavior and cannot be assigned to certain well geometries or operating conditions. Consequently, these outliers are caused by measurement errors in the determination of the OTRmax based on optical measure-ments. Such a correlation can only be derived from a high quantity of experimental data. To reduce the experimental effort, we just considered 48-well microtiter plates in this study. Experimental data from shake flasks are much more time consuming to obtain and less reproducible due to the variability of the baffles, as explained in the introduc-tion. Furthermore, an experimental survey of our results in microtiter plate formats, which differ from the 48-well dimensions, is a topic for further investigations. Thereby, the height of the well geometry will not have a direct in-fluence on the oxygen transfer. It just limits the maximum liquid height in the well and, thus, the maximum shaking frequency. The only defining parameter for different well geometries is already incorporated in our correlation, since the perimeter of the baffled well geometry has been defined as its relative value compared to the perimeter of the round geometry with the same well area (Eq. (1)). By defining the perimeter in that relative way, the obtained results, i.e. the calculation of the OTRmaxup to a relative perimeter of 1.1, can be transferred to larger well geom-etries. However, due to changing surface-to-volume ratios, an adaptation of Eq. (2) can be expected, if other microtiter
plate formats are used. To complete the discussion, it has to be emphasized that Eq. (2) is restricted so far to a shak-ing diameter of 3 mm and liquids of water-like viscosities. Furthermore, the influence of surface tension, which is observed in small volume microtiter plates (e.g. 96-well plates), is not taken into account just as the influence of the material surface properties is not considered, which might influence the oxygen transfer as observed in shake flasks [14]. However, from current state of knowledge it is legitimate to assume that the relative perimeter can also be used as key parameter to describe different well formats. Keeping in mind that the investigated baffled geometries vary significantly in number, size and shape, Eq. (2) represents a substantial improvement to characterize the oxygen transfer capacity in small scale shaken bioreactor systems. It is the first time that the maximum oxygen transfer capacities in shaken baffled bioreactors were quantitatively described. With the experi-ence made with 48-well microtiter plates in future work also the effect of baffles in shakes flasks made of glass or plastic material will be investigated.
Conclusion and outlook
In this work the influence of baffling on the maximum oxygen transfer capacity in 48-well microtiter plates has quantitatively been investigated. The relative perimeter of the cross-section area was chosen as geometric key parameter to correlate the maximum oxygen transfer capacity with the shaking frequency and filling volume. In agreement with the qualitative results of Funke et al [12], an optimum maximum oxygen transfer capacity could be found at a relative perimeter of 1.1. Further-more, optical measurements of the liquid height at the center of the wells were conducted to obtain additional information about the prevailing operating condition. It could be shown that undesired out-of-phase conditions exist if the relative perimeter exceeds values of 1.1. With this investigation, a phenomenological explanation for the measured mass transfer values could be given. Finally, an empirical correlation was derived to calculate the maximum oxygen transfer capacity in baffled micro-titer plates depending on the shaking frequency and filling volume. The relative perimeter as geometric key parameter includes the specific properties of the baffles. Therefore, the degree of baffling in microtiter plates can now quantitatively be described for new geometries if liquids with water-like viscosities are used and effects caused by surface tension are negligible. The obtained correlation is limited to microtiter plates shaken at a shaking diameter of 3 mm. Further investigations in other shaken bioreactors like shake flasks or large shaken barrels have to be carried out to extend the cor-relation to a more universal equation. The influence of specific effects in small scale bioreactors, e.g. caused by Figure 5Comparison of calculated and measured OTRmax
values.Only well geometries with a relative perimeter of < 1.1 are considered. The OTRmaxvalues are calculated according Eq. (2).
surface tension, could also be investigated in future studies.
Materials and methods Baffled well geometries
A total of thirty different well geometries, varying in number, size and shape of the baffles, were investigated in this work. The baffled geometries shown in Figure 1 have been realized in the wells of 48-well microtiter plates by introducing rectangular or rounded wall struc-tures. The dimensions of the wells were chosen as such that the cross sectional area is always equivalent (112 mm2) to the round reference geometry.
Prototypes of microtiter plate bodies were fabricated out of a 20 mm thick acrylic glass plate (polymethyl methacrylat, PMMA) with outer dimensions of 128 mm × 85 mm by laser cutting. To seal the bottom, a PMMA plate of 2 mm thickness was glued onto the bottom of the prototype bodies. As illustrated in Figure 1A, 3 different sets of well geometries represent a gradual transition from the most pronounced baffling (square and pentagon geometry, respectively) to the least pronounced baffling (round geometry). The transition was realized in 3 differ-ent ways. First, starting at square geometry, the number of edges is continuously increased. Second and third, starting at square and pentagon geometry, the edges are more and more rounded. Moreover, Figure 1B shows 3 groups of well designs attained by introducing different types of baf-fles in round or edges well geometries. For further details regarding the investigated well geometries refer to [12].
Optical measurement system
The BioLector technique was used to determine the liquid height at the well center of the microtiter plate as well as the maximum oxygen transfer capacity OTRmax of the different baffled geometries. This optical meas-urement system enables non-invasive fluorescence and scattered light measurements in shaken microtiter plates [18]. The shaking process of the microtiter plate is not interrupted and, thus, disturbing influences during measurement are avoided. Thereby, a quasi-continuous measurement in shaken microtiter plates is realized. In this study, a slightly modified BioLector system was used which consists of an orbital shaker (based on Lab-Shaker LS-W, Kühner AG, Basel, Switzerland), a x-y linear drive (Bosch Rexroth AG, Lohr am Main, Germany), a custom-made filter fluorescence spectrometer (PreSens GmbH, Regensburg, Germany) and a computer. The orbital shaker was modified to realize a shaking diameter of 3 mm and shaking frequencies of up to 1000 rpm. A hood was placed above the microtiter plate on the shaker tray. The hood was continuously flushed with humidified air to reduce evaporation. To avoid the influence of a cover foil, no additional cover except the hood was used. For further
information regarding the optical measurement device refer to [12].
Characterization of oxygen transfer with a 0.5 M sulfite system
The maximum oxygen transfer capacity OTRmaxof the different well geometries was characterized by applying a slightly modified sulfite oxidation method originally developed by Hermann et al. [13,17,19]. As described in detail by Funke et al. [12], the pH-indicator of the ori-ginal recipe [19] was replaced by a 2 · 10−8M hydroxy-pyrenetrisulfonic acid (HPTS) solution (Fluka, Buchs, Switzerland), which shows pH dependent fluorescence properties. Corresponding to the mentioned sulfite oxida-tion method, the time toxis measured until the oxidation of the 0.5 M sodium sulfite to sulfate is completed. At the end of the reaction the pH value in the test solution drops sharply. The fluorescence of HPTS, excited at 420 nm and measured above 515 nm, decreases with decreasing pH. Thus, the pH drop and, therefore, the reaction time can be exactly monitored by means of optical measurements. For known reaction time (tox), initial concentration of sulfite (csulfite) and stoichiometric coefficient for oxygen (νO2= 0.5), the oxygen transfer rate (OTR) from gas to liquid phase can be calculated as follows:
OTR ¼ kLa ⋅ cO2−cL
¼ csulfite ⋅ νO2=tox: ð3Þ
In Eq. (3) the volumetric mass transfer coefficient kLa as well as the oxygen concentrations in the bulk liquid (cL) and the oxygen concentration at the liquid gas inter-face (cO2* ) are unknown. According to Weisenberger and Schumpe [20], the oxygen concentration at the liquid gas interface cO2* can be calculated as the product of oxygen solubility in the liquid and the oxygen partial pressure in the gas phase (LO2= 8.35 · 10−4mol∙L−1∙bar−1 at 25°C, pG= 0.2095 bar). Furthermore, Hermann et al. [13] determined the reaction constant k1 for the first-order kinetic for the sulfite oxidation out of experiments in stirred tank reactors to k1= 2.385 h−1. By using a mass balance for oxygen transfer into the bulk liquid of a shaken microtiter plate, the oxygen concentration in the bulk liquid cL can be determined if the OTR is known [13]:
cL¼ OTR=k1: ð4Þ
Combining Eq. (3) and Eq. (4), the volumetric mass transfer coefficient kLa can be calculated as follows:
kLa ¼ OTR=ðLO2⋅pG−OTR=k1Þ: ð5Þ
maximum oxygen transfer capacity OTRmaxcan be cal-culated by the following equation:
OTRmax ¼kLa ⋅ cO2
¼ OTR ⋅ LO2 ⋅ pG=ðLO2 ⋅ pG−OTR=k1Þ: ð6Þ
Using Eq. (6), the maximum oxygen transfer capacity can now be obtained indirectly through measurement of the oxygen transfer rate.
Detection of out-of-phase conditions through liquid height measurements
The liquid height at the well center of the microtiter plate was determined by measuring the fluorescence intensity of a 1.25 · 10−6M fluorescein solution (sodium salt, Fluka, Buchs, Switzerland) in 0.2 M sodium phos-phate buffer (pH 7) (Roth, Karlsruhe, Germany). The fiber optics of the BioLector prototype was vertically installed underneath the wells. All experiments to deter-mine the liquid height were conducted at a constant filling volume of VL= 500 μL and different shaking fre-quencies of 400–1000 rpm. The fluorescence was excited at 420 nm (bandpassfilter ± 10 nm) and detected above 515 nm (cut-of filter). For calibration, different filling volumes of the fluorescein solution were filled into the microtiter plate prototypes. The fluorescence signal was measured at a shaking frequency of 200 rpm, where no liquid movement occurs [13]. Since the cross-section area for each geometry is constant (112 mm2), the liquid height can be calculated depending on the filling volume. The fluorescence signal of the fluorescein solution decreases with decreasing liquid height. Thus, a geometry-independ-ent correlation of fluorescence signal and liquid height at the well center is obtained.
Fitting of measurement data by applying the L-curve criterion
For the graphical presentation both the experimental data of the maximum oxygen transfer capacity and of the filling height at the well center were fitted by using smoothing splines. The regularization parameter αof the smoothing spline fit was determined by using the L-curve criterion [21,22]. The L-curve is a plot of the norm of the regularized solution (S) representing the smoothness of the curve (Eq. (7)) versus the norm of the corre-sponding residual (R) representing the data error (Eq. (8)). A good compromise between both norms, i.e. a suitable regularization parameter can be found at the “corner” of the L-curve plot. This is the point where the curve is closest to the origin.
S¼ j X→j
¼ ffiffiffiffiffiffiffiffiffiffiffiffiffiffiffiffiffiffiffiffiffiffiffiffiffiffiffiffiffiffiffiffiffiffiffiffiffiffiffiffiffiffiffiffiffiffiffiffiffiffiffiffiffiffiffiffiffiffiffiffiffiffiffiffiffiffiffiffiffiffiffiffiffiffiffiffiffiffiffiffiffiffiffiffiffiXspline;1
2
þ Xspline;2
2
þ…þ Xspline;i
2
q
ð7Þ
R¼ j X→j
¼ ffiffiffiffiffiffiffiffiffiffiffiffiffiffiffiffiffiffiffiffiffiffiffiffiffiffiffiffiffiffiffiffiffiffiffiffiffiffiffiffiffiffiffiffiffiffiffiffiffiffiffiffiffiffiffiffiffiffiffiffiffiffiffiffiffiffiffiffiffiffiffiffiffiffiffiffiffiffiffiffiffiffiffiffiffiffiffiffiffiffiffiffiffiffiffiffiffiffiffiffiffiffiffiffiffiffiffiffiffiffiffiffiffiXspline;1−X1
2
þ Xspline;2−X2
2
þ…þ Xspline;i−Xi
2
q
ð8Þ
A slight modification compared to the literature was used when applying the L-curve criterion. The square of the norm of the corresponding residual (R2) was doubled in order to obtain a fitting better representing the experi-mental data. Thus, the suitable regularization parameterα was defined as the radius of a circle around the origin which touches the L-curve at the closest point to the origin. This led to the following minimization problem:
minα2⋅R2αþ S2α: ð9Þ
Equations (7) to (9) were implemented into an algo-rithm and solved by applying the MATLAB software package (Version 7.8.0; The Mathworks, MA, USA).
Abbreviations
HPTS:8-Hydroxypyrene-1,3,6-trisulfonic acid; MTP: Microtiter plate; α: Regularization parameter [-]; cL: Oxygen concentration in the liquid
[mol/L]; cO2* : Oxygen concentration at the gas-liquid interface [mol/L];
csulfite: Sulfite concentration [g/L]; k1: First-order kinetic reaction constant
[1/h]; kLa: Volumetric mass transfer coefficient [1/h]; LO2: Oxygen solubility in
the liquid [mol/L]; n: Shaking frequency [1/min]; OTR: Oxygen transfer rate [mol/L/h]; OTRmax: Maximum oxygen transfer capacity [mol/L/h]; pG: Oxygen
partial pressure in the gas phase [bar]; Peri: Normalized perimeter of the baffled geometry [-]; Perimeterbaffled: Perimeter of the baffled geometry
[mm]; Perimeterround: Perimeter of the round reference geometry [mm];
Ph: Phase-Number [-]; R: Residual, representing the data error [-]; S: Regularized solution, representing the smoothness of the curve [-]; tox: Reaction time [s]; VL: Filling volume [μL];νO2: Stoichiometric coefficient of
oxygen [-]; Xspline,i: Data point of the spline [-], in this study substituted by
calculated data of OTRmax; Xi: Data point of measurement data [-], in this
study substituted by measured data of OTRmax.
Competing interests
The authors declare that they have no competing interests.
Authors’contributions
CL is the author of the final version of this study. MF is responsible for the experimental results. He also drafted the first version of the manuscript. CL, MF and JB masterminded the study and participated in its design, coordination, and drafting and finalizing of the manuscript. SH kindly assisted in fitting the experimental data. SD supported in conducting and evaluating experimental results. All authors read and approved the final manuscript.
Author details
1AVT.Biochemical Engineering, RWTH Aachen University, Worringer Weg 1,
52074 Aachen, Germany.2Lonza Group Ltd, Münchensteinerstraße 38, 4002 Basel, Switzerland.3Evonik Industries AG, Rodenbacher Chaussee 4, 63457 Hanau-Wolfgang, Germany.
References
1. Kirk TV, Szita N:Oxygen transfer characteristics of miniaturized bioreactor systems.Biotechnol Bioeng2013,110:1005–1019.
2. Klöckner W, Büchs J:Advances in shaking technologies.Trends Biotechnol
2012,30:307–314.
3. Schäpper D, Alam MNHZ, Szita N, Lantz AE, Gernaey KV:Application of microbioreactors in fermentation process development: a review.
Anal Bioanal Chem2009,395:679–695.
4. Duetz WA:Microtiter plates as mini-bioreactors: miniaturization of fermentation methods.Trends Microbiol2007,15:469–475. 5. Fernandes P, Cabral JMS:Microlitre/millilitre shaken bioreactors in
fermentative and biotransformation processes - a review.Biocatal Biotransform2006,24:237–252.
6. Kumar S, Wittmann C, Heinzle E:Minibioreactors.Biotechnol Lett2004,
26:1–10.
7. Büchs J:Introduction to advantages and problems of shaken cultures.
Biochem Eng J2001,7:91–98.
8. Bareither R, Pollard D:A review of advanced small-scale parallel bioreactor technology for accelerated process development: current state and future need.Biotechnol Progr2011,27:2–14.
9. Delgado G, Topete M, Galindo E:Interaction of cultural conditions and end-product distribution inBacillus subtilisgrown in shake flasks.
Appl Microbiol Biotechnol1989,31:288–292.
10. McDaniel LE, Bailey EG, Zimmerli A:Effect of oxygen supply rates on growth ofEscherichia coli- I: studies in unbaffled and baffled shake flasks.Appl Microbiol1965,13:13.
11. Henzler HJ, Schedel M:Suitability of the shaking flask for oxygen supply to microbial cultures.Bioprocess Eng1991,7:123–131.
12. Funke M, Diederichs S, Kensy F, Müller C, Büchs J:The baffled microtiter plate: increased oxygen transfer and improved online monitoring in small scale fermentations.Biotechnol Bioeng2009,103:1118–1128. 13. Hermann R, Lehmann M, Büchs J:Characterization of gas-liquid mass
transfer phenomena in microtiter plates.Biotechnol Bioeng2003,
81:178–186.
14. Maier U, Büchs J:Characterisation of the gas-liquid mass transfer in shaking bioreactors.Biochem Eng J2001,7:99–106.
15. Büchs J, Lotter S, Milbradt C:Out-of-phase operating conditions, a hitherto unknown phenomenon in shaking bioreactors.Biochem Eng J
2001,7:135–141.
16. Büchs J, Maier U, Milbradt C, Zoels B:Power consumption in shaking flasks on rotary shaking machines: II: nondimensional description of specific power consumption and flow regimes in unbaffled flasks at elevated liquid viscosity.Biotechnol Bioeng2000,68:594–601.
17. Kensy F, Zimmermann HF, Knabben I, Anderlei T, Trauthwein H, Dingerdissen U, Büchs J:Oxygen transfer phenomena in 48-well microtiter plates: determination by optical monitoring of sulfite oxidation and verification by real-time measurement during microbial growth.Biotechnol Bioeng2005,89:698–708.
18. Samorski M, Müller-Newen G, Büchs J:Quasi-continuous combined scattered light and fluorescence measurements: a novel measurement technique for shaken microtiter plates.Biotechnol Bioeng2005,92:61–68. 19. Hermann R, Walther N, Maier U, Büchs J:Optical method for the
determination of the oxygen-transfer capacity of small bioreactors based on sulfite oxidation.Biotechnol Bioeng2001,74:355–363.
20. Weisenberger S, Schumpe A:Estimation of gas solubilities in salt solutions at temperatures from 273 K to 363 K.Aiche J1996,42:298–300. 21. Hansen PC, O'Leary DP:The use of the L-curve in the regularization of
discrete ill-posed problems.SIAM J Sci Comput1993,14:1487–1503. 22. Hansen PC:Analysis of discrete ill-posed problems by means of the
L-curve.SIAM Rev1992,34:561–580. doi:10.1186/1754-1611-8-18
Cite this article as:Lattermannet al.:Cross-section perimeter is a suitable parameter to describe the effects of different baffle geometries in shaken microtiter plates.Journal of Biological Engineering20148:18.
Submit your next manuscript to BioMed Central and take full advantage of:
• Convenient online submission
• Thorough peer review
• No space constraints or color figure charges
• Immediate publication on acceptance
• Inclusion in PubMed, CAS, Scopus and Google Scholar
• Research which is freely available for redistribution