R E S E A R C H
Open Access
Associations between ozone and morbidity using
the Spatial Synoptic Classification system
Adel F Hanna
1*, Karin B Yeatts
2, Aijun Xiu
1, Zhengyuan Zhu
3, Richard L Smith
4, Neil N Davis
1, Kevin D Talgo
1,
Gurmeet Arora
5, Peter J Robinson
6, Qingyu Meng
7and Joseph P Pinto
8Abstract
Background:Synoptic circulation patterns (large-scale tropospheric motion systems) affect air pollution and, potentially, air-pollution-morbidity associations. We evaluated the effect of synoptic circulation patterns (air masses) on the association between ozone and hospital admissions for asthma and myocardial infarction (MI) among adults in North Carolina.
Methods:Daily surface meteorology data (including precipitation, wind speed, and dew point) for five selected cities in North Carolina were obtained from the U.S. EPA Air Quality System (AQS), which were in turn based on data from the National Climatic Data Center of the National Oceanic and Atmospheric Administration. We used the Spatial Synoptic Classification system to classify each day of the 9-year period from 1996 through 2004 into one of seven different air mass types: dry polar, dry moderate, dry tropical, moist polar, moist moderate, moist tropical, or transitional. Daily 24-hour maximum 1-hour ambient concentrations of ozone were obtained from the AQS. Asthma and MI hospital admissions data for the 9-year period were obtained from the North Carolina Department of Health and Human Services. Generalized linear models were used to assess the association of the
hospitalizations with ozone concentrations and specific air mass types, using pollutant lags of 0 to 5 days. We examined the effect across cities on days with the same air mass type. In all models we adjusted for dew point and day-of-the-week effects related to hospital admissions.
Results:Ozone was associated with asthma under dry tropical (1- to 5-day lags), transitional (3- and 4-day lags), and extreme moist tropical (0-day lag) air masses. Ozone was associated with MI only under the extreme moist tropical (5-day lag) air masses.
Conclusions:Elevated ozone levels are associated with dry tropical, dry moderate, and moist tropical air masses, with the highest ozone levels being associated with the dry tropical air mass. Certain synoptic circulation patterns/ air masses in conjunction with ambient ozone levels were associated with increased asthma and MI
hospitalizations.
Background
The complex relationship between climate, air pollution, and health outcomes has been explored in many research studies that characterize health outcomes in terms of correlates of meteorological and air quality variables. It is well known that temperature is a good predictor of morbidity and mortality, especially during extremes of cold or heat, or seasonally [1-5]. In addition, exacerbation of asthma symptoms has been linked to
day-to-day variations in temperature and humidity [6] and to thunderstorms [7].
Extensive research indicates that exposure to air pollu-tion has serious public health consequences in terms of both morbidity and mortality. Epidemiologic studies indicate that elevated levels of ground-level ozone are linked to cardiovascular and respiratory morbidity and mortality [8-12]. In particular, the published literature [8] shows that subpopulations with cardiovascular dis-ease or respiratory disdis-ease are more likely to be affected by air pollution. This ozone-mortality association, how-ever, shows regional heterogeneity (based on intercity response), with cities in the northeastern United States
* Correspondence: [email protected]
1
Institute for the Environment, The University of North Carolina at Chapel Hill, Chapel Hill, North Carolina, 27599, USA
Full list of author information is available at the end of the article
showing greater response [13]. Several studies [8-14] have shown that the risk of hospitalization increases with elevated levels of ozone (and also with elevated levels of the fine particulate matter known as PM2.5).
However, our understanding of the relationships among meteorological parameters, air pollution, and health remains incompletely defined [15-18].
Ozone in the atmosphere is a secondary pollutant: it is formed by photochemical reactions of precursors, rather than being directly emitted from specific sources. Ozone and other oxidants, such as peroxyacyl nitrates and hydrogen peroxide (H2O2), form in polluted areas by
atmospheric reactions involving two main classes of pre-cursor pollutants: volatile organic compounds (VOCs) and nitrogen oxides (NOx).
The chemical processes and meteorological conditions involved in ozone formation typically extend over spatial scales of hundreds of thousands of square kilometres [19,20], which suggests that ozone formation is best understood in the context of large-scale atmospheric patterns and not just in terms of local conditions.
Usually when associations between adverse health effects and air pollutants are studied, only a few meteor-ological variable are considered (for example, tempera-ture and relative humidity). However, additional information can be gained when examining these asso-ciations by including additional meteorological variables relevant to air pollution development, as described above. One such approach involves the use of air masses. An air mass is defined as a large volume of air with relatively homogenous meteorological variables (temperature, humidity, cloud cover, etc.) that occurs over large spatial domains, usually for several days. The relationships among meteorological parameters charac-terize the identity of air masses in terms of dry versus wet and warm versus cold, in association with other related parameters such as cloudiness, precipitation, and winds. Thus, characterization of weather at a given loca-tion using the air mass concept also provides informa-tion about the potential of meteorological condiinforma-tions to affect air quality, the transport history of the air, and the upwind pollution sources affecting air quality on a particular day at that given location.
The Spatial Synoptic Classification (SSC) system [21,22] has been used to characterize meteorological conditions at various locations in terms of air masses. Pope and Kalkstein [23] proposed a synoptic climatology approach to account for the possible confounding effect of weather on the relationship between course
particu-late matter (PM10) and mortality. Subsequently, the
synoptic approach has been used in a number of studies examining linkages between weather situations and health outcomes [21,24-26], and between weather situa-tions, air pollution [27], and health outcomes [28,29].
These studies were able to place results in a broader context than would have been obtained by using indivi-dual meteorological variables.
In this research we use the air mass approach to examine the complex relationship between meteorology and air quality and the associated health outcomes. The question that we address here is how changes (increases or decreases) in asthma and/or myocardial infarction (MI) hospital admissions are related to changes in con-centrations of ozone for a specific air mass. We use the SSC approach to characterize meteorological conditions in five cities in North Carolina, in terms of seven air mass types over a 9-year period (1996 through 2004). We then examine the associations between day-to-day variations in air masses, levels of ozone, and hospital admissions for asthma and MI over the same 9-year time frame.
Methods Exposure
We used daily meteorological, air quality, and hospitali-zation data for 1996 through 2004 for five cities in North Carolina: Asheville, Charlotte, Greensboro, Raleigh, and Wilmington. Charlotte is the largest metro-politan area in the state, followed by Raleigh (the capital city) and Greensboro. These three cities are located in the central part of North Carolina. Asheville is located to the west, at relatively high altitude (elevation 650 m), and Wilmington is located on the coast. Data for daily maximum temperature, daily average dew point tem-perature, daily average sea-level pressure, and daily max-imum 1-hour ozone were obtained from the U.S. EPA Air Quality System (AQS) [30]. Daily hospital admis-sions for asthma and myocardial infarctions for the 1996-2004 analysis period were obtained from the North Carolina Department of Health and Human Ser-vices (DHHS) State Center for Health Statistics. Meteor-ological, air quality, and hospitalization data were then linked by date.
conditions and terrain. The proximity of cities with similar conditions may result in similarity of the daily air mass pattern.
Synoptic air mass classifications for each day, for each of the five cities, for the period from January 1, 1996, through December 31, 2004, were based on the analysis
method of Sheridan [31]. In the SSC method, “seed
days” representing days with the typical meteorological character of each air mass at a particular location are chosen for different times of the year. Discriminant function analysis is used to produce equations for each air mass (based on the “seed days” that were chosen) that are used to assign each of the other days to a parti-cular air mass type. Applying the SSC system results in the classification of each day at a meteorological station into a specific air mass, based on temperature, dew point, pressure, wind speed and direction, cloud cover, and cloud opacity. We created box plots for daily maxi-mum 1-hour ozone, daily maximaxi-mum temperature, daily average dew point temperature, and daily average sea-level pressure for each air mass for each of the five cities.
To provide further analysis of the air quality charac-teristics of various air masses, we analyzed the relation-ship for the city of Charlotte between air mass ("AM”) and ozone ("O3”) occurrences with four distinct prob-abilities (these probprob-abilities are associated with each other under Bayes’Law).
• P(O3|AM)–The conditional probability of the
ozone concentration being above a certain level given that a day is governed by a certain air mass.
• P(AM|O3)–The conditional probability of the
appearance of a certain air mass given a day with ozone concentration above a certain level.
• P(O3)–The marginal probability of finding ozone concentration above a given level.
•P(AM)–The marginal probability of the appearance of a certain air mass.
To identify potential pollution source regions that are upwind of Charlotte for different air masses, we calcu-lated 72-hour backward trajectories using the Hybrid Single Particle Lagrangian Integrated Trajectory (HYS-PLIT) model [32]. We analyzed the frequency of 72-hour backward trajectories of near-surface flow for each air mass during the spring and summer of 2001 through 2003 for Charlotte. The number of times trajectories crossed each 1- × 1-km grid cell in a domain consisting of the contiguous U.S., Canada, and Mexico was divided by the total number of trajectories crossing all the grid cells in the domain to give a percentage. The proximity of Charlotte, Raleigh, and Greensboro led us to con-clude that the trajectory analysis conducted for
Charlotte is representative for the other two cities as well. We focused the analysis on the three air mass types that were characterized by the highest
concentra-tions of ozone–the dry moderate (DM), dry tropical
(DT), and moist tropical (MT) air masses–to identify the likely sources associated with each air mass.
Measures of Respiratory and Cardiovascular Morbidity
Daily hospital admissions data were obtained from the North Carolina Department of Health and Human
Ser-vices (DHHS), with assistance from North Carolina’s
State Center for Health Statistics (SCHS), and covered the years 1996-2005. The SCHS is legislatively mandated to maintain copies of hospital discharge data from all hospitals in North Carolina. The discharge data include information on all in-patient hospital stays from all of the state’s non-Federal, short-stay general and specialty hospitals. The data do not include information from the state’s seven psychiatric hospitals. Hospitalizations with ICD-9 codes for myocardial infarction (410.x) and asthma (493.x) were selected to represent both cardio-vascular and respiratory disease morbidity. Hospitaliza-tion data include individuals of all ages (0-100) and all races.
Using a generalized linear model (GLM), we modeled the association between daily maximum 1-hour ozone and hospitalizations for asthma and MI for the various air mass types, adjusting for meteorology, seasonality, and long-term trend. More specifically, if the number of
deaths on day t follows a Poisson distribution with
meanμt, we assume a relationship of form
logμt=
βjxj,t
where the bj are unknown coefficients, and xj,t are
covariates. Specifically, the covariates include ozone, an indicator variable representing air-mass type, average daily dew-point temperature, an indicator variable repre-senting day of week, and terms reprerepre-senting the seaso-nal and long-term trend effects. The latter are modeled by B-splines, which is a common mathematical techni-que for representing a smooth nonlinear function as a linear function of fixed basis functions [33]. The number of basis functions used (or knots) is to some extent arbi-trary, but air pollution studies often use between 3 and 10 knots per year, to represent a balance between including enough knots to represent seasonal effects but not so many that they become confounded with the air pollution effects that we are trying to model. In the pre-sent study, we used a total of 24 knots.
of the Poisson assumption, we estimated the overdisper-sion parameter using quasi-likelihood method and found no significant violation of the Poisson assumption. There were no overdispersion problems: all of the over-dispersion parameters were around 1.
Results
Daily maximum 1-hour ozone time series (1996-2004) for the five cities are shown in Figure 1; the data are plotted for the ozone season (April through September). The figure shows pronounced summer maxima mea-sured in all of the cities, although the magnitude of the seasonal variation varies from city to city. In addition,
maximum O3 concentrations are typically above 100
ppb, except in Asheville. Table 1 shows the annual 95th percentile for the data for each city. In general, the
larger urban areas of Charlotte, Raleigh, and Greensboro have more days with daily maximum 1-hour ozone exceeding 100 ppb than do Wilmington and Asheville. The years 2003 and 2004 show lower daily maximum 1-hour ozone values for the five cities compared to other years. These lower values could be related to large-scale patterns, as 2003 was an El Niño year. However, 1997 was also an El Niño year, but does not show lower values, even though the El Niño that year was stronger. Other factors such as changes in emissions might also be involved.
The seasonal distribution of daily hospital admission rates for the nine years of data considered for the study is shown in Figure 2. The asthma and MI daily hospital admission rates are the highest for Charlotte, followed by Raleigh, due to the relatively large populations of
these cities. The hospitalization rate for MI is almost always higher than for asthma in all five cities. The asthma hospitalization rates depict a seasonal pattern, with highest admissions during the fall and winter, while the MI hospitalization rates are more nearly con-stant throughout the year. Also noticeable are the rela-tively high asthma and MI hospital admission rates for Asheville compared to Wilmington (the two smaller cities).
Air Mass Classifications in North Carolina
Besides the delineation of air mass properties in terms of their moisture and temperature characteristics, each one relates to a particular synoptic-scale pattern, as revealed by the daily weather map [37]. With a focus on North Carolina, we briefly identify the surface and mid-dle troposphere meteorological patterns that character-ize each air mass. The dry polar (DP) portrays a middle-troposphere deep low-pressure trough associated with a surface high pressure that brings very cold temperatures and dry conditions to the state. The jet stream migrates to lower latitudes. A middle-troposphere cutoff low, to the west of North Carolina, displaces this pattern for the moist polar (MP), which brings to the state cloudy, humid, and cool conditions associated with northeast-erly flow from the Atlantic. The dry tropical (DT) and dry moderate (DM) air masses for North Carolina por-tray similar synoptic circulation patterns but with differ-ent moisture and temperature conditions, with surface high pressure over the southeastern U.S. associated with
the subsidence of air that undergoes warming and dry-ing after passdry-ing over the Appalachian Mountains. In addition to temperature and moisture differences, the DT and DM air masses can be distinguished from each other, in North Carolina, based on their near-surface flow patterns: the DT air mass is mainly associated with southwesterly flow that does not originate from the Gulf of Mexico, while the DM air mass is associated with more northeasterly or northwesterly flow. The moist moderate (MM) air mass is mainly associated with more easterly or northeasterly flow bringing relatively cool and moist air and precipitation to North Carolina. The moist tropical (MT) air mass brings to North Carolina warm and humid conditions associated with near-sur-face southerly flow from the Gulf of Mexico and zonal (E-W) flow aloft. Its extremes, MT+ and MT++, are dis-tinguished by a surface high-pressure system over the Atlantic to the east. The transitional (TR) air mass describes the situation on days when one air mass gives way to another.
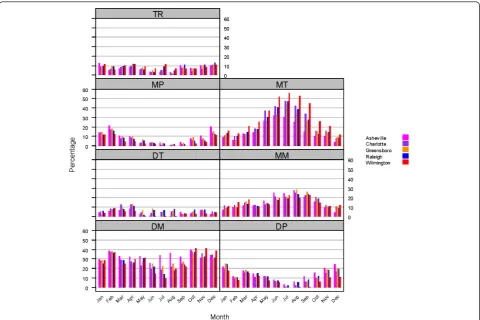
Figure 3 shows the monthly frequency of occurrence of the seven air mass types for each of the five cities in North Carolina, for the analysis period (1996-2004). The frequency of occurrence of some of these air masses shows large seasonal variations. The DP and MP air masses prevail during the fall and winter months. The MT air mass also shows a clear seasonal pattern with a summer peak for all cities, with Wilmington showing distinctly higher values of occurrence than the other cities. The DM maximum occurrence is during the fall
Figure 2Monthly average hospital admissions rate (per day) for asthma and myocardial infarction for the five cities.
Table 1 Annual 95thpercentiles of daily maximum 1-hour ozone (ppb)
City 1996 1997 1998 1999 2000 2001 2002 2003 2004
Charlotte 89 91 102 103 92 94 101 83 80
Raleigh 83 91 90 83 81 80 93 78 72
Greensboro 84 87 96 94 89 89 96 79 74
Asheville 67 69 79 78 76 70 81 60 63
and winter, and it also has the second highest occur-rence, behind the MT and MM air masses, during April to September. For Asheville (mountain city), however, the DM air mass shows steady occurrence throughout the whole year. Noticeable also is the low but steady occurrence of the DT air mass throughout the entire year for the five cities. The largest city-to-city differ-ences occur during the summer and early fall for the DM and MT air masses. Maximum differences are between Asheville and Wilmington, because their cli-mates are related to their geographic locations; Asheville is characterized by a temperate mountain climate, while Wilmington has a semitropical coastal climate.
Air Quality and Meteorological Characteristics of Air Masses
Selected meteorological and air quality characteristics of each air mass for each of the five cities are given in Fig-ure 4, which shows box plots for daily maximum 1-hour ozone, daily maximum temperature, daily average dew point temperature, and daily average sea-level pressure. The figure reveals clear distinctions between air masses, with substantial differences in ozone levels across air masses. Similar results were shown by Davis et al. [27]
for locations in the Washington, DC, vicinity and in West Virginia. The figure also reveals the clear similarity of meteorological and air quality properties for each air mass type when compared across the cities (i.e., when compared across each group of five bars). The median, maximum, and minimum values for each air mass vari-able are in general very similar for all of the cities, in particular for the three largest urban cities (Charlotte, Raleigh, and Greensboro), but also for Asheville (moun-tain city) and Wilmington (coastal city). The dry tropical and moist tropical air masses capture the highest daily maximum 1-hour ozone values and daily maximum temperature values for each city, followed closely by the dry moderate air mass. The DT air mass, as expected, is characterized by smaller values for the daily average dew point temperature than the MT air mass, whereas the MT air mass shows higher values of daily average dew point temperature. On the other hand, the DP and MP air masses occur at the lower end of the spectrum for daily maximum 1-hour ozone, daily maximum tempera-ture, and daily average dew point temperature.
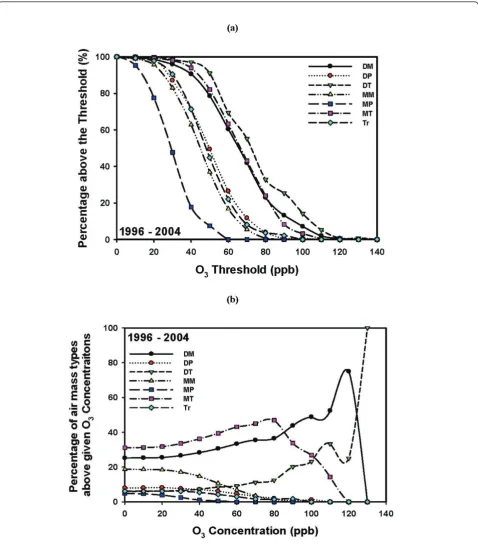
Figure 5Ozone distribution of the seven air masses for the 9-year period 1996-2004. (a) Probability (expressed as a percentage) of finding ozone (O3) concentrations above a threshold concentration for a given air mass (P(O3|AM)). (b) Probability (expressed as a percentage) of having
highest for the dry tropical air mass, followed by the moist tropical and dry moderate air masses. As was shown in Figure 3, the DT air mass occurs less fre-quently than the MT and DM air masses. The highest
ozone levels (>80 ppb) distinguished the DT, DM, and MT air masses. Lower ozone values are associated with the other air masses (dry polar, moist polar, moist mod-erate, and transitional between air masses).
Figure 5b shows the probability of being under the influence of a particular air mass for a given ozone threshold concentration [P(AM|O3)]. The figure reveals an interesting pattern: for the 9-year period from 1996 through 2004, about 50% of days with an ozone
concen-tration of≥80 ppb were found under the MT air mass,
30% were found under the DM air mass, and 10% under the DT air mass. Higher ozone values (more than 100 ppb and 120 ppb) were associated with the presence of the DT and DM air masses. We note that while the DT and MT air masses have similar extreme temperature and ozone concentration characteristics, they differ widely in moisture content, as was shown in Figure 4.
The above analyses utilize data from the entire 9-year period to produce the results shown. It is of interest to see whether such findings would also be true for subsets of the analysis period. Figure 6 shows the same statistics revealed in Figure 5 but broken down into one five-year and one four-year period (1996-2000 and 2001-2004). As can be seen, there were notable shifts in the relative importance of different air masses associated with high ozone. During the first (five-year) period (Figure 6a), ozone up to ~85 ppb was associated with either the DT or MT air masses, but above this level ozone was more likely to be found under DT or DM air masses. During the second (four-year) period (Figure 6b), the MT air mass decreases in importance compared to the DT and DM air masses above about 60 ppb. Although not shown, there were much larger changes from year to year.
High ozone levels are usually thought to be found mainly under the hot, humid conditions characteristic of the MT air mass. Instead, in Charlotte they are more likely to be found under the drier conditions associated with the DT and DM air masses. That is due to the complex relationship among ozone concentration, tem-perature, and emissions [38] and the possible advection of ozone precursors from upwind sources. As will be shown in the next section, air paths and trajectories associated with these air masses are more frequently from the southwest (for DT) and northwest/northeast (for DM) compared to the MT air mass, which is asso-ciated with more southerly flows bringing air from the Gulf of Mexico and Atlantic Ocean. The analyses con-firm that the DT, DM, and MT air masses favor condi-tions of elevated ozone levels in North Carolina.
Characteristics of Air Mass Trajectories
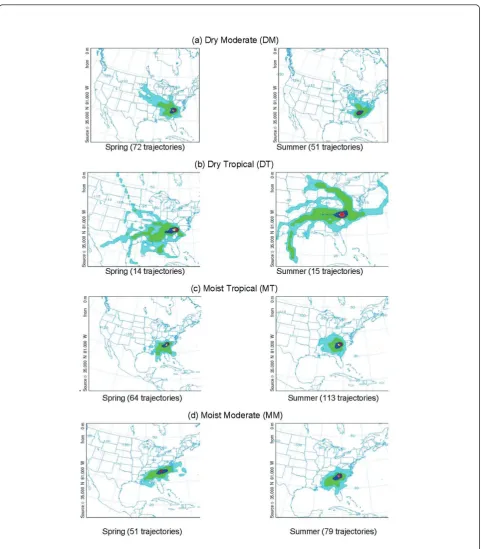
An important aspect of the association between air qual-ity and health impacts is the relevance of remote emis-sions sources that emit chemical species that can affect areas downwind. Davis et al. [27] have acknowledged the importance of linking trajectories to the type of air mass when studying high-ozone episodes. Figure 7
shows the paths taken by the 72-hour back trajectories from Charlotte for the DM, DT, and MT air masses. Figure 7 reveals that back trajectories for the DM air mass extend far to the northwest during spring, and to the northwest and northeast during summer. Back tra-jectories for the DT air mass extend even further back to the west in spring. In addition, in summer the DT air shows a trail of trajectories passing through the Ohio Valley, where many sources of NOxare located. MT air
indicates, in general, a southerly flow from the Atlantic Ocean or the Gulf of Mexico during spring and sum-mer. Also shown are the 72-hour backward trajectories for the MM air mass for comparison, even though it is not associated with elevated ozone due to its combined meteorological characteristics, as discussed above. Not shown are the back trajectories for the MP and DP air masses, due to their low probabilities of frequency dur-ing the sprdur-ing and summer seasons. Note that because of the small number of back trajectories shown in Fig-ure 7, the lower percentiles (10% and especially 5%) might represent at most only a few back trajectories, or even only one back trajectory.
Association among Air Mass, Air Quality, and Hospitalizations
For MI hospital admissions (Figure 7b), the pattern of association with increased ozone level is quite different from that for asthma. The only statistically significant positive effect is for the MT+/++ air mass at 5 days lag, though there is some weak evidence that the effects are also positive starting from 2 days lag. Statistically signifi-cant associations were not found for the other air mass types.
Discussion
We have presented results obtained by analyzing the association between ozone concentrations and hospital
trajectories) and the air quality characteristics of each air mass. The dry moderate, dry tropical, and moist tropical air masses were characterized by the largest extremes of temperature and extremes of daily maximum 1-hour ozone concentrations exceeding specified threshold values. We further examined air mass characteristics for the city of Charlotte. Clusters of 72-hour back trajec-tories for Charlotte for spring and summer of 2001 through 2003 reveal different patterns corresponding to potential upwind source regions for the DM, DT, and MT air masses. The back trajectory analyses are particu-larly useful because they relate air masses to potential emission source regions upwind of a specific location. The back trajectory analyses indicate that the DM, DT, and MT air masses were associated with transport mainly from the northwest/northeast, southwest, and south, respectively. Thus, these air masses may be asso-ciated with different pollutant mixtures.
We extended the air mass/air pollution analysis to examine the association between ozone and morbidity due to asthma and MI daily hospitalizations for Char-lotte, Raleigh, and Greensboro, using GLMs. The analy-sis showed statistically significant increases in asthma hospitalization with increases in ozone for the DT air mass for lags of 1 to 5 days, with near-significant increase for a lag of 0 days. The transitional (TR) and the extreme moist tropical (MT+/MT++) air masses also showed significant effects, but only at specific lags: lags 3 and 4, and same day, respectively. Statistically sig-nificant increases in asthma hospitalization as a result of increase in ozone levels were not found for the DM, MM, DP, and MP air masses. In general, statistically sig-nificant increases in hospital admissions for MI related to ozone increases were not found, with the exception of the MT+/MT++ air mass at 5 days lag. When consid-ering asthma and MI hospital admissions together, only the extreme moist tropical air masses (MT+/++) showed any statistically significant association with both.
These results demonstrate that ozone-related increases in hospital admissions for asthma were associated with certain air mass types, while other types did not favor any increases in hospital admissions as result of increases in the ground-level ozone concentrations. Because the air masses affecting a particular location can be forecast as part of routine weather forecasting, the information resulting from the methodology described here could assist public health officials in planning effective resource allocations–for example, scheduling additional emergency room staff when the weather forecast indicates an upcoming specific air mass pattern that could affect the community’s health. The concept of air mass classification could provide an important and distinctive approach to quantifying the complex association between climate/air quality and
health, in particular for addressing possible health impacts under future climate scenarios. Note, however, that while multiple methodologies exist for classifying the synoptic-scale pattern at a specific location [29], it is imperative that any air-mass-based approach capture the synoptic-scale meteorological pattern to reduce the uncertainty in applying this methodology.
Conclusions
Air mass approaches like the one presented here have the benefit of providing air quality and meteorological correlates in a systematic manner relevant to their potential impacts on health outcomes. For example, associations between pollutants and health outcomes could be different under different air masses, and adjust-ing sadjust-ingle meteorological parameters cannot provide the potential association between air quality and health. On the other hand, the air mass approach may characterize situations more relevant to meteorological conditions (for example, heat waves) that contribute to aggravated health outcomes and not necessarily due only to, or associated with, elevated pollution levels. For example, Sheridan et al. [26] show the relationship between increase in mortality and the extreme levels of the DT and MT air masses at a number of cities in the United States. Different cities, at different locations, may show other specific types of air masses associated with ele-vated morbidity. A broader validation of the results of this research using data from cities across the U.S. with different weather systems is warranted.
We conclude that a synoptic air mass and trajectory analysis of the association between air pollution and morbidity can provide a better understanding of how atmospheric circulation patterns and air mass types affect pollution-associated respiratory and cardiovascular hospitalizations. The occurrence of individual air masses can be forecast, providing useful information for plan-ning public health resources. This approach can also be applied to future climate scenarios, leading to a more comprehensive understanding and modeling of climatic change and air-pollution-related morbidity.
List of abbreviations
DM: dry moderate; DP: dry polar; DT: dry tropical; GLM: generalized linear model; MI: myocardial infarction; MM: moist moderate; MP: moist polar; MT: moist tropical (its extremes are MT+ and MT++); P(AM): the marginal probability of the appearance of a certain air mass; P(AM|O3): the conditional probability of the appearance of a certain air mass given a day with ozone concentration above a certain level; P(O3): the marginal probability of finding ozone concentration above a given level; P(O3|AM): the conditional probability of the ozone concentration being above a certain level given that a day is governed by a certain air mass; SSC: Spatial Synoptic Classification; TR: transitional.
Acknowledgements
air quality, meteorology, and hospitalization data. We also thank Dr. Scott Sheridan for valuable discussions during the progress of this work; and Drs. Tom Luben and Jason Ching for their thoughtful comments. The views expressed in this paper are those of the authors and do not necessarily represent EPA policy.
Author details
1Institute for the Environment, The University of North Carolina at Chapel
Hill, Chapel Hill, North Carolina, 27599, USA.2Gillings School of Global Public Health, The University of North Carolina at Chapel Hill, Chapel Hill, North Carolina, 27599, USA.3Department of Statistics, Iowa State University, Ames,
Iowa, 50011, USA.4Department of Statistics and Operations Research, The
University of North Carolina at Chapel Hill, Chapel Hill, North Carolina, 27599, USA.5HSBC Finance Corporation, Elmhurst, Illinois, 60126, USA.6Department of Geography, The University of North Carolina at Chapel Hill, Chapel Hill, North Carolina, 27599, USA.7School of Public Health, University of Medicine and Dentistry of New Jersey, Piscataway, New Jersey, 08854, USA.8U.S.
Environmental Protection Agency, Research Triangle Park, North Carolina, 27711, USA.
Authors’contributions
AFH led the design of the study and analysis of the results, and drafted the manuscript. KBY participated in the design of the study, carried out the analysis of epidemiological data, and helped to draft the manuscript. AX carried out the meteorological analysis. ZZ designed the statistical model. RLS participated in the design of the statistical model. NND carried out the trajectory analysis of air masses. KDT participated in the trajectory analysis of air masses. GA performed the statistical analyses. PJR participated in the design of the study. QM participated in the analysis of air quality data. JPP participated in the design of the study and analysis of the results, and helped to draft the manuscript. All authors read and approved the final manuscript.
Competing interests
The authors declare that they have no competing interests.
Received: 14 January 2011 Accepted: 24 May 2011 Published: 24 May 2011
References
1. O’Neil MS, Zanobetti A, Schwartz J:Modifiers of the temperature and mortality association in seven US cities.Am J Epidemiol2003,
157:1074-1082.
2. Keatinge WR, Donaldson GC:Heat acclimatization and sunshine cause false indications of mortality due to ozone.Environ Res2006,100:387-393. 3. Medina-Ramon M, Zanobetti A, Schwartz J:The effect of ozone and PM10
on hospital admissions for pneumonia and chronic obstructive pulmonary disease: A national multicity study.Am J Epidemiol2006,
163:579-588.
4. Curriero FC, Heiner KS, Samet JM, Zeger SL, Strug L, Patz JA:Temperature and mortality in 11 cities of the eastern United States.Am J Epidemiol
2002,155:80-87.
5. Anderson BG, Bell ML:Weather-related mortality: How heat, cold and heat waves affect mortality in the United States.Epidemiology2009,
20:205-213.
6. Mireku N, Wang Y, Ager J, Reddy R, Baptist A:Changes in weather and the effects on pediatric asthma exacerbations.Ann Allergy Asthma Immunol
2009,103:220-224.
7. Marks GB, Colquhoun JR, Girgis ST, Koski MH, Treloar AB, Hansen P, Downs SH, Car NG:Thunderstorm outflows preceding epidemics of asthma during spring and summer.Thorax2001,56:468-471. 8. U.S EPA:Air Quality Criteria for Ozone and Related Photochemical Oxidants
(Final)Washington, DC: U.S. Environmental Protection Agency; 2006, EPA/ 600/R-05/004aF-cF.
9. Stafoggia M, Forastiere F, Faustini A, Biggeri A, Bisanti L, Cadum E, Cernigliaro A, Mallone S, Pandolfi P, Serinelli M, Tessari R, Vigotti MA, Perucci CA, EpiAir Group:Susceptibility factors to ozone-related mortality: A population-based case-crossover analysis.Am J Respir Crit Care Med
2010,182:376-384, Epub 2010 Mar 25.
10. Strickland MJ, Darrow LA, Klein M, Flanders WD, Sarnat JA, Waller LA, Sarnat SE, Mulholland JA, Tolbert PE:Short-term associations between
ambient air pollutants and paediatric asthma emergency department visits.Am J Respir Crit Care Med2010,182:307-316, Epub 2010 Apr 8. 11. Jerrett M, Burnett RT, Pope CA, Ito K, Thurston G, Krewski D, Shi Y, Calle E,
Thun M:Long-term ozone exposure and mortality.N Engl J Med2009,
360:1085-1095.
12. Ruidavets JB, Cournot M, Cassadou S, Giroux M, Meybeck M, Ferrières J:
Ozone air pollution is associated with acute myocardial infarction.
Circulation2005,111:563-569.
13. Smith RL, Xu B, Switzer P:Reassessing the relationship between ozone and short-term mortality in U.S. urban communities.Inhal Toxicol2009,
21:37-61.
14. Middleton N, Yiallouros P, Kleanthous S, Kololotroni O, Schwartz J, Dockery D, Demokritou P, Koutrakis P:A 10-year time-series analysis of respiratory and cardiovascular morbidity in Nicosia, Cyprus: The effect of short-term changes in air pollution and dust storm.Environ Health2008,
7:39.
15. Kinney P:Climate Change, Air Quality, and Human Health.Am J Prev Med
2008,35:459-467.
16. Balbus JM, Malina C:Identifying Vulnerable Subpopulations for Climate Change Health Effects in the United States.J Occup Environ Med2009,
51:33-37.
17. O’Neill MS, Ebi KL:Temperature extremes and health: Impacts of climate variability and change in the United States.J Occup Environ Med2009,
51:13-25.
18. Bernard SM, Samet MJ, Grambsch A, Ebi KL:The potential impacts of climate variability and change in air pollution-related health effects in the United States.Environ Health Perspect2001,109:199-209.
19. Civerolo KL, Mao HT, Rao ST:The airshed for ozone and fine particulate pollution in the eastern United States.Pure Appl Geophys2003,
160:81-105.
20. Rao ST, Ku JY, Berman S, Zhang K, Mao H:Summertime characteristics of the atmospheric boundary layer and relationships to ozone levels over the eastern United States.Pure Appl Geophys2003,160:21-55.
21. Kalkstein LS, Greene JS:An evaluation of climate/mortality relationships in large US cities and the possible impacts of climate change.Environ Health Perspect1997,105:84-93.
22. Sheridan SC:The redevelopment of a weather-type classification scheme for North America.Int J Climatol2002,22:51-68.
23. Pope CA, Kalkstein LS:Synoptic weather modeling and estimates of the exposure-response relationship between daily mortality and particulate air pollution.Environ Health Perspect1996,104:414-420.
24. Smoyer KE, Kalkstein LS, Greene J, Ye H:The impacts of weather and pollution on human mortality in Birmingham, Alabama, and Philadelphia, Pennsylvania.Int J Climatol2000,20:881-897.
25. Kysely J, Huth R:Heat-related mortality in the Czech Republic examined through synoptic and‘traditional’approaches.Clim Res2004,25:265-274. 26. Sheridan SC, Kalkstein AJ, Kalkstein LS:Trends in heat-related mortality in
the United States, 1975-2004.Nat Hazards2009,50:145-160. 27. Davis RE, Normile CP, Sitka L, Hondula DM, Knight DB, Gawtry SP,
Stenger PJ:A comparison of trajectory and air mass approaches to examine ozone variability.Atmos Environ2010,44:64-74.
28. McGregor GR, Walters S, Wordley J:Daily hospital respiratory admissions and winter air mass types, Birmingham, UK.Int J Biometeorol1999,
43:21-30.
29. Huth R, Beck C, Philipp C, Demuzere A, Ustrnul Z, Cahynova M, Kysely K, Tveito O:Classifications of atmospheric circulation patterns: Recent advances and applications.Ann NY Acad Sci2008,1146:105-152. 30. Technology Transfer Network (TTN) Air Quality System (AQS):[http://www.
epa.gov/ttn/airs/airsaqs/detaildata/downloadaqsdata.htm]. 31. Spatial Synoptic Classification:[http://sheridan.geog.kent.edu/ssc.html]. 32. Draxler RR, Hess GD:Description of the HYSPLIT_4 modeling system for
trajectories, dispersion and depositionSilver Spring, MD: NOAA Tech Memo ERL ARL-224; 1997, NTIS PB98-116593.
33. Hastie TJ:Generalized additive models.InStatistical Models in S.Edited by: JM Chambers and TJ Hastie. Wadsworth 1992:, Chapter 7 of.
34. Zanobetti A, Schwartz J:Air pollution and emergency admissions in Boston, MA.J Epidemiol Community Health2006,60:890-895. 35. Forastiere F, Stafoggia M, Tasco C, Picciotto S, Agabiti N, Cesaroni G,
Perucci CA:Socioeconomic status, particulate air pollution, and daily mortality: Differential exposure or differential susceptibility.Am J Ind Med
36. Wong TW, Wun YT, Yu TS, Tam W, Wong CM, Wong AHS:Air pollution and general practice consultations for respiratory illnesses.J Epidemiol Community Health2002,56:949-950.
37. Sheridan SC:North American weather-type frequency and teleconnection indices.Int J Climatol2003,23:21-45. 38. Bloomer BJ, Stehr J, Piety C, Salawitch R, Dickerson R:Observed
relationships of ozone air pollution with temperature and emissions.
Geophys Res Lett2009,36:L09803.
doi:10.1186/1476-069X-10-49
Cite this article as:Hannaet al.:Associations between ozone and morbidity using the Spatial Synoptic Classification system.Environmental Health201110:49.
Submit your next manuscript to BioMed Central and take full advantage of:
• Convenient online submission
• Thorough peer review
• No space constraints or color figure charges
• Immediate publication on acceptance
• Inclusion in PubMed, CAS, Scopus and Google Scholar
• Research which is freely available for redistribution