production with
Bacillus megaterium
:
development of advanced physiology and
bioprocess state estimation tools
David
et al.
R E S E A R C H
Open Access
Single cell analysis applied to antibody fragment
production with
Bacillus megaterium:
development of advanced physiology and
bioprocess state estimation tools
Florian David
1, Antje Berger
1, Robert Hänsch
2, Manfred Rohde
3and Ezequiel Franco-Lara
1*Abstract
Background:Single cell analysis for bioprocess monitoring is an important tool to gain deeper insights into particular cell behavior and population dynamics of production processes and can be very useful for discrimination of the real bottleneck between product biosynthesis and secretion, respectively.
Results:Here different dyes for viability estimation considering membrane potential (DiOC2(3), DiBAC4(3), DiOC6(3))
and cell integrity (DiBAC4(3)/PI, Syto9/PI) were successfully evaluated forBacillus megateriumcell characterization. It
was possible to establish an appropriate assay to measure the production intensities of single cells revealing certain product secretion dynamics. Methods were tested regarding their sensitivity by evaluating fluorescence surface density and fluorescent specific concentration in relation to the electronic cell volume. The assays established were applied at different stages of a bioprocess where the antibody fragment D1.3 scFv production and secretion byB. megateriumwas studied.
Conclusions:It was possible to distinguish between live, metabolic active, depolarized, dormant, and dead cells and to discriminate between high and low productive cells. The methods were shown to be suitable tools for process monitoring at single cell level allowing a better process understanding, increasing robustness and forming a firm basis for physiology-based analysis and optimization with the general application for bioprocess
development.
Background
Flow cytometry was originally established for characteriz-ing and sortcharacteriz-ing mammalian cells but won recently more and more importance applied at microbial processes [1,2], medical applications [3-5], dairy industry [6,7], alcoholic beverage production [8] and environmental and water systems [9]. In industrial production processes, sin-gle cell analysis may give high resolution insights into whole cell cultures concerning the cell status of viability, metabolic activity or even productivity [1,10].
Considering production processes in biotechnological industry, Process Analytical Technologies (PAT) for monitoring and evaluation of these processes is gaining
more and more importance [11]. Here one main point is to easily decide whether a process is stable and reli-able in production according to Food and Drug Admin-istration (FDA) standards. Its main idea is to move away from quasi-final, off-line product quality assessment to
“real time” strategies accompanied by online measure-ments of critical variables. To gain a better understand-ing and deeper insights into sunderstand-ingle cell performances, appropriate methods to characterize the physiology of a particular bacterial population have to be developed. Therefore adapted staining and measurement protocols considering the suitability of dyes, concentration and incubation times are necessary. Here it is important to verify if the used method is specific and sensitive enough to measure slight changes in the physiological parameter investigated leading to quantitative and not only to qualitative results. Especially for bioreactor * Correspondence: [email protected]
1
Institute of Biochemical Engineering, Technische Universität Braunschweig. Gausstrasse 17, 38106 Braunschweig, Germany
Full list of author information is available at the end of the article
cultivation with changing cell properties over time [12-14], the robustness and applicability of a method should be assured in order to consider it suitable as appropriate at line technique for process monitoring.
In the underlying case,B. megateriumproducing and secreting antibody fragment (ABF) D1.3 scFv, a lyso-zyme specific model antibody fragment, was in focus of investigations on single cell level for bioprocess control. B. megateriumis a Gram positive bacterium with high secretion capacities [15] and was shown to efficiently secrete proteins like penicillin G amidase [16], levansu-crase [17] and hydrolase from Thermobifida fusca[18]. Besides these recombinant proteins, antibody fragments also were proven to be effectively secreted into the supernatant [19]. Antibodies and antibody fragments are important tools in therapy and diagnostics [20-22]. The aim in using microbial cells to express them, is to have high effective, time and money saving production and secretion systems for a high value product. Thereby the most cost intensive downstream processing can be reduced regarding the separation time and may be rea-lized by one step purification methods, e.g. by Immobi-lized Metal Affinity Chromatography (IMAC) or Protein-L purification (©Pierce).
Recently, a minimal medium of high production and secretion capacities could be developed based on a genetic algorithm approach varying metal ion concentra-tions [23]. Based on this minimal medium, batch culti-vations were carried out and single cell analysis under controlled bioprocess conditions was performed to study the D1.3 scFv ABF production with B. megaterium at different stages of the cultivation.
For microbial bioprocess development it is most important to monitor cell stress response related to cell viability as such information determines the process effi-ciency [24]. This can be done by cell integrity and mem-brane potential (MP) measurements. The MP is primary coupled to the [H+] gradient of a cell, which is itself a direct parameter for the essential ATP generation capa-city. The underlying [H+] gradient is generated by the electron transport through the electron transport chain being related to NADH2 availability and is directly
asso-ciated with the metabolic activity of every single cell. Changes in MP are therefore the most sensitive indica-tors for culture status estimation whereas cell integrity measurements relate to more distinctive parameters like compromised cell membrane and cell wall structures.
A well established, accurate and high resolving method for measuring MPs is therefore an ideal instru-ment to either immediately adapt process conditions by means of process control or to abort batch processes in early stages. In addition, unstable MPs and development of heterogeneities can be regarded as key variables to deduce information about the process robustness itself,
assumed the methods used are sensitive enough to con-clude qualitative information.
Dyes for estimation of MP and cell integrity assays should be chosen very carefully as they may change cell properties themselves, only work on artificially created negative controls, e.g. heat treatment, and might there-fore not be suitable for at line bioprocess control.
For cell status estimation considering MP and cell integrity measurements, diverse approaches were fol-lowed. The underlying MP was estimated by evaluating different fluorescent probes of 3,3’ -diethyloxacarbocya-nine iodide (DiOC2(3)) [25],
3,30-dihexyloxacarbocya-nine iodide (DiOC6(3)) [24] and
bis-(1,3-dibutylbarbituric acid) trimethine oxonol (DiBAC4(3)
[26]). Here DiOC6(3) and DiOC2(3) are positively
charged lipophilic fluorescent probes binding to the membrane of actively growing cells and were success-fully used for Gram positive bacteria before [27]. DiBAC4(3) shows lipophilic properties, has an anionic
charge and therefore is not able to pass through polar-ized membranes of living bacteria. Instead it was shown to enter cells at membrane potential depletion and binds to positively charged proteins or less specifically to hydrophobic regions. For cell integrity measurements protocols using propidium iodide (PI) as potential probe for live dead/measurements [28] combined either with Syto9 or DiBAC4(3) were evaluated.
Additional process relevant methods are those focus-ing on discriminatfocus-ing information related to sfocus-ingle cell productivity, i.e. on developing reliable methods to dis-tinguish between high, low and non-producing cells. Here the general question might be answered if an underlying reduced productivity is due to less effective production in every single cell of a homogeneous popu-lation or may be due to differentiated cell popupopu-lation of producing and non-producing cells. Under normal cir-cumstances only average values are taken into account. Especially for high cell density cultivations, population analysis may lead to totally new insights into reduced specific productivities. By single cell analysis of secretion processes one may find out where the actual bottleneck of production and/or secretion is located.
Results
Dye validation
Different dyes used to estimate MP measurements like DiOC2(3), DiOC6(3), DiBAC4(3) were tested regarding
applicability with optimized concentration and incuba-tion times (Table 1). MPs were evaluated according to the maximal signal difference between carbonyl cyanide m-chlorophenylhydrazone (CCCP) treated cells from exponential phase (control for depolarized cells) [25] and exponential growing cells (polarized) at particular combinations of incubation times and applied dye con-centrations. The higher the difference the more precise is the final resolution of MP estimations. Here the resulting mean values of the specific fluorescence con-centrations (FL-FC) of particular fluorescence distribu-tions or regions were taken into account. In the underlying dye evaluation DiOC2(3) and DiOC6(3) as
cyanine dyes were shown to increasingly stain polarized cells whereas DiBAC4(3) instead stains predominantly
depolarized cells. At both cases, the particular difference in fluorescence intensity of exponential growing and depolarized (CCCP treated) cells was determined.
Interestingly, the signal intensity over time was stable for DiOC2(3) and DiOC6(3) staining (5 < t < 28
min-utes) whereas applying DiBAC4(3) the staining of
depo-larized cells decreased over incubation time and remained stable only at a short time period (2 < t < 4 minutes). This may be due to the different chemical properties of DiBAC4(3) as oxonol stain (negatively
charged) compared to DiOC2(3) and DiOC6(3), which
are carbocyanides (positively charged) [25]. Optimal dye concentrations and incubation times were tested in bior-eactor cultivations with multiple sample points through-out different growth phases. The effects on Side Scatter (SS) signal, respectively the granularity of the cell and electronic volume (EV), shown in table 1, were esti-mated from a bioreactor cultivation where the SS and EV values of all dyed samples were referred to non-dyed samples. Here a mean value of the particular difference and its standard deviation were determined. This direct
application revealed dye depended effects on single cell properties like the EV and SS. Although DiBAC4 (3) and
DiOC6(3) were most efficient in distinguishing polarized
from depolarized (CCCP treated) cells, the dyes showed no explicit application on bioreactor cultivations sam-ples. This may be due to the fact that both dyes change SS and EV signals up to 84% leading to non-significant measurements. On the contrary, DiOC2(3) could be
easily applied to estimate MP and was at the same time the dye with minimal influence on single cell properties like EV and SS. Therefore this dye was the ideal choose for MP estimation.
MP estimation
Figure 1 illustrates the reproducible measurements of DiOC2(3) stained cells evaluated according the FL3/FL1
ratio method described in material and method section. Cells from exponential phase were measured in compar-ison to dead, stationary and CCCP treated exponential phase cells, the late used as a control for depolarized cells. Here it is assumed that DiOC2(3) enters polarized
cells in such an amount, that the normally green fluor-escence dye showed increased red fluorfluor-escence proper-ties due to agglomeration of dye molecules [25]. Therefore an increased red fluorescence directly reflects the state of optimal membrane polarization and the enhanced metabolic activity of the corresponding cell population. By dividing through the green fluorescence value, normalization is done according to the cell size. Here fluorescence distributions from stationary phase cells are lying in the same area like CCCP treated cells reflecting the applicability of this staining method to estimate MPs. Moreover, the fluorescence distributions (FL3/FL1 ratios) of polarized and depolarized cells are clearly separated illustrating the high sensitivity level.
DiOC2(3) was chosen for the following experiments as
the optimal dye to estimate MPs with indicated concen-tration and incubation times guaranteeing sensitive and robust measurements. As no real MP has been esti-mated for B. megateriumso far, a calibration between
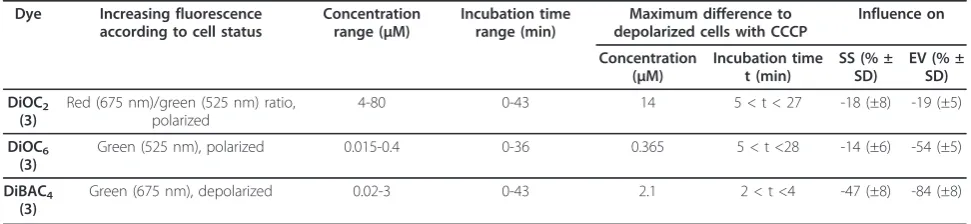
Table 1 Dye Screening for MP estimation
Dye Increasing fluorescence
according to cell status
Concentration range (μM)
Incubation time range (min)
Maximum difference to depolarized cells with CCCP
Influence on
Concentration (μM)
Incubation time t (min)
SS (% ± SD)
EV (% ± SD)
DiOC2
(3)
Red (675 nm)/green (525 nm) ratio, polarized
4-80 0-43 14 5 < t < 27 -18 (±8) -19 (±5)
DiOC6
(3)
Green (525 nm), polarized 0.015-0.4 0-36 0.365 5 < t <28 -14 (±6) -54 (±5)
DiBAC4
(3)
Green (675 nm), depolarized 0.02-3 0-43 2.1 2 < t <4 -47 (±8) -84 (±8)
the measured fluorescence intensities and the existing MPs was performed.
The calibration with different potassium ion concen-trations [K+] accompanied with valinomycin treatment was carried out to artificially simulate certain MPs according to the method of Novoet al. (1999). The cal-culated MPs were correlated to measured DiCO2(3)
stain intensities of B. megateriumcells producing anti-body fragment D1.3 scFv. From the applied [K+] con-centrations, the particular MP was determined using the Nernst equation and related to the measured FL3/FL1 ratio values of particular samples. Here, a strong linear correlation could be observed in a wide range with saturation values on both sides of polarized and depolarized cells showing a sigmoidal curve relationship (Figure 2). A maximal polarization of the membrane of -50 mV could be determined which may be due to the fact that ABF producing cells were measured (other cell
types showed MP of -120 mV, but without heterologous protein production and secretion [29]). The relatively low MP calculated might also be due to a toxic effect of the dye itself as no distinctive hyperpolarization at low [K+] concentrations could be measured under valinomy-cin treatment. Despite this, the observed linear correla-tion clearly shows that the staining intensity of DiOC2
(3) is directly correlated to the MP created by the applied [K+] concentrations which again highlights the sensitivity and applicability of the method.
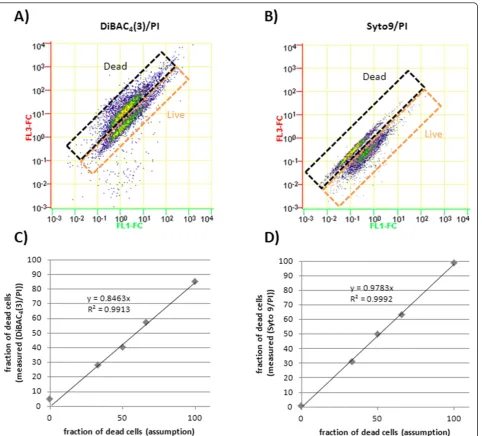
Cell integrity estimation
Apart from MP estimation, the cell integrity is also an important parameter for bioprocess evaluation especially during long term starvation periods. Here the differentia-tion between dormant depolarized cells and dead cells indicated by compromised cell membrane is most desir-able. Dye combinations of Syto9/PI and DiBAC4(3)/PI
were tested onB. megateriumcells which were heat killed and/or taken from exponential growth phase (Figure 3). Different mixtures of these cells were investigated and could be directly correlated to the resulting clusters repre-senting the differentiated populations. Figure 3 clearly shows the applicability of both dye combinations at corre-lated data. Here the fluorescence concentration was con-sidered to ensure accurate measurements of florescence intensity related to the particular cell volume.
At both dye combinations an increase of red fluores-cence in dead cells was expected as PI should be able to enter the cells and bind to nucleic acids, thereby increasing in fluorescence intensity. Heat killed cells were expected to show a higher green fluorescent due to DiBAC4(3) staining related to the depolarized MP.
However at both measurements PI may have led to a quenching of green fluorescence of Syto9 and DiBAC4
(3), respectively. The predominant reduction of green fluorescence of heat killed cells at the Syto9/PI assay may also be related to the displacement of Syto9 by PI, which enters the cells in this non vital cell status com-peting for the same binding at nucleic acid sites.
Production intensity
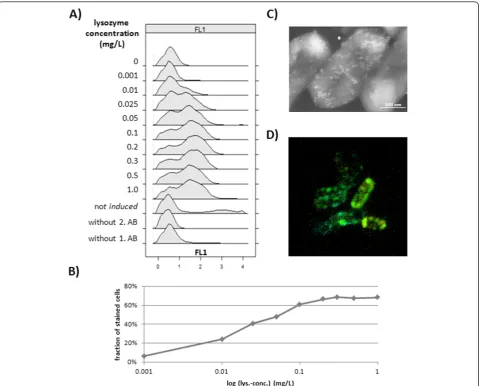
Especially in biotechnology applications concerning het-erologous protein production the specific productivity at single cell level is an important process variable. There-fore an assay to measure this productivity status and distinguish between ABF D1.3 scFv producing/secreting and non-producing/non-secreting B. megateriumcells was developed. By first fixing cells with paraformalde-hyde, the ABF D1.3 scFv secreted through the cell mem-brane sticks to the bacterial cell surface and becomes measurable by detection antibodies. In this case a first anti-penta His antibody was used to detect the His-tag of the secreted antibody fragment, and a second anti Figure 1 Membrane Potential (MP) estimation. MP
measurements ofB. megateriumcells producing antibody fragment scFv D1.3. DiOC2(3) staining and subsequent FL3/FL1 ratio analysis
regarding different growth stages (exponential and stationary) and treatment with heat and CCCP as negative controls.
Figure 2MP calibration. Calibration of MP related to DiOC2(3)
mouse antibody coupled with the fluorochrome Alexa Fluor 488 was used to specific label ABF D1.3 scFv pro-ducing cells and make them observable for flow cytome-try and CLSM analysis. As shown in figure 4A, the lysozyme treatment is indispensable to make the ABF fragment reachable for detection antibodies. In this experimental screening with different lysozyme concen-trations not all cells were secreting antibody fragments, a phenomenon which is clearly shown by the two over-lapping distributions. These distributions even stay clearly distinguishable applying high lysozyme concen-trations, where a saturation of the fraction of stained cells was reached (Figure 4B). Controls were carried out
to check for unspecific binding of first or second detec-tion antibodies which were at least negligible and further reduced by additional wash steps. CLSM was used to illustrate the special labeling of ABF D1.3 scFv producing cells (Figure 4D). Here secreted ABFs were detected by detection antibodies coupled to the fluoro-chrome Alexa Fluor 488 in the space between cell mem-brane and cell wall indicated by green ring structures. In addition, Immuno field emission scanning electron microscopy (Immuno-FESEM) was used to detect cer-tain regions of secretion on the cell surface in detail (Figure 4C). Here a second antibody coupled to gold particles was used to make these regions visible. Both Figure 3Viability estimation. Live/dead test ofB. megateriumcells producing ABF D1.3 scFv with different dye combinations of DiBAC4(3)/PI
and Syto9/PI.A)DiBAC4(3)/PI stain: 50% dead cell, 50% live cell mixture,B)Syto9/PI stain: 50% dead cell, 50% live cell mixture.C),D)Calibration
methods reveal cells with higher labeling or less labeling giving hints on production and secretion heterogeneities within the bacterial population.
At following investigations of production intensities of B. megateriumcells producing ABF D1.3 scFv, two dif-ferent lysozyme concentrations of first 0.5 mg/L and second 0.025 mg/L were used to check for ABF accu-mulated at the cytoplasmatic membrane and within the cell wall structures as well. Based on the microscopy pictures evidence, the used detection antibodies can be considered as surface markers and, as such, a quantita-tive fluorescence surface density (FSD) can be estimated from the raw data of EV and FL1 values.
The interpretation of estimated FSD is done by differ-entiated region analysis. As shown in figure 5, two
zones were clearly defined. The first region includes all measured cells whereas the second region includes only cells which are labeled with detection antibodies and therefore have an ABF producing status. Taking the ratio of the particular fractions of cells and weightening this with the mean fluorescence value of the second region a quatitative parameter which stands for the pro-duction intensity (Prod_Inten) of the whole cell popula-tion can be used as bioprocess monitor parameter (equation 1).
Advanced bioprocess monitoring
secreting ABF D1.3 scFv were applied on samples of a bioreactor cultivation showing the potential of at-line flow cytometric data analysis on single cell level for bio-process state estimation.
As shown in figure 6A, B the estimated MP by stain-ing with DiOC2(3) could be clearly related to different
growth phases of the B. megateriumcultivation. Espe-cially during the exponential growth phase the polariza-tion status of the cells was at maximum indicated by the FL3/FL1 ratio analysis shown. As soon as fructose as carbon source was depleted, the dissolved oxygen (DO) concentration immediately increased (Figure 6B) accom-panied with a parallel remarkable decrease in FL3/FL1 ratio directly reflecting the reduced MP of the cells. The MP further collapses in the following 10 hours of starva-tion phase to a constant value corresponding to cells in stationary phase as shown before (Figure 1).
Interestingly the measured FL3/FL1 ratio values and corresponding MPs (Figure 2) showed a linear correla-tion with the specific CO2 production (qCO2) and O2
consumption rates (qO2) (Figure 7). This illustrates a
direct relation between cell MP and microbial metabolic activity represented by CO2 production and O2
con-sumption. The correlation holds for any growth phase as the proportionality constant is equal for batch qO2
and qCO2variables.
The same bioprocess was investigated towards the cell integrity of B. megaterium cells. Under these circum-stances, only the live/dead test using DiBAC4(3)/PI
seemed to be applicable or at least sensitive enough to reveal differences in particular cell populations especially in the late stationary phase. It also has to be taken into
account that cell characteristics of unstained cells like SS and EV were remarkably affected throughout the cul-tivation (Figure 8B). Especially the EV was more than halved when the culture developed from exponential to stationary phase. Therefore, normalization by EV values at calculating fluorescent concentration (FL-FC) is very important to interpret fluorescence data sets [30]. Figure 5Definition: Production Intensity. FL1 Fluorescent Surface
Density (FL1-FSD) distributions combined from FL1 and Electronic Volume (EV) data sets. Direct comparison of ABF D1.3 scFv producing (blue) and non- producing cells (grey). Different regions (1, 2) setting to calculate production/secretion intensities ofB. megateriumcells as shown in formula 1.
Figure 6 Bioprocess monitoring: MP estimation. MP investigations ofB. megateriumcells producing/secreting ABF scFv D1.3 in a bioreactor cultivation (15 g/L fructose, DO>20%, 1L).A)
DiOC2(3) stain of cells analyzed with ratio analysis of FL3/FL1 values,
related to cell dry weight measurements,B)Dissolved oxygen (DO), fructose concentration and resulting growth phases.
Figure 7Bioprocess monitoring: MP-qCO2,qO2correlation. Correlation between specific CO2production (qCO2), O2
consumption rate (qO2) with MP measurement deduced from MP
Region analysis of dot plots (FL1-FC vs. FL3-FC) was done and percentages of cells in particular regions were determined for all sample points (Figure 8A). Here an increased percentage of cells with higher red fluores-cence were partially measured in exponential as well as in stationary phase. These PI positive cells in the expo-nential phase are probably related to loosen cell wall structures of fast dividing cells [28]. In the stationary phase cell wall structures were reduced and more permeable caused by enhanced autolysin activity [19,31,32].
Finally in the last two sample points a separation into different populations became observable (Figure 8C). Original homogenous populations changed into two fractions and may be related to a population dynamic behavior of long term starvation cultures. Therefore cells from the bioreactor cultivation up to 6 h after reaching the stationary phase should be considered more as dormant or partially damaged (PI permeable)
than as totally dead cells although they show an increased PI staining towards long term starvation.
The underlying bioprocess was also checked for pro-duction of ABF D1.3 scFv regarding the efficiency of secretion of single cells and over all yield considerations. Therefore the previously defined production intensity was determined via fluorescence labeling and the func-tionally secreted and folded ABF D1.3 scFv concentra-tions were measured in the supernatant by ELISA assay. These absolute concentrations of ABF were normalized by the measured cell dry weight (yield coefficient (YP/
X)) and both calculated parameters“production
inten-sity”and“YP/X“were directly compared (Figure 9). To
get an idea of secretion efficiency of ABF through the cell wall, different lysozyme concentrations were applied after cell fixation. By using a high concentration of lyso-zyme it was assumed to directly reflect the amount of ABF accumulated behind the cell membrane. At low concentrations of lysozyme, ABF within the cell wall Figure 8Bioprocess monitoring: Viability and physiology. Viability investigations of a bioreactor cultivation ofB. megateriumcells producing/ secreting ABF scFv D1.3 (15 g/L fructose, DO>20%, 1L).A)DiBAC4(3)/PI stain of samples, percentages of PI+ and PI- cells according gate analysis
structures might be detected due to partially degradation of cell wall components.
In the investigated batch process, different phases of production could be clearly distinguished. The first phase right after induction showed a remarkably increase in the production intensity at both 0.025 g/L and 0.5 g/L lysozyme treatment (Figure 9). The product yield remains low and has carefully to be interpreted due to low concentrations of biomass and secreted ABF concentrations in the detection limit. At exponential growth both the production intensity as well as the pro-duct yield remain constant which is related to growth coupled production behavior. Here the increasing of biomass directly favors higher concentrations of func-tional folded ABF in the supernatant in the same range
(Figure 9B). A detailed view reveals higher production intensities in the late phase of exponential growth. Of particular importance is the time shift observed in this phenomenon for the different lysozyme treatments. At lower lysozyme concentrations the shift to higher pro-duction intensities is 1 h later compared to lysozyme treatment with higher concentration. This may be explained by a previous accumulation of ABF behind the membrane followed by at least 1 h lasting release through the wall. This delay of the secretion also becomes obvious in the stationary phase. Here a sudden increase in production intensity of both lysozyme treat-ment approaches is directly followed by a delayed increase in the production yield. A definite decrease in production intensity estimated through single cell Figure 9Bioprocess monitoring: Productivity and Production Intensity. Product yield (YP/X) and Production Intensity measurements ofB.
megateriumcells producing/secreting ABF scFv D1.3 in a bioreactor cultivation (15 g/L fructose, DO>20%, 1L).A)Growth phase dependent product yield (YP/X) and production intensity of ABF D1.3 scFv production and secretion. Production intensities were determined with applying
analysis was shown in the late stationary phase, which is probably related to starvation and cell inactivation. However the antibody fragment concentration as well as the biomass concentration remains constant.
As both time courses of the product yield Y P/X and
the production intensity are coupled, it can be con-cluded that the secretion process of ABF and the pro-duct biosynthesis process inside the cell is directly related to the final secretion and functional appearance outside the cell in the supernatant. Interestingly the measured production intensities of particular lysozyme treatments show more distinctive differences at phases of higher production. This stresses that the cell wall itself is a barrier which has to be overcome by secreted ABF. Therefore, especially at states of high production, the cell wall may be regarded as a bottleneck concerning the observed overall process productivity, since it delays the product transport increasing the secretion time at single cell level.
Through analysis of MP and production intensities no population heterogeneities within the different growth and production phases became observable. This is most probably due to well controlled bioprocess with no oxy-gen limitation, temperature and pH-control with ideal mixing conditions.
Discussion
Single cell analysis ofB. megateriumcells producing and secreting ABF was shown to be feasible in giving detailed insights and better understanding of the under-lying bioprocess. Established viability and production intensity assays revealed different cell states of active, non-active, dormant, producing, non-producing and dead cells.
It should be stressed that protocols and assays have to be basically developed for the particular organisms which are in the current focus of investigation. For MP estimation different dyes were evaluated in shaking flask experiments and tested in a bioreactor cultivation. Although DiBAC4(3) and DiOC6(3) were capable to
measure MP in calibration experiments they were found not to be effective for physiological cell characterization at bioreactor cultivations. This may be due to changes in cell properties related to cell wall and membrane structures caused by an increased shear stress in bior-eactors compared to shaking flask experiments. Cell wall and membrane structures may influence the characteris-tics of dye binding [27]. However, DiOC2(3) was found
to be most applicable in describing the status of cell membrane polarization under bioreactor culture condi-tions as well and, in contrast to other dyes, caused less changes in cell properties themselves (Table 1). This better applicability may be related to the higher concen-trations used for DiOC2(3) based on saturation and
agglomeration at polarized membranes [27] probably resulting in a more robust assay.
Evaluation of cell viability was done both with DiBAC4
(3)/PI and Syto9/PI combinations, but only DiBAC4(3)/
PI was sensitive enough to reveal differences and even population dynamics at late stages of starvation of the bioreactor cultivation. When using PI as an indicator for cell integrity it has to be taken into account, that it not only stains dead cells but may label highly reproductive cells as well [28] and probably due to its quenching properties, PI reduces the Syto 9 and DiBAC4(3) green
fluorescence intensity. Significant variability in uptake patterns of nucleic acid binding dyes by Gram positive bacteria was shown before [33].
Comparing both at line methods for cell status evalua-tion, it becomes clearly obvious, that MP measurements by DiOC2(3) are by far more sensitive in describing cell
properties than the presented assays for cell integrity measurements. The latter are more accurate in measur-ing extreme effects like cell lysis after heat treatment or long term starvation. As both parameters of polarization status and viability are important, they should be moni-tored simultaneously at bioreactor cultivations and are most helpful in describing population dynamics and cell physiology. Especially in deciding whether a process is operating in a stable condition or not, the MP estima-tion is an ideal sensitive parameter to adapt process conditions or even abort the cultivation at early stage when heterogeneities become present or critical physio-logical values are reached. In the area of omics techni-ques and fast sampling, the insurance that a homogeneous population is characterized is also a very important issue [34] which can be quantitatively ana-lyzed by at line MP measurements. The implementation of cytomics and proteomics technique regarding bacter-ial cells was recently proven to be successful [35].
size is done per event, so that the normalization actually represents fluorescence per cell or cell conglomerate no matter how many (single or chains) or how big these cells (single or chains) are [30].
It was shown, that the developed method for discrimi-nating between producing and non-producing cells was feasible to characterize the production status bioreactor cultivations and gives not only qualitative, but also quantitative estimations of production intensities. This differentiation is the main pre-condition for population analysis under limiting process conditions and high cell density cultivations, where heterogeneities are more likely to occur.
The used Alexa Dye 488 is a bright photostable conju-gate being most applicable in measuring reproducible and reliable results with a high resolution [40]. The established method of determining production intensi-ties of single cells also revealed certain dynamics within the process of secretion through the membrane coupled SEC pathway [41] and subsequent release from the cell wall structures. Here a certain delay in secretion became remarkably obvious. To determine secretion rates of yeast cells other methods relying on artificially created affinity matrices have been developed before [42,43]. In this case, the developed method is more simple and robust, based on fixation and lysozyme treatment of B. megateriumcells. Although cells have to be considered as dead after paraformaldehyde treatment they could be sorted and are suitable for transcriptomic or proteomic analyses [35,44]. Even plasmid banks of B. megaterium could be used for screening for high producers similar to library screens of scFv libraries [45,46].
Cell integrity, MP and production intensity measure-ments revealed clear changes in the particular cell status at the transition from exponential to stationary phase. Here the question arises if the depolarization of cells in the stationary phase accompanied with decreased mem-brane integrity indicated by slightly increased PI staining may be directly related to the gain in production and secretion of antibody fragment D1.3 scFv. It was shown before that decreasing the polarization status of a cell may be directly linked to a better secretion performance of proteins due to changes in the cell structure based on higher autolysin activity, which depends on the cell wall charge distribution [32]. Therefore MP estimation may be a related parameter to production and secretion of ABF D1.3 scFv and therefore could be used for further process control.
By the analysis done it was discarded that cells in the early stationary phase 2-3h after fructose depletion should be considered as dead and, therefore, lyse and release ABF in a high amount. Moreover, entirely depo-larized cells in a dormant status are totally recovered by fructose addition after starving periods of up to 4 hours
(results not shown). Nevertheless measured FL3-FC values of PI treated samples should be treated very care-fully. A relatively high red fluorescence of cells in the exponential phase may be related for instance to porose cell wall or cell membrane structure of fast dividing cells [28].
Conclusions
Microorganisms in industrial processes are considered conventionally as uniform populations and therefore are thought to be sufficiently described by average values. Especially for high cell densities reached at fed batch processes it was shown that this is not true [13,47-49]. With E. coli cultivations even a reduction of up to 20% of cell viability was observed during the fed-batch processes [50]. Therefore it’s most desirable to have reliable methods available to adequately moni-tor bioprocesses for production intensities of single cells and reveal population dynamics, e.g. under sub-strate limited conditions or high cell densities. Particu-larly in large scale reactors heterogeneities are more common due to concentration gradients of oxygen or substrate [51]. Here, the estimation of heterogeneities would directly reflect the quality of a bioprocess or even enable special reactor design and/or particular feeding strategies.
Further application of flow cytometry in the future may be found in online measurements and even online control of bioprocesses as it was shown to be applicable in fed batch processes for mammalian cells [52]. In combination with appropriate models for population dynamics, flow cytometry may be realized to establish an online optimization process to most effective, robust and productive bioprocesses.
Methods
Cultivation conditions
All chemicals were purchased from Sigma (Steinheim, Germany), Merck (Darmstadt, Germany) or Roth (Karls-ruhe, Germany) and are of analytical grade. In all experiments the B. megateriumstrain YYBm1 [16] car-rying the plasmid pEJBmD1.3 scFv was used [19]. For the preculture and main culture of B. megaterium a minimal medium was applied [23]. It contains fructose as a sole carbon source supplemented with 3.52 g L-1 KH2PO4, 5.297 g L-1Na2HPO4, 3 g L-1MgSO4 × 7 H2
O, 25 g L-1 (NH4)2SO4, 0.312 g L-1 MnCl2 × 4 H2O,
0.0954 g L-1 CaCl2 × 2 H2O, 5.5 mg L-1 FeSO4 × 7
H2O, 21.6 mg L-1(NH4)6Mo7O24 × 4 H2O, 6.2 mg L-1
CoCl2, 16μg L-1CuSO4× 5H2O, 155μg L-1 H3BO3, 15 μg L-1 ZnSO4 × 7H2O and 10 mg L-1tetracycline. For
All cultivations in shaking flasks were done at 130 rpm and 37°C (50 mm shaking diameter, CERTOMAT® BS-1, B. Braun Biotech International, Melsungen, Ger-many).B. megateriumwas stored at -80°C in a 50% gly-cerol solution in cryo vials. For preparing cryo cultures B. megaterium was cultivated in 10 mL minimal med-ium at 37°C for 12 h. 100 mL minimal medmed-ium in a 1000 mL shaking flask without baffles were inoculated with this cell suspension adjusting to an OD578 nmof
0.1. In the exponential phase (OD578 nm= 3) 10 mL of
cell suspension were mixed with 10 mL glycerol (99%) and immediately frozen in 0.5 ml aliquots in liquid nitrogen and stored at -80°C. For pre-cultures, 100μL of cryo culture were used as inoculum for 10 mL of minimal medium and cultivated for 12 hours. As second pre-culture for bioreactor experiments, 100 mL medium was inoculated from first pre-culture adjusting to an OD578 nmof 0.1 and cultivated for additional 12 hours.
Main cultivation was carried out in a 3.7 L bioreactor (Bioengineering, Wald, Switzerland). For the batch experiment 1 L of minimal medium was inoculated with a pre-culture volume adjusting to an OD578 nm of 0.1.
The cultivation was carried out under constant tempera-ture at 37°C and controlled at pH 6.3. Dissolved oxygen (DO) concentration was controlled above a value of 20% saturation, using a stepwise cascade control, increasing alternately agitation and aeration rate. Induction was done by an appropriate amount of a 100 g L-1 xylose solution 1.5 hours after inoculation to reach a final con-centration of 5 g L-1.
Gas analysis
Carbon dioxide and oxygen in the exhaust gas were measured with gas sensors (Blue Sense, Herten, Ger-many) and the corresponding specific oxygen uptake rate (qO2) and specific carbon dioxide production rate
(qCO2) were calculated for all cultivations considering
nitrogen as inert gas.
Sampling of cultivation supernatant
Samples were taken for biomass, xylose, fructose con-centration measurements and single cell analysis. Cell suspension (2 mL) was centrifuged at 15.7 g, 5 min, 4°C (5415 R Eppendorf, Hamburg, Germany). For MP mea-surement the centrifugation was done at 3.3 g and cells were immediately stained and measured after taking the sample. Supernatant was frozen at -20°C and cell pellet was stored at 4°C for production intensity assay. Super-natant was used for determining sugar concentration by HPLC analysis and for quantitative ELISA test as described below. Cell pellets were used for determining production intensities, cell dry weight concentration (CDW) and Electron Microscopy (EM).
Analytics of substrates, products and biomass
Sugars (xylose, fructose) were quantified by HPLC (Hita-chi Elite LaChrom, Krefeld, Germany) equipped with a Metacarb 87 C column (Varian, Palo Alto, CA, USA) as stationary phase and Millipore H2O as mobile phase at
0.6 mL min-1and 85°C. Detection was performed using an IR detector.
For preparation of samples 2 mL of the cultivation supernatant was sucked into a 2 mL plastic syringe and directly squeezed through a sterile filter (polyvinylidene fluoride, 0.2μm pore size, Roth, Karlsruhe, Germany). For protein precipitation 20μL mL-1 0.5 M H2SO4 were
added and samples were frozen at -20°C. After thawing and centrifuging at 15.7 g, 4°C, 5 min (5415 R Eppen-dorf, Hamburg, Germany) 500 μL of supernatant was filled in HPLC vials and analyzed.
Cell concentration was determined as optical density at a wavelength of 578 nm using a Novespec 3 Photo-meter (Amersham Bioscience, Freiburg, Germany). CDW was measured via gravimetric analysis. Here bio-mass pellets of 15 mL culture volume (triplicats) were washed twice with distilled water to remove salts and afterwards dried at 80°C for 48h.
ELISA
ELISA was carried out according to Jordan et al. (2007). A quantitative determination of functional folded anti-body fragment D1.3 scFv was done by measuring a cali-bration standard of purified ABF D1.3 scFv on each 96 well plate. The standard was purified from supernatant with a protein-L (©Pierce) column and quantified by densiotometric analysis of corresponding SDS gel bands related to a D1.3 scFv standard. Samples were measured in three dilutions (1:3) and quantified according to the standard samples via logit-log plot analysis.
Production intensity calculation
The production intensity was calculated according to single cell measurements of Alexa Fluor 488 labeled cells based on region analysis (Figure 5) and the formula below:
Prod Iten =% cells reg2
% cells reg1×mean FL1 (reg2) (1)
Flow cytometry
was detected through a 670 nm long pass filter. Both fluorescence values were detected in parallel using a dichroic long pass filter for splitting. Sheath flow rate was 4.17 μl min-1, sample rate never exceeded over 600 events s-1 and 10,000 counts were done. Signals were logarithmically amplified and photomultiplier (PMT) settings were adjusted to particular staining methods. The EV (Coulter Counter Principle, Cell Lab QuantaTM SC MPL) was used to determine cell fluorescence con-centration (FL-FC: FL-Channel/(Volume Channel)) and cell fluorescence surface density (FL-FSD: FL-Channel/ ((Volume Channel) ^ (2/3)).
Dye screening for MP estimation
The different dyes DiOC2(3), DiOC6(3) and DiBAC4 (3)
were tested according their suitability for MP estima-tion. Therefore 1 mL of B. megateriumcells of particu-lar samples with a concentration of 2 × 10⁶ cells mL-1 were centrifuged (3.3 g, room temperature) and resus-pended in 1 mL staining puffer (0.06 M Na2HPO4, 0.06
M NaH2PO4, 5 mM KCl, 130 mM NaCl, 1.3 mM CaCl2,
0.5 mM MgCl2adjusted to a pH 7 with NaOH, steril
fil-tered). 10 μl of particular dye working solution was added (DiOC2(3), DiOC6(3) in 50%/50% -DMSO/H2O,
DiBAC4(3) in 100% DMSO). As a negative control 10μl
CCCP solution (1.5 mM in DMSO) was added to depo-larize cells. All dyes and CCCP were purchased from Invitrogen (Molecular Probes, USA).
DiOC2(3) ratio analysis
Ratio analysis of DiOC2(3) stain was done according
Novo et al. 1999 and was used to estimate MP.
MP = log
1032 ×
FL3 (red fluorescence) FL1 (green fluorescence)
(2)
Polarized cells show an increased staining property with the actually green fluorescent dye leading to a dye accumulation with red fluorescent properties [29].
Membrane potential calibration
MPs were artificially simulated by the application of the potassium ionophore valinomycin in the presence of dif-ferent external potassium concentrations [25]. At parti-cular potassium concentrations, the resulting FL3/FL1 ratios of DiOC2(3) stained cells were determined.
Further MP were calculated based on the Nernst Equa-tion (ΔE= - 61.54 mV log (cinside/coutside)) where
potas-sium concentration inside the cells was assumed to be constant at 243.75 mM. Potassium concentrations out-side the cells were changing according to experimental setup from 300 mM to 0 mM where the overall molarity was kept constant at 300 mM by adding an appropriate amount of sodium. Staining was done in buffer of 0.06
M Na2HPO4, 0.06 M NaH2PO4, 130 mM NaCl, 1.3 mM
CaCl2 and 0.5 mM MgCl2 adjusted to a pH 7 with
NaOH, steril filtered and addition of the appropriate amount of NaCl and KCl.
Single cell production intensity assay
After sampling a cell pellet of about 107cells, cells were re-suspended in 200 μL PBS-T (PBS (8.5 g L-1 NaCl, 1.34 g L-1Na2HPO4 × 2H2O, 0.345 g L-1 NaH2PO4 ×
2H2O), 0.05% Tween 20) and 600 μL of 4%
paraformal-dehyd was added. Cells were fixed for 10 minutes at room temperature. After centrifugation at 15.7 g for 5 min at 4°C the cell pellet was resuspended in 900 μL PBS-T and 100μL of particular lysozyme stock solution (0.25 mg mL-1 to 5 mg mL-1 in PBS-T) was added. After incubation for 10 min at room temperature and centrifugation at 15.7 g, 5 min, 4°C cells were washed once with 500μL PBS-T to reduce unspecific binding. Cells were incubated with first detection antibody mouse-anti-penta-His (100μL, 1:100 in PBS-T, Quiagen 34660) at RT for 1.5 h and afterwards washed twice with 500μL PBS-T. Second Alexa Fluor coupled anti-body (100μL, 1:50, Alexa Fluor 488 ® goat anti-mouse IgG (H+L) highly cross-adsorbed 2 mg mL-1 Cat.No. A-11029 Invitrogen, USA) was added and incubated for 1 h at 4°C in the dark. Cells were washed once with 500
μL PBS-T and flowcytometric analysis was performed using the green fluorescence channel. Negative controls were established for cells treated with no lysozyme, not induced cells and leaving of first or second detection antibody.
Viability assay
For distinguishing between live and dead cells two viabi-lity assays were evaluated. Here Syto9/PI (LIVE/DEAD Baclight Kit, Invitrogen, USA) and DiBAC4(3)/PI were
used for different mixtures of live (exp. phase) and heat treated cells (80°C, 10 min). As described before, 10 μL of particular staining working solutions were added to 2 × 10⁶ cells in 1 mL staining puffer (PI: 1.5 mM, Syto9: 500 μM, DiBAC4(3): 0.21 mM). Staining patterns in
green and red fluorescence were subsequently analyzed by flow cytometry.
Immuno field emission scanning electron microscopy (Immuno-FESEM)
air-dried. Samples were then mounted onto conductive carbon adhesive tabs on specimen mounts. Samples were examined in a Zeiss DSM982 Gemini field emission scan-ning electron microscope (Carl Zeiss, Germany) at an acceleration voltage of 5 kV using the Everhart-Thornley secondary electron detector (SE-detector) and the built-in built-inlens Se-detector built-in a 75:25 ratio. Images were recorded onto MO-disk and contrast and brightness was adjusted with Adobe Photoshop CS4.
Confocal laser scanning microscopy (CLSM)
The CLSM technique was applied to directly monitor bound Alexa Fluor detection antibodies at the cell sur-face. Here cells were resuspended in PBS and investi-gated with CLSM technique. Fluorescence was analyzed with a confocal laser scanning microscope CLSM-510META connected to an Axiovert 200 M (Carl Zeiss, Germany) with laser excitation of 488 nm, HFT UV/488 and BP 505-530 for GFP fluorescence. All images were processed with LSM Image Browser Release 4.2 (Carl Zeiss, Germany).
Abbreviations
ΔE: Membrane Potential (Nernst Equation); AB: antibody; ABF: Antibody fragment; ATP: Adenosine-5’-triphosphate; CCCP: carbonyl cyanide m-chlorophenylhydrazone; CDW: Cell Dry Weight; cinside: potassium
concentration inside the cells; CLSM: Confocal Laser Scanning Microscopy; coutside:potassium concentration outside the cells; DFG: Deutsche
Forschungsgemeinschaft; DiBAC4(3): Bis - (1,3 - dibutylbarbituric acid)
trimethine oxonol; DiOC2(3): 3,3’- Diethyloxacarbocyanine iodide; DiOC6:
(3,3’-dihexyloxacarbocyanine iodide); DMSO: Dimethyl sulfoxid; DO: dissolved oxygen; ELISA: Enzyme-linked immunosorbent assay; EV: Electronic Volume; FC: Fluorescence Concentration; FESEM: Field Emission Scanning Electron Microscopy; FDA: Food and Drug Administration; FL1: Fluorescence 1 (Green); FL3: Fluorescence 3 (Red); FSD: Fluorescence Surface Density; HPLC: High Performance Liquid Chromatography; HZI: Helmholz Zentrum für Infektionsforschung; IMAC: Immuno Metall Affinity Chromatography; MP: Membrane Potential; NADH2: Nicotinamide Adenine Dinucleotide; OD:
Optical Density; PAT: Process Analytical Technologies; PBS: Phosphate Buffered Saline; PBS-T: Phosphate Buffered Saline Tween; PFA: Paraformaldehyde; PHB: Polyhydroxybutyrat; PI: Propidium Iodide; PMT: Photomultiplier; Prod_Inten: Production Intensity; qCO2: specific CO2
production rate; qO2: specific O2consumption rate; scFv: single-chain
variable fragment; SEC: secretion; SS: Side Scatter;
Acknowledgements
This work was carried out as part of the DFG-Sonderforschungsbereich 578 and the authors gratefully acknowledge financial support granted by the Deutsche Forschungsgemeinschaft. Miriam Steinwand, Dr. Michael Hust and Professor Stefan Dübel are gratefully acknowledged for supporting the work in providing the strain and sharing methods.
Author details 1
Institute of Biochemical Engineering, Technische Universität Braunschweig. Gausstrasse 17, 38106 Braunschweig, Germany.2Botanical Institute,
Technische Universität Braunschweig. Humboldtstraße 1, 38106 Braunschweig, Germany.3Helmholtz Centre for Infection Research
Inhoffenstraße 7, 38124 Braunschweig, Germany.
Authors’contributions
FD designed the study and experiments. Experiments were carried out and discussed by FD and AB. EFL coordinated the study, discussed data and helped to draft the manuscript. All authors read and approved the final
manuscript. RH did the CLSM pictures and MR took the Immuno-FESEM images.
Competing interests
The authors declare that they have no competing interests.
Received: 2 February 2011 Accepted: 15 April 2011 Published: 15 April 2011
References
1. Müller S, Harms H, Bley T:Origin and analysis of microbial population heterogeneity in bioprocesses.Current opinion in biotechnology2010, 21:100-113.
2. Reis A, da Silva TL, Kent CA, Kosseva M, Roseiro JC, Hewitt CJ:Monitoring population dynamics of the thermophilic Bacillus licheniformis CCMI 1034 in batch and continuous cultures using multi-parameter flow cytometry.Journal of biotechnology2005,115:199-210.
3. Walberg M, Gaustad P, Steen HB:Rapid flow cytometric assessment of mecillinam and ampicillin bacterial susceptibility.Journal of Antimicrobial Chemotherapy1996,37:1063.
4. Gauthier C, St-Pierre Y, Villemur R:Rapid antimicrobial susceptibility testing of urinary tract isolates and samples by flow cytometry.Journal of medical microbiology2002,51:192.
5. Suller MTE, Lloyd D:Fluorescence monitoring of antibiotic-induced bacterial damage using flow cytometry.Cytometry Part A1999, 35:235-241.
6. Bunthof CJ, Bloemen K, Breeuwer P, Rombouts FM, Abee T:Flow cytometric assessment of viability of lactic acid bacteria.Applied and environmental microbiology2001,67:2326.
7. Rault A, Béal C, Ghorbal S, Ogier JC, Bouix M:Multiparametric flow cytometry allows rapid assessment and comparison of lactic acid bacteria viability after freezing and during frozen storage.Cryobiology
2007,55:35-43.
8. Boyd AR, Gunasekera TS, Attfield PV, Simic K, Vincent SF, Veal DA:A flow-cytometric method for determination of yeast viability and cell number in a brewery.FEMS yeast research2003,3:11-16.
9. Czechowska K, Johnson DR, van der Meer JR:Use of flow cytometric methods for single-cell analysis in environmental microbiology.Current opinion in microbiology2008,11:205-212.
10. Hewitt CJ, Nebe-Von-Caron G:An industrial application of multiparameter flow cytometry: assessment of cell physiological state and its application to the study of microbial fermentations.Cytometry Part A2001, 44:179-187.
11. Gernaey KV, Woodley JM, Sin G:Introducing mechanistic models in Process Analytical Technology education.Biotechnology Journal2009, 4:593-599.
12. Steen HB, Boye E, Skarstad K, Bloom B, Godal T, Mustafa S:Applications of flow cytometry on bacteria: cell cycle kinetics, drug effects, and quantitation of antibody binding.Cytometry Part A1982,2:249-257. 13. Looser V, Hammes F, Keller M, Berney M, Kovar K, Egli T:Flow-cytometric
detection of changes in the physiological state of E. coli expressing a heterologous membrane protein during carbon-limited fedbatch cultivation.Biotechnology and bioengineering2005,92:69-78.
14. Nebe-von Caron G, Stephens B:Assessment of bacterial viability status by flow cytometry and single cell sorting.Journal of applied microbiology
1998,84:988-998.
15. Vary PS:Plasmidless strain of Bacillus megaterium QM B1551.Google Patents; 1991.
16. Yang Y, Biedendieck R, Wang W, Gamer M, Malten M, Jahn D, Deckwer WD: High yield recombinant penicillin G amidase production and export into the growth medium using Bacillus megaterium.Microb Cell Fact2006, 5:36.
17. Malten M, Biedendieck R, Gamer M, Drews AC, Stammen S, Buchholz K, Dijkhuizen L, Jahn D:A Bacillus megaterium plasmid system for the production, export, and one-step purification of affinity-tagged heterologous levansucrase from growth medium.Applied and environmental microbiology2006,72:1677.
19. Jordan E, Hust M, Roth A, Biedendieck R, Schirrmann T, Jahn D, Dübel S: Production of recombinant antibody fragments in Bacillus megaterium.
Microbial Cell Factories2007,6:2.
20. Dübel S:Handbook of therapeutic antibodiesWiley-VCH; 2007. 21. Pelat T, Hust M, Hale M, Lefranc M, Dübel S, Thullier P:Isolation of a
human-like antibody fragment (scFv) that neutralizes ricin biological activity.BMC Biotechnology2009,9.
22. Pelat T, Hust M, Laffly E, Condemine F, Bottex C, Vidal D, Lefranc MP, Dubel S, Thullier P:High-affinity, human antibody-like antibody fragment (single-chain variable fragment) neutralizing the lethal factor (LF) of Bacillus anthracis by inhibiting protective antigen-LF complex formation.
Antimicrobial agents and chemotherapy2007,51:2758.
23. David F, Westphal R, Bunk B, Jahn D, Franco-Lara E:Optimization of antibody fragment production in Bacillus megaterium: the role of metal ions on protein secretion.Journal of Biotechnology2010,150:115-124. 24. Lopes da Silva T, Piekova L, Mileu J, Roseiro JC:A comparative study using
the dual staining flow cytometric protocol applied to Lactobacillus rhamnosus and Bacillus licheniformis batch cultures.Enzyme and Microbial Technology2009,45:134-138.
25. Novo D, Perlmutter NG, Hunt RH, Shapiro HM:Accurate flow cytometric membrane potential measurement in bacteria using
diethyloxacarbocyanine and a ratiometric technique.Cytometry Part A
1999,35:55-63.
26. Hewitt CJ, Onyeaka H, Lewis G, Taylor IW, Nienow AW:A comparison of high cell density fed batch fermentations involving both induced and non induced recombinant Escherichia coli under well mixed small scale and simulated poorly mixed large scale conditions.Biotechnology and bioengineering2007,96:495-505.
27. Sträuber H, Müller S:Viability states of bacteria-Specific mechanisms of selected probes.Cytometry Part A2010,77:623-634.
28. Shi L, Günther S, Hübschmann T, Wick LY, Harms H, Müller S:Limits of propidium iodide as a cell viability indicator for environmental bacteria.
Cytometry Part A2007,71:592-598.
29. Shapiro HM:Membrane potential estimation by flow cytometry.Methods
2000,21:271-279.
30. Lüders S, David F, Steinwand M, Jordan E, Hust M, Dübel S, Franco-Lara E: Influence of the hydromechanical stress and temperature on growth and antibody fragment production with Bacillus megaterium.Applied microbiology and biotechnology2011.
31. Jolliffe LK, Doyle RJ, Streips UN:The energized membrane and cellular autolysis in Bacillus subtilis.Cell1981,25:753-763.
32. Kemper MA, Urrutia MM, Beveridge TJ, Koch AL, Doyle RJ:Proton motive force may regulate cell wall-associated enzymes of Bacillus subtilis.
Journal of bacteriology1993,175:5690.
33. Walberg M, Gaustad P, Steen HB:Uptake kinetics of nucleic acid targeting dyes inS. aureus, E. faecalis andB. cereus: a flow cytometric study.
Journal of microbiological methods1999,35:167-176.
34. Schädel F, Franco-Lara E:Rapid sampling devices for metabolic engineering applications.Applied microbiology and biotechnology2009, 83:199-208.
35. Jehmlich N, Hübschmann T, Gesell Salazar M, Völker U, Benndorf D, Müller S, von Bergen M, Schmidt F:Advanced tool for characterization of microbial cultures by combining cytomics and proteomics.Applied microbiology and biotechnology2010, 1-10.
36. Steen HB, Boye E:Escherichia coli growth studied by dual-parameter flow cytophotometry.Journal of Bacteriology1981,145:1091.
37. James BW, Mauchline WS, Dennis PJ, Keevil CW, Wait R: Poly-3-hydroxybutyrate in Legionella pneumophila, an energy source for survival in low-nutrient environments.Applied and environmental microbiology1999,65:822.
38. Ackermann J, Müller S, Lösche A, Bley T:Methylobacterium rhodesianum cells tend to double the DNA content under growth limitations and accumulate PHB.Journal of Biotechnology1995,39:9-20.
39. Maskow T, Müller S, Lösche A, Harms H, Kemp R:Control of continuous polyhydroxybutyrate synthesis using calorimetry and flow cytometry.
Biotechnology and bioengineering2006,93:541-552.
40. Panchuk-Voloshina N, Haugland RP, Bishop-Stewart J, Bhalgat MK, Millard PJ, Mao F, Leung WY, Haugland RP:Alexa dyes, a series of new fluorescent dyes that yield exceptionally bright, photostable conjugates.Journal of Histochemistry and Cytochemistry1999,47:1179.
41. Economou A:Following the leader: bacterial protein export through the Sec pathway.Trends in Microbiology1999,7:315-320.
42. Manz R, Assenmacher M, Pflüger E, Miltenyi S, Radbruch A:Analysis and sorting of live cells according to secreted molecules, relocated to a cell-surface affinity matrix.Proceedings of the National Academy of Sciences of the United States of America1995,92:1921.
43. Frykman S, Srienc F:Quantitating secretion rates of individual cells: design of secretion assays.Biotechnology and bioengineering1998, 59:214-226.
44. Müller S, Nebe von Caron G:Functional single cell analyses: flow cytometry and cell sorting of microbial populations and communities.
FEMS Microbiology Reviews2010,34:554-587.
45. Feldhaus M, Siegel R:Flow cytometric screening of yeast surface display libraries.METHODS IN MOLECULAR BIOLOGY-CLIFTON THEN TOTOWA2004, 263:311-332.
46. Mattanovich D, Borth N:Applications of cell sorting in biotechnology.
Microbial Cell Factories2006,5:12.
47. Lewis G, Taylor IW, Nienow AW, Hewitt CJ:The application of multi-parameter flow cytometry to the study of recombinant Escherichia coli batch fermentation processes.Journal of Industrial Microbiology and Biotechnology2004,31:311-322.
48. Want A, Thomas ORT, Kara B, Liddell J, Hewitt CJ:Studies related to antibody fragment (Fab) production in Escherichia coli W3110 fed-batch fermentation processes using multiparameter flow cytometry.Cytometry Part A2009,75:148-154.
49. Hewitt CJ, Nebe-Von Caron G, Axelsson B, McFarlane CM, Nienow AW: Studies related to the scale-up of high-cell-density E. coli fed-batch fermentations using multiparameter flow cytometry: effect of a changing microenvironment with respect to glucose and dissolved oxygen concentration.Biotechnology and bioengineering2000,70:381-390. 50. Hewitt CJ, Nebe-Von Caron G, Nienow AW, McFarlane CM:The use of
multi-parameter flow cytometry to compare the physiological response of Escherichia coli W3110 to glucose limitation during batch, fed-batch and continuous culture cultivations.Journal of biotechnology1999, 75:251-264.
51. Lara AR, Galindo E, Ramírez OT, Palomares LA:Living with heterogeneities in bioreactors.Molecular biotechnology2006,34:355-381.
52. Sitton G, Srienc F:Mammalian cell culture scale-up and fed-batch control using automated flow cytometry.Journal of biotechnology2008, 135:174-180.
53. Laflamme C, Ho J, Veillette M, de Latrémoille MC, Verreault D, Meriaux A, Duchaine C:Flow cytometry analysis of germinating Bacillus spores, using membrane potential dye.Archives of microbiology2005,183:107-112.
doi:10.1186/1475-2859-10-23
Cite this article as:Davidet al.:Single cell analysis applied to antibody fragment production withBacillus megaterium: development of advanced physiology and bioprocess state estimation tools.Microbial Cell Factories201110:23.
Submit your next manuscript to BioMed Central and take full advantage of:
• Convenient online submission
• Thorough peer review
• No space constraints or color figure charges
• Immediate publication on acceptance
• Inclusion in PubMed, CAS, Scopus and Google Scholar
• Research which is freely available for redistribution