S H O R T R E P O R T
Open Access
The acute effects of dietary carbohydrate
reduction on postprandial responses of
non-esterified fatty acids and triglycerides:
a randomized trial
Amirsalar Samkani
1*, Mads J. Skytte
1, Christian Anholm
2, Arne Astrup
3, Carolyn F. Deacon
4,5, Jens J. Holst
4,5,
Sten Madsbad
6, Ray Boston
7, Thure Krarup
1and Steen B. Haugaard
1,8Abstract
Background:Postprandial non-esterified fatty acid (NEFA) and triglyceride (TG) responses are increased in subjects with type 2 diabetes mellitus (T2DM) and may impair insulin action and increase risk of cardiovascular disease and death. Dietary carbohydrate reduction has been suggested as non-pharmacological therapy for T2DM, but the acute effects on NEFA and TG during subsequent meals remain to be investigated.
Methods:Postprandial NEFA and TG responses were assessed in subjects with T2DM by comparing a carbohydrate-reduced high-protein (CRHP) diet with a conventional diabetes (CD) diet in an open-label,
randomized, cross-over study. Each diet was consumed on two consecutive days, separated by a wash-out period. The iso-caloric CRHP/CD diets contained 31/54 E% from carbohydrate, 29/16 E% energy from protein and 40/30 E% from fat, respectively. Sixteen subjects with well-controlled T2DM (median HbA1c47 mmol/mol, (37–67 mmol/mol) and BMI 30 ± 4.4 kg/m2) participated in the study. NEFA and TG were evaluated following breakfast and lunch. Results:NEFA net area under curve (AUC) was increased by 97 ± 38μmol/Lx270 min (p= 0.024) after breakfast but reduced by 141 ± 33μmol/Lx180 min (p< 0.001) after lunch on the CRHP compared with CD diet. Likewise, TG net AUC was increased by 80 ± 28μmol/Lx270 min (p= 0.012) after breakfast but reduced by 320 ± 60μmol/Lx180 min (p< 0.001) after lunch on the CRHP compared with CD diet.
Conclusions:In well-controlled T2DM a modest reduction of dietary carbohydrate with a corresponding increase in protein and fat acutely reduced postprandial serum NEFA suppression and increased serum TG responses after a breakfast meal but had the opposite effect after a lunch meal. The mechanism behind this second-meal
phenomenon of CRHP diet on important risk factors for aggravating T2DM and cardiovascular disease awaits further investigation.
Trial registration:The study was registered atclinicaltrials.govID: NCT02472951.https://clinicaltrials.gov/ct2/show/ NCT02472951. Registered June 16, 2015.
Keywords:Dietary carbohydrate reduction, Postprandial triglycerides, Non-esterified fatty acids
* Correspondence:[email protected]
Grants:The study was supported by grants from the Danish Dairy Research Foundation, University of Copenhagen and Copenhagen University Hospital, Bispebjerg
1Department of Endocrinology, Copenhagen University Hospital Bispebjerg,
Bispebjerg Bakke 23, 2400 Copenhagen, NV, Denmark
Full list of author information is available at the end of the article
Background
Non-esterified fatty acids (NEFAs) and triglycerides are present in the circulation in varying quantities dependent on food - and body composition, insulin resistance and glucose tolerance [1–3]. In T2DM, the adipocytes are in-sulin resistant, leading to a reduced anti-lipolytic effect of insulin and elevated levels of circulating NEFA especially postprandially [4]. The elevated postprandial release of NEFA has been associated with cardiovascular mortality [5] and development of type 2 diabetes mellitus (T2DM) [6,7]. Enhanced postprandial triglyceridemia is a distinct component of the diabetic dyslipidemia [8] and is an inde-pendent strong predictor of ischemic heart disease [9].
In T2DM, dietary management with concomitant body weight loss is suggested to be the basis of prevention and treatment to reduce comorbidities such as cardio-vascular disease [10,11].
On the other hand, it is well-known that long-term weight loss is very difficult to obtain and another treat-ment strategy to improve glycemic control may be to change the quality of food recommended to patients with type 2 diabetes [12, 13]. Although the most recent consensus guideline has made no specific recommenda-tions on the macronutrient composition [14], the
Dia-betes Nutrition Study Group under European
Association for the Study of Diabetes stated in 2004 that the reason for recommending a moderately high carbohydrate diet was the recommendation of 15E% protein and 30E% fat, leaving 55E% for carbohydrate [15]. In diets low in carbohydrate the protein as well as the fat content is higher than in the recommended diabetes diet. The higher content of fat in carbohydrate-reduced di-ets could in theory induce higher postprandial concentra-tions of NEFA and triglycerides (TG).
The aim of the present study was to compare a carbohydrate-reduced high-protein (CRHP) and high fat diet with an iso-energetically conventional diabetes (CD) diet in relation to postprandial NEFA and TG excursions in subjects with T2DM.
Methods Study design
The study design has been described in detail elsewhere [16]. In short, the participants underwent two separate 48-h interventions in a randomized, crossover design, with a 2–8 weeks washout period between each intervention. Participants were randomized to start with either a CRHP or CD diet by drawing blinded ballots, and were provided with their assigned diets, comprising breakfast, lunch, pre-dinner snack, dinner and post-dinner snack, for two consecutive days. Participants attended the Endocrine Re-search Unit, University of Copenhagen, Bispebjerg Hos-pital, Denmark, where mixed meal tests (MMT) were performed at breakfast and lunch on both days for each
diet. After an overnight fast and voiding the bladder, pa-tients were weighed, and a venous catheter was placed in an antecubital vein to draw blood samples at times −10, 0, 10, 20, 30, 45, 60, 90, 120, 150, 180, 210, 240, 270, 280, 290, 300, 315, 330, 360, 390, 420 and 450 min (min). The breakfast provided 30% of daily total energy expenditure (TEE) and was served at time 0 min and consumed within 30 min. Likewise the lunch meal comprised 30% of TEE and was served at time 270 min and consumed within 30 min. The participants rested in a reclined position and remained sedentary throughout breakfast and lunch MMT. Dinner (30% of TEE) and snacks (10% of TEE) were provided for later consumption at home. TEE was estimated based on dual-energy X-ray absorptiometry (Lunar iDXA, GE Healthcare) prior to interventions, as described in detail elsewhere [16]. All ingredients were weighed out by the hospital research kitchen. A standard-ized isocaloric dinner (macronutrient content: 54% of en-ergy from carbohydrates, 16% from protein and 30% from fat) was provided for the evening meal prior to each 48-h intervention period. Participants were asked to refrain from alcohol and strenuous physical activity for 3 days prior to each experimental period, and coffee or tea was not allowed during the intervention days.
Participants
Sixteen participants with well-controlled T2DM in met-formin mono-therapy were included in the study (Table 1). All participants were non-smokers and were weight stable throughout the study. Ten participants were treated with statins. Lipid lowering agents were kept unchanged throughout the study. Diagnosis of T2DM was based on the American Diabetes Association criteria [17].
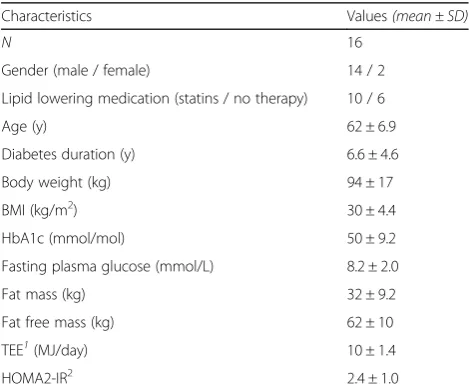
Table 1Baseline characteristics of participants,n= 16
Characteristics Values(mean ± SD)
N 16
Gender (male / female) 14 / 2 Lipid lowering medication (statins / no therapy) 10 / 6 Age (y) 62 ± 6.9 Diabetes duration (y) 6.6 ± 4.6 Body weight (kg) 94 ± 17 BMI (kg/m2) 30 ± 4.4
HbA1c (mmol/mol) 50 ± 9.2 Fasting plasma glucose (mmol/L) 8.2 ± 2.0 Fat mass (kg) 32 ± 9.2 Fat free mass (kg) 62 ± 10 TEE1(MJ/day) 10 ± 1.4 HOMA2-IR2 2.4 ± 1.0
1
Total energy expenditure 2
Written informed consent was obtained from all partici-pants prior to any study related procedures. The study protocol was approved by the Health Ethics Committee of Copenhagen in accordance with the Helsinki-II declar-ation, and the trial was registered atclinicaltrials.gov(ID: NCT02472951). No participants dropped out of the study.
Diet compositions
A CRHP diet (macronutrient composition: 31% of energy from carbohydrates, 29% from protein and 40% from fat) was compared with a CD diet (macronutrient compos-ition: 54% of energy from carbohydrates, 16% from pro-tein and 30% from fat) composed in accordance with the recommended diet for T2DM [15]. Full details on ingredi-ents in the diets have been published elsewhere [16].
Analytical procedures
The first 2 mL of each blood sample drawn were dis-carded, after which blood was collected in clot activator tubes that were left for 30 min before centrifugation to obtain serum. Separate samples, taken into smaller EDTA-containing tubes were centrifuged immediately for measurement of plasma glucose (PG) using YSI 2300 STAT plus (Yellow Spring Instruments, Yellow Springs, OH, USA). Serum NEFA was analyzed using a commer-cially available reagent (Wako, NEFA-HR [2], Wako Che-micals GmbH, Neuss, Germany) with the ACS-ACOD Method [18,19], providing CV < 1.5% at all NEFA concen-trations. Serum TG was analyzed by enzymatic colorimet-ric analysis by using the Cobas 8000 modular analyzer (Roche Diagnostics, Indianapolis, IN, USA) standardized against isotope dilution-mass spectrometry, providing CV of 1.4% at 2.12 mmol/L. Cortisol was measured in plasma, obtained in EDTA-tubes centrifuged at 4 degrees Celsius after sampling, by use of the Immulite 2000 Cortisol Sys-tems Analyzer (Siemens Healthcare).
Calculations and statistics
Area under curve (AUC) was calculated using the trap-ezoidal rule and net AUC was calculated by subtracting the AUC below baseline values. Values are expressed as means ± SEM. Fasting concentrations (baseline) were calculated as means of the −10 and 0 min samples for breakfast and baseline level as the 270-min sample for lunch (initiation of lunch). To evaluate statistical differ-ences between diets, means of both consecutive days on each diet were compared using Student’sttests or Wil-coxon signed-rank test as appropriate. Graphical evalu-ation was used to evaluate Gaussian distribution. To evaluate differences in serum NEFA and TG concentra-tions at individual time points, two-way repeated mea-sures ANOVA was used on means of both consecutive days, with subjects as fixed effects and treatment and time as repeated measures. Bonferroni’s multiple comparison
adjustment of significance levels was made on individual time points as post hoc comparisons to adjust for multiple comparisons. Correlation was evaluated with Pearson or Spearman correlation as appropriate. Significance level was set at p-values below 0.05. With n = 16 participants an estimated effect size between diets of 11% (SD = 15%) was calculated to be found, provided a power of 80% at significance p < 0.05. GraphPad Prism (version 7.02; Graphpad Software, CA, USA) was used for statistical analyses.
Results
Glucose and insulin data have been previously published [16]. Essentially, postprandial glucose and insulin AUC were reduced by 14 and 22% (both p< 0.001), respect-ively, by the CRHP compared with the CD diet. Second-ary analyses on previously published insulin data were performed for the present study with permission from British Journal of Nutrition.
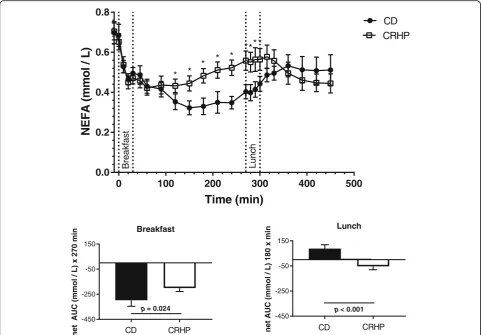
NEFA
Fasting NEFA concentrations did not differ on the two diets (Fig. 1). During breakfast, suppression of NEFA was more pronounced on CD resulting in a less total AUC of NEFA compared with CRHP diet (Fig. 1, Table 2). Nadir NEFA concentration was increased by 26% (354 ± 34.4 vs. 282 ± 31.7μmol/L, p= 0.012) and time to nadir was decreased (114 ± 19.4 vs. 163 ± 11.0 min, p= 0.041), respectively, by the CRHP compared with CD diet (Fig. 1, Table 2). Net NEFA AUC was significantly greater with CRHP (−201 ± 38 vs. −298 ± 48μmol/L × 270 min (p= 0.024)) compared with CD diet.
Before start of lunch (270 min) baseline NEFA concen-tration was significantly higher after CRHP compared with CD diet (Fig.1). The pattern of NEFA concentrations dur-ing lunch differ between the two diets with a significant increase in NEFA during CD, while a significant reduction in NEFA was observed during CRHP diet. Total AUC of NEFA during the lunch did not differ, while net AUC from baseline (88 ± 31 vs. -53 ± 27μmol/ × 180 min, p< 0.001) was significantly less after CRHP compared with CD diet (Fig.1, Table2). At end of lunch the NEFA concentrations did not differ between the two diets.
During both meals total AUC NEFA was significantly enhanced by 13% (56 ± 16μmol/L × 450 min, p= 0.003) with CRHP compared with CD (Table2).
found between fasting cortisol and fasting NEFA con-centrations (Pearsonr= 0.245,p= 0.051).
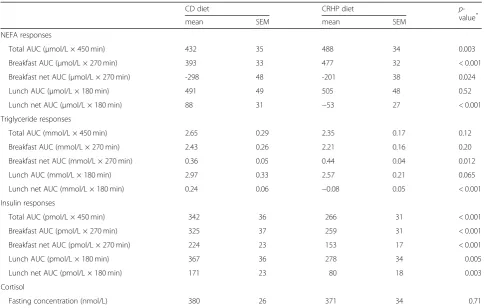
Triglyceride.
Fasting TG on the CD vs. CRHP diet did not differ (1.86 (IQR 1.55;2.44) vs. 1.72 (IQR 1.40;2.07), P > 0.05). Peak serum TG concentrations were reached 270 min after breakfast on both diets. The increase in serum TG was enhanced after ingestion of CRHP compared with CD diet, resulting in a tendency to a higher total AUC TG and a significantly greater net AUC TG 0.44 ± 0.04 vs. 0.36 ± 0.05 mmol/L × 270 min (p= 0.012), respectively (Fig. 2, Table 2). Incremental TG values are presented in Fig.2. At 270 min the TG concentration was significantly higher during CRHP compared with CD diet (Fig.2).
After Lunch the changes in TG concentrations parallel the changes in NEFA with an increase during CD and a significant reduction in TG after CRHP diet (Fig. 2), resulting in a net AUC of −0.08 ± 0.05 vs. 0.24 ± 0.06 mmol/L × 180 min (p< 0.001), respectively (Fig. 2). Lunch total AUC TG tended to be high at CD compared with CRHP diet (Table2,p= 0.065).
During both meals total AUC TG did not differ signifi-cantly (Table2,p= 0.12).
As a measure of within-subject variability, a strong correlation was found between fasting TG concentra-tions on each diet (Spearmanr= 0.82,p< 0.001).
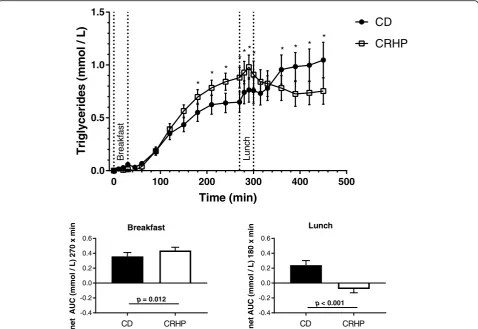
Insulin
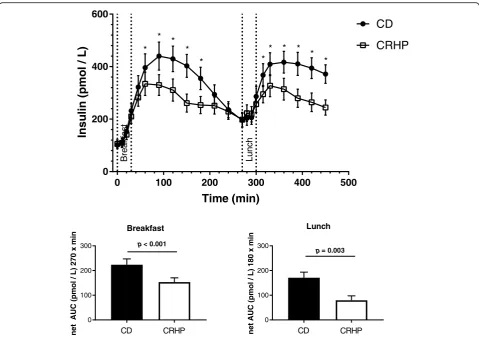
Fasting insulin concentrations did not differ between the two diets (Fig. 3). The CRHP diet reduced postprandial insulin responses after both the breakfast and lunch meals as compared with the CD diet (Fig.3, Table2), as peak insulin concentrations were reduced following both breakfast (334 ± 44.5 vs. 440 ± 53.6 pmol/L, p = 0.032) and lunch (372 ± 41.9 vs. 417 ± 41.2, p = 0.043) and net insulin AUC was reduced by 32% (153 ± 17 vs. 224 ± 23 pmol/L × 270 min, p< 0.001) following breakfast and by 53% (80 ± 18 vs. 171 ± 23 pmol/L × 180 min, p = 0.003) following lunch. Postprandial excursions of insulin were similar following breakfast and lunch within each diet, as no differences were found between the insulin peaks on the CRHP breakfast compared with CRHP lunch
0 100 200 300 400 500
0.0 0.2 0.4 0.6 0.8
Time (min)
NE
F
A
(mmo
l
/
L)
CD CRHP
Br
eakfast
Lunc
h
* *
* * *
*** *
-450 -250 -50 150
Breakfast
n
e
t
A
U
C
(m
m
o
l/L
)
x
2
7
0m
in
CD CRHP
p = 0.024
-450 -250 -50 150
Lunch
n
e
t
A
U
C
(m
m
o
l/L
)
1
8
0xm
in
CD CRHP
p < 0.001
(p = 0.42) or on the CD breakfast compared with CD lunch (p= 0.82).
A correlation was found between fasting insulin and fasting TG concentrations (Pearson r = 0.311, p = 0.013), while no correlation was found between fasting insulin and fasting NEFA concentrations (Pearsonr= 0.065,p= 0.61).
Discussion
The present study showed, in well-controlled T2DM, that a modest reduction of dietary carbohydrate content with a corresponding increase in protein and fat content compared with an energy-matched conventionally dia-betes diet acutely reduced postprandial serum NEFA suppression and increased serum TG responses after a breakfast meal but had the opposite effect after a lunch meal. We previously reported in the same subjects that the reduced carbohydrate intake exerted a marked acute beneficial effect on glucose excursions despite reduced insulin secretion [16].
Elevated fasting concentration of NEFA has been shown to be proportional to body fat storage [20], and reflects insulin resistance in adipose tissue and is a predictor of subsequent development of T2DM [6, 21].
In the fasting state, NEFA is released to the circulation by lipolysis in adipose tissue, primarily from subcutane-ous adipose tissue, but as obesity progresses, visceral adipose tissue contributes relatively more to the NEFA pool [22]. The circulating NEFA pool provides energy substrates for tissues, with fasting circulating NEFA con-centrations being regulated by hormones with diurnal variations such as cortisol, catecholamines and insulin [23–25]. In the present study, a borderline significant correlation was found between fasting cortisol and fast-ing NEFA concentrations.
In the fed state, insulin suppresses lipolysis and in-creases re-esterification of fatty acids [26, 27]. In the present study, circulating NEFA concentrations were suppressed to a smaller extent by the CRHP breakfast than by the CD breakfast, likely to be explained by the observed reduction in the postprandial insulin excursion following the CRHP diet (Fig.3, Table2).
An inverse response in NEFA concentrations was found after lunch, despite similar insulin concentrations following breakfast and lunch following each diet. Thus, a reduction of net NEFA AUC was found following the CRHP lunch compared with a net increase following the CD lunch. This paradoxical shift may be explained by the excursions of TG and a possible increase in
Table 2Postprandial NEFA, triglyceride and insulin and fasting cortisol in subjects with type 2 diabetes,N= 16
CD diet CRHP diet p -value* mean SEM mean SEM
NEFA responses
Total AUC (μmol/L × 450 min) 432 35 488 34 0.003 Breakfast AUC (μmol/L × 270 min) 393 33 477 32 < 0.001 Breakfast net AUC (μmol/L × 270 min) -298 48 -201 38 0.024 Lunch AUC (μmol/L × 180 min) 491 49 505 48 0.52 Lunch net AUC (μmol/L × 180 min) 88 31 −53 27 < 0.001 Triglyceride responses
Total AUC (mmol/L × 450 min) 2.65 0.29 2.35 0.17 0.12 Breakfast AUC (mmol/L × 270 min) 2.43 0.26 2.21 0.16 0.20 Breakfast net AUC (mmol/L × 270 min) 0.36 0.05 0.44 0.04 0.012 Lunch AUC (mmol/L × 180 min) 2.97 0.33 2.57 0.21 0.065 Lunch net AUC (mmol/L × 180 min) 0.24 0.06 −0.08 0.05 < 0.001 Insulin responses
Total AUC (pmol/L × 450 min) 342 36 266 31 < 0.001 Breakfast AUC (pmol/L × 270 min) 325 37 259 31 < 0.001 Breakfast net AUC (pmol/L × 270 min) 224 23 153 17 < 0.001 Lunch AUC (pmol/L × 180 min) 367 36 278 34 0.005 Lunch net AUC (pmol/L × 180 min) 171 23 80 18 0.003 Cortisol
Fasting concentration (nmol/L) 380 26 371 34 0.71
Abbreviations: NEFA, non-esterified fatty acids; CD, conventional diabetes; CRHP carbohydrate-reduced high-protein; AUC, area under curve;*
lipo-protein lipase (LPL) activity facilitated by the in-crease in insulin [23]. Lipo-protein lipase is induced by insulin after a delay and hydrolyses TG from lipopro-teins at the capillary endothelial luminal surface, where some, but not all, of the NEFA is taken up by the tissue. A fraction of of this NEFA escapes uptake and is spilled over back to the circulating NEFA pool [28–31]. We previously reported this paradoxical difference in NEFA response to breakfast and lunch in non-diabetic subjects [32]. As elevated serum NEFA concentrations can impair peripheral glucose uptake by inhibition of insulin-stimu-lated glucose disposal [33–35], an enhanced or reduced postprandial NEFA response may modulate postprandial glucose responses [34].
The TG excursion was increased following the CRHP breakfast, but reduced following lunch, compared with the CD diet. Thus, the second meal elicited the opposite effect on TG concentrations after the CRHP lunch com-pared with breakfast even though the fat content was higher in the CRHP diet. Again, the decrease in postpran-dial insulin response following the CRHP, compared with
CD, diet (Fig. 3, Table 2) adds to the explanation of this variation. Chen et al. found a high-carbohydrate diet (55E%) to increase production of very low density lipo-protein triglyceride (VLDL-TG) in the liver of subjects with type 2 diabetes, secondary to a higher insulin concen-tration [36]. Both de novo lipogenesis and fatty acid re-esterification contribute to the production of VLDL-TG [37]. Chylomicron-derived TG is cleared competitively through the same pathways as VLDL-TG produced in the liver, thus explaining the net result of elevated plasma TG on higher, compared with lower, carbohydrate diets found in previous studies [36,38–40]. This finding is only appar-ent in the subsequappar-ent meal after breakfast in the presappar-ent study, which underscores the need to employ consecutive meals to evaluate dietary effects on lipid metabolism. Thus, interpretation of NEFA and TG excursions following a sin-gle meal may be confounded by the delayed effects of insu-lin on lipid metabolism. Furthermore, postprandial NEFA excursions should be evaluated in concert with TG excur-sions, as the circulating concentrations of these substrates are highly interdependent.
0 100 200 300 400 500
0.0 0.5 1.0 1.5
Time (min)
Tri
glycerides
(m
m
o
l
/
L
)
CD
CRHP
Br
eakfast
Lunc
h
* *
*
** *
* * * *
*
-0.4 -0.2 0.0 0.2 0.4 0.6
n
e
t
A
UC
(mmol
/
L
)
2
70
x
m
in
CD CRHP
p = 0.012
Breakfast
-0.4 -0.2 0.0 0.2 0.4 0.6
n
e
tA
U
C
(m
m
o
l
/
L
)1
8
0
x
m
in
CD CRHP
p < 0.001
Lunch
Within-subject variability of fasting and postprandial NEFA concentrations is substantial (CV 24–45%) [41,42], and even short term (30 days) within-subject concentra-tions of two fasting NEFA measurements only show a cor-relation coefficient (r) of 0.70 (p< 0.001) [43], complicating use and interpretation of fasting NEFA levels. Therefore, it is crucial to employ rigorous protocols to assure standardization between interventions, e.g. equal durations of overnight fast, identical dinners prior to intervention days etc.
A strength of the present study was the thoroughly standardized protocol, designed to minimize within-sub-ject variability between interventions, resulting in a stronger within-subject correlation (Pearsonr= 0.80,p< 0.001) in fasting NEFA concentrations than previously reported. A further strength is the measurement of post-prandial NEFA and TG responses to two subsequent meals, because, as was found, the response to a second meal can differ from the response to the first meal. Im-portantly, all meals were provided to the patients and
the two diets were energy-matched to ensure a highly controlled setting.
Conclusions
In well-controlled T2DM patients, intake of an ex-perimental diet moderately reduced in carbohydrate and increased in protein and fat content acutely re-duced postprandial serum NEFA suppression and in-creased serum TG responses after a breakfast meal but had the opposite effect after a lunch meal when compared with the recommended diet for diabetes patients. Studies are needed to evaluate these effects in longer term studies and in subjects with more dys-regulated diabetes.
Abbreviations
AUC:area under curve; CD: conventional diabetes; CRHP: carbohydrate-reduced high-protein; LPL: lipoprotein lipase; MMT: mixed meal test; NEFA: non-esterified fatty acids; PG: plasma glucose; T2DM: type 2 diabetes mellitus; TEE: total energy expenditure; TG: triglyceride
0 100 200 300 400 500
0 200 400 600
Time (min)
Insu
lin
(pmo
l
/
L
)
CD
CRHP
Br
eakfast
Lunc
h
*
* * *
*
* *
* *
* *
0 100 200 300
net
A
UC
(pmol
/
L)
270
x
min
CD CRHP
Breakfast
p < 0.001
0 100 200 300
net
A
UC
(pmol
/
L)
180
x
min
CD CRHP
p = 0.003
Lunch
Acknowledgements
It would not have been possible to conduct this study without the help of Copenhagen University Hospital, Bispebjerg kitchen staff or the study participants.
Funding
A research grant from the Danish Dairy Research Foundation made this study possible. The funder had no role in design, conduction, analysis or manuscript development of the study.
Availability of data and materials
The datasets used and analysed during the current study are available from the corresponding author on reasonable request.
Author’s contributions
A.S., M.S., A.A., C.D., J.H., S.M., T.K. and S.H. designed the study; A.S. and M.S. conducted the study; A.S., M.S., C.A. and R.B. analyzed the data; A.S and M.S. wrote the initial manuscript; All co-authors coedited and revised the manu-script; A.S. had primary responsibility of the final version of the manuscript. All authors approved the manuscript.
Ethics approval and consent to participate
Written informed consent was obtained from all participants prior to any study related procedures. The study protocol was approved by the Health Ethics Committee of Copenhagen in accordance with the Helsinki-II declar-ation, and the trial was registered atclinicaltrials.gov(ID: NCT02472951). No participants dropped out of the study.
Consent for publication
Written informed consent was obtained from all participants.
Competing interests
The authors declare that they have no competing interests to declare related to the present study.
Publisher’s Note
Springer Nature remains neutral with regard to jurisdictional claims in published maps and institutional affiliations.
Author details
1
Department of Endocrinology, Copenhagen University Hospital Bispebjerg, Bispebjerg Bakke 23, 2400 Copenhagen, NV, Denmark.2Department of
Internal Medicine, Copenhagen University Hospital, Glostrup, Denmark.
3Department of Nutrition, Exercise and Sports, University of Copenhagen,
Copenhagen, Denmark.4Endocrinology Research Section, Department of Biomedical Sciences, Copenhagen, Denmark.5Section for Translational
Physiology, Center for Basic Metabolic Research, University of Copenhagen, Copenhagen, Denmark.6Department of Endocrinology, Copenhagen
University Hospital, Amager Hvidovre, Copenhagen, Denmark.7School of Medicine, Department of Medicine, University of Melbourne, Melbourne, Australia.8Department of Internal Medicine, Copenhagen University Hospital, Amager Hvidovre, Copenhagen, Denmark.
Received: 28 August 2018 Accepted: 18 December 2018
References
1. Il'yasova D, Wang F, D'Agostino RB, Jr., Hanley A, Wagenknecht LE. Prospective association between fasting NEFA and type 2 diabetes: impact of post-load glucose. Diabetologia 2010;53(5):866–874.
2. Karpe F, Dickmann JR, Frayn KN. Fatty acids, obesity, and insulin resistance: time for a reevaluation. Diabetes. 2011;60(10):2441–9.
3. Poynten AM, Gan SK, Kriketos AD, Campbell LV, Chisholm DJ. Circulating fatty acids, non-high density lipoprotein cholesterol, and insulin-infused fat oxidation acutely influence whole body insulin sensitivity in nondiabetic men. J Clin Endocrinol Metab. 2005;90(2):1035–40.
4. Bays H, Mandarino L, DeFronzo RA. Role of the adipocyte, free fatty acids, and ectopic fat in pathogenesis of type 2 diabetes mellitus: peroxisomal proliferator-activated receptor agonists provide a rational therapeutic approach. J Clin Endocrinol Metab. 2004;89(2):463–78.
5. Pilz S, Scharnagl H, Tiran B, Seelhorst U, Wellnitz B, Boehm BO, et al. Free fatty acids are independently associated with all-cause and cardiovascular mortality in subjects with coronary artery disease. J Clin Endocrinol Metab. 2006;91(7):2542–7.
6. Boden G, Shulman GI. Free fatty acids in obesity and type 2 diabetes: defining their role in the development of insulin resistance and beta-cell dysfunction. Eur J Clin Investig. 2002;32(Suppl 3):14–23.
7. Frayn KN. Non-esterified fatty acid metabolism and postprandial lipaemia. Atherosclerosis. 1998;141(Suppl 1):S41–6.
8. Turner RC, Millns H, Neil HA, Stratton IM, Manley SE, Matthews DR, et al. Risk factors for coronary artery disease in non-insulin dependent diabetes mellitus: United Kingdom prospective Diabetes study (UKPDS: 23). BMJ. 1998;316(7134):823–8.
9. Nordestgaard BG, Benn M, Schnohr P, Tybjaerg-Hansen A. Nonfasting triglycerides and risk of myocardial infarction, ischemic heart disease, and death in men and women. JAMA. 2007;298(3):299–308.
10. American Diabetes A. 4. Lifestyle management: standards of medical Care in Diabetes−2018. Diabetes Care. 2018;41(Suppl 1):S38–50.
11. American Diabetes A. 7. Approaches to glycemic treatment. Diabetes Care. 2016;39(Suppl 1):S52–9.
12. Strohacker K, McCaffery JM, MacLean PS, Wing RR. Adaptations of leptin, ghrelin or insulin during weight loss as predictors of weight regain: a review of current literature. Int J Obes. 2014;38(3):388–96.
13. Evert AB, Boucher JL, Cypress M, Dunbar SA, Franz MJ, Mayer-Davis EJ, et al. Nutrition therapy recommendations for the management of adults with diabetes. Diabetes Care. 2014;37(Suppl 1):S120–43.
14. Davies MJ, D'Alessio DA, Fradkin J, Kernan WN, Mathieu C, Mingrone G, et al. Management of Hyperglycemia in type 2 Diabetes, 2018. A consensus report by the American Diabetes Association (ADA) and the European Association for the Study of Diabetes (EASD). Diabetes Care. 2018. 15. Mann JI, De Leeuw I, Hermansen K, Karamanos B, Karlstrom B, Katsilambros N,
et al. Evidence-based nutritional approaches to the treatment and prevention of diabetes mellitus. Nutr Metab Cardiovasc Dis. 2004;14(6):373–94. 16. Samkani A, Skytte MJ, Kandel D, Kjaer S, Astrup A, Deacon CF, et al. A
carbohydrate-reduced high-protein diet acutely decreases postprandial and diurnal glucose excursions in type 2 diabetes patients. Br J Nutr. 2018;119(8):910–7. 17. American Diabetes A. (2) classification and diagnosis of diabetes. Diabetes
Care 2015;38 Suppl:S8-S16.
18. Rogiers V. Stability of the long chain non-esterified fatty acid pattern in plasma and blood during different storage conditions. Clin Chim Acta. 1978; 84(1–2):49–54.
19. Krebs M, Stingl H, Nowotny P, Weghuber D, Bischof M, Waldhausl W, et al. Prevention of in vitro lipolysis by tetrahydrolipstatin. Clin Chem. 2000;46(7):950–4.
20. Boden G. Obesity and free fatty acids. Endocrinol Metab Clin N Am. 2008; 37(3):635–46 viii-ix.
21. Paolisso G, Tataranni PA, Foley JE, Bogardus C, Howard BV, Ravussin E. A high concentration of fasting plasma non-esterified fatty acids is a risk factor for the development of NIDDM. Diabetologia. 1995;38(10):1213–7. 22. Nielsen S, Guo Z, Johnson CM, Hensrud DD, Jensen MD. Splanchnic lipolysis
in human obesity. J Clin Invest. 2004;113(11):1582–8.
23. Ruge T, Hodson L, Cheeseman J, Dennis AL, Fielding BA, Humphreys SM, et al. Fasted to fed trafficking of fatty acids in human adipose tissue reveals a novel regulatory step for enhanced fat storage. J Clin Endocrinol Metab. 2009;94(5):1781–8.
24. Taggart P, Carruthers M. Endogenous hyperlipidaemia induced by emotional stress of racing driving. Lancet. 1971;1(7695):363–6.
25. Djurhuus CB, Gravholt CH, Nielsen S, Mengel A, Christiansen JS, Schmitz OE, et al. Effects of cortisol on lipolysis and regional interstitial glycerol levels in humans. Am J Physiol Endocrinol Metab. 2002;283(1):E172–7.
26. Boden G, Chen X, Desantis RA, Kendrick Z. Effects of insulin on fatty acid reesterification in healthy subjects. Diabetes. 1993;42(11):1588–93. 27. Campbell PJ, Carlson MG, Hill JO, Nurjhan N. Regulation of free fatty acid
metabolism by insulin in humans: role of lipolysis and reesterification. Am J Phys. 1992;263(6 Pt 1):E1063–9.
28. Sadur CN, Eckel RH. Insulin stimulation of adipose tissue lipoprotein lipase. Use of the euglycemic clamp technique. J Clin Invest. 1982; 69(5):1119–25.
30. Pollare T, Vessby B, Lithell H. Lipoprotein lipase activity in skeletal muscle is related to insulin sensitivity. Arterioscler Thromb. 1991;11(5):1192–203. 31. Miles JM, Nelson RH. Contribution of triglyceride-rich lipoproteins to plasma
free fatty acids. Horm Metab Res. 2007;39(10):726–9.
32. Samkani A, Skytte MJ, Thomsen MN, Astrup A, Deacon CF, Holst JJ, et al. Acute effects of dietary carbohydrate restriction on Glycemia, Lipemia and appetite regulating hormones in Normal-weight to obese subjects. Nutrients. 2018;10(9).
33. Belfort R, Mandarino L, Kashyap S, Wirfel K, Pratipanawatr T, Berria R, et al. Dose-response effect of elevated plasma free fatty acid on insulin signaling. Diabetes. 2005;54(6):1640–8.
34. Hue L, Taegtmeyer H. The Randle cycle revisited: a new head for an old hat. Am J Physiol Endocrinol Metab. 2009;297(3):E578–91.
35. Frayn KN. The glucose-fatty acid cycle: a physiological perspective. Biochem Soc Trans. 2003;31(Pt 6):1115–1119.
36. Chen YD, Coulston AM, Zhou MY, Hollenbeck CB, Reaven GM. Why do low-fat high-carbohydrate diets accentuate postprandial lipemia in patients with NIDDM? Diabetes Care. 1995;18(1):10–6.
37. Donnelly KL, Smith CI, Schwarzenberg SJ, Jessurun J, Boldt MD, Parks EJ. Sources of fatty acids stored in liver and secreted via lipoproteins in patients with nonalcoholic fatty liver disease. J Clin Invest. 2005;115(5):1343–51. 38. Wilson DE, Chan IF, Buchi KN, Horton SC. Postchallenge plasma lipoprotein
retinoids: chylomicron remnants in endogenous hypertriglyceridemia. Metabolism. 1985;34(6):551–8.
39. Jeppesen J, Chen YI, Zhou MY, Schaaf P, Coulston A, Reaven GM. Postprandial triglyceride and retinyl ester responses to oral fat: effects of fructose. Am J Clin Nutr. 1995;61(4):787–91.
40. Huntriss R, Campbell M, Bedwell C. The interpretation and effect of a low-carbohydrate diet in the management of type 2 diabetes: a systematic review and meta-analysis of randomised controlled trials. Eur J Clin Nutr. 2018;72(3):311–25.
41. Widjaja A, Morris RJ, Levy JC, Frayn KN, Manley SE, Turner RC. Within- and between-subject variation in commonly measured anthropometric and biochemical variables. Clin Chem. 1999;45(4):561–6.
42. Magkos F, Patterson BW, Mittendorfer B. Reproducibility of stable isotope-labeled tracer measures of VLDL-triglyceride and VLDL-apolipoprotein B-100 kinetics. J Lipid Res. 2007;48(5):1204–11.