Open Access
Software
Development and validation of MIX: comprehensive free software
for meta-analysis of causal research data
Leon Bax*
1,2, Ly-Mee Yu
3, Noriaki Ikeda
2, Harukazu Tsuruta
2and
Karel GM Moons
1Address: 1Julius Center for Health Sciences and Primary Care, UMC Utrecht, The Netherlands, 2Department of Medical Informatics, Graduate
School of Medical Sciences, Kitasato University, Japan and 3Centre for Statistics in Medicine, Oxford, UK
Email: Leon Bax* - [email protected]; Ly-Mee Yu - [email protected]; Noriaki Ikeda - [email protected]; Harukazu Tsuruta - [email protected]; Karel GM Moons - [email protected]
* Corresponding author
Abstract
Background: Meta-analysis has become a well-known method for synthesis of quantitative data from previously conducted research in applied health sciences. So far, meta-analysis has been particularly useful in evaluating and comparing therapies and in assessing causes of disease. Consequently, the number of software packages that can perform meta-analysis has increased over the years. Unfortunately, it can take a substantial amount of time to get acquainted with some of these programs and most contain little or no interactive educational material. We set out to create and validate an easy-to-use and comprehensive meta-analysis package that would be simple enough programming-wise to remain available as a free download. We specifically aimed at students and researchers who are new to meta-analysis, with important parts of the development oriented towards creating internal interactive tutoring tools and designing features that would facilitate usage of the software as a companion to existing books on meta-analysis.
Results: We took an unconventional approach and created a program that uses Excel as a calculation and programming platform. The main programming language was Visual Basic, as implemented in Visual Basic 6 and Visual Basic for Applications in Excel 2000 and higher. The development took approximately two years and resulted in the 'MIX' program, which can be downloaded from the program's website free of charge. Next, we set out to validate the MIX output with two major software packages as reference standards, namely STATA (metan, metabias, and metatrim) and Comprehensive Meta-Analysis Version 2. Eight meta-analyses that had been published in major journals were used as data sources. All numerical and graphical results from analyses with MIX were identical to their counterparts in STATA and CMA. The MIX program distinguishes itself from most other programs by the extensive graphical output, the click-and-go (Excel) interface, and the educational features.
Conclusion: The MIX program is a valid tool for performing meta-analysis and may be particularly useful in educational environments. It can be downloaded free of charge via http://www.mix-for-meta-analysis.info or http://sourceforge.net/projects/meta-analysis.
Published: 13 October 2006
BMC Medical Research Methodology 2006, 6:50 doi:10.1186/1471-2288-6-50
Received: 22 August 2006 Accepted: 13 October 2006
This article is available from: http://www.biomedcentral.com/1471-2288/6/50 © 2006 Bax et al; licensee BioMed Central Ltd.
Background
The amount of data produced by researchers in health sci-ences has been growing explosively and advances in genetics, genomics, and information technology are likely to further contribute to this growth. In the past two dec-ades, meta-analysis has evolved into the statistical method par excellence to make sense out of the growing number of research reports. As the quantitative analytical part of a systematic review, it has been used for evaluating data from both experimental and observational studies in ther-apeutic, diagnostic, prognostic, and etiologic settings. In the commonly used definition of the hierarchy of scien-tific data for medical decision making, meta-analyses are considered as providing the highest level of evidence [1,2]. As such, they can have a major impact on medical practice and health care policies, especially if aggregating data and investigating sources of heterogeneity provide new insights. Two well-known examples are the meta-analyses by Yusuf et al [3] and Lau et al [4], both showing that meta-analysis can be a powerful tool to show inter-vention effects that would remain beneath the surface of single study data without proper synthesis and re-analysis.
Although meta-analyses can be applied to all types of medical research, its primary application so far has been in the therapeutic realm. One of the main forces behind the rise of therapeutic meta-analysis is the Cochrane Col-laboration [5], whose effort to systematically assess and synthesize evidence from randomized controlled trials has so far produced more than 4400 Cochrane systematic reviews, many with quantitative meta-analyses. The increasing interest for meta-analysis in health sciences over the past twenty years has been reported by several authors [6-11] and a small search we did in preparation of this project reveals that between 1990 and 2005 approxi-mately 12,000 publications have been classified as a meta-analysis by PubMed. A bar graph of the annual num-bers suggests that the interest for meta-analysis is still increasing (figure 1).
Many general statistical software packages have included options for meta-analysis in their basic program configu-ration, and user-communities have written numerous meta-analysis add-ons. Specialized software packages, meant exclusively for meta-analysis, are also available in various types and price ranges. Although the number of
The annual number of meta-analyses registered by PubMed Figure 1
software packages for performing meta-analysis is sub-stantial, in our opinion, most share one common limita-tion: low applicability in educational settings or environments with beginning researchers. Even though numerous researchers in health care are nowadays con-fronted with data from published meta-analyses or are even requested to do a meta-analysis themselves, there is still little or no electronic educational material and none of the existing software has explicit educational features. Cost is another issue that may have an impact on the use of software by students and lecturers: only a few of the modern meta-analysis packages are free and if academic pricing is available, prices can still be rather high for many.
After reading previously published software reviews [12-15] and using existing meta-analysis software, we made an inventory of what we thought was lacking or could be improved. Next, we set out to implement our ideas and create an innovative and comprehensive statistical meta-analysis package that would be freely accessible and user-friendly enough for students and beginning researchers. The program, called MIX (Meta-analysis with Interactive eXplanations), has been developed over the past two years and has been presented at several stages of the develop-ment at a number of conferences [16-19]. In October 2005, the first public version (1.0) was released during the Cochrane Colloquium in Melbourne [19] and has become available for download via the MIX website [20]. It has been receiving a lot of interest (100–150 unique vis-itors to the MIX website each week) and has been down-loaded over 1800 times within 6 months of its first release. This has prompted us to validate the results of all tests in the program formally and this article provides the offcial introduction of the MIX program together with the results of the validation.
Implementation
Objectives
Our primary objective was to develop a free program for meta-analysis of causal research (therapeutic trials as well as etiologic cohorts and case-control studies) that could be applied in both analytical and educational settings. Our secondary aim was to validate the analytical tests in the program with output from established reference standards.
Program development
Before the actual development, we started with making an inventory of the most important meta-analytical tests and approaches, and brainstormed on ideas for an interface. Since causal meta-analysis methods are relatively well-established (in contrast to diagnostic or prognostic approaches to meta-analysis), we focused on meta-analy-sis of controlled trials and cohort or case-control studies.
In these studies, outcome differences between exposed or treated and non-exposed or untreated groups are com-pared to assess a causal relationship between the determi-nant (treatment or exposure) and an outcome (mortality or morbidity). As far as the program structure was con-cerned, our a priori idea was to create an add-in for Excel. Although a rather unorthodox approach in this area (all existing meta-analysis programs are stand-alone programs and work independently of Microsoft Office), Excel pro-vides a sophisticated calculation and graphics platform that is well-suited to many meta-analytical methods and at the programmer's disposal before any programming is done. Consequently, development and maintenance is relatively easy and costs can be kept to a minimum (one of the main aims in our program development). Further-more, the spreadsheet environment of Microsoft Excel is familiar to almost all researchers in medical, social, and economical sciences, which was very much in line with our attempt to develop a package that is fit for beginning researchers. Although we realized that even recent ver-sions of Excel can be inaccurate with regard to some statis-tical calculations [21-23], we were confident that we could program around these difficulties if necessary.
Since we wanted to move beyond the occasional spread-sheet that can perform meta-analytical calculations, we started by designing a programming structure in which the already existing Excel functionality could be exploited to its maximum. Sophisticated procedures were custom-programmed with Visual Basic in the Visual Basic for Applications (VBA) editor of Excel 2003 (and tested in Excel 2000 and onward). The so-called front-loader (a start-up program initiated with an icon) and some small assistant programs, all being non-Excel entities, were developed with Visual Basic 6.0 (VB6).
Program architecture and operation
The current version of the program (version 1.5) is still only compatible with Windows operating systems run-ning Excel 2000 or later, but versions for use with Excel on Macintosh and Linux are in preparation. The descriptions below apply to the Windows version, though most of it can be extended to future versions for other operating sys-tems.
Installation is made easy with a set-up program that installs the necessary files in a folder that can be specified by the user (default is C:\Program Files\MIX). It will also create a MIX item in the Windows Start Menu (installing additional start-up icons on the Desktop or in the Quick-Launch bar is optional) and provides the option to start a
Flash®-based program introduction. The MIX menu item
add-in, and a folder with educational programs and infor-mation. Loading the small MIX add-in that is supplied with the main program (typically automatically loaded during installation) results in a MIX menu-item under the Tools menu in Excel. This MIX menu contains several functions that can be accessed when the MIX program itself is not running. The files that form the core of the program are recognizable by their Mix file extension (*.mix) and currently contain approximately 16,000 lines of command code in 26 code modules and 17 custom user forms. These core files take up approximately 22 Mb of space on a hard-disk and their primary functions are (A) running interface procedures, (B) showing and manipulating output, (C) performing analyses, and finally (D) exporting and communicating with external files and programs. One of the core files is a large Excel workbook with 23 worksheets that forms the calculation engine of the program. It contains 6 sheets with primarily worksheet formulas and 10 sheets with various kinds of pre-calculated graphical and numerical results from meta-analytical tests. The remaining sheets contain information for help functions or programming purposes. This Excel
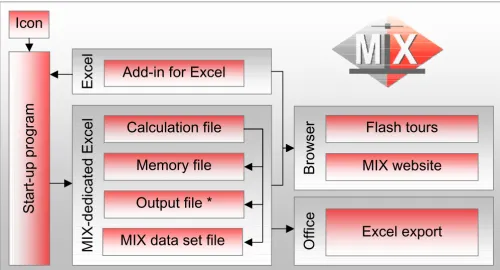
workbook remains hidden from the users at all times. Fig-ure 2 gives a graphical representation of the full program structure.
At start-up, a dedicated instance (an independent fully functional running program) of Excel is created and becomes visible once all regular Excel menus and toolbars are hidden and replaced by the MIX graphical interface. The Excel instance used by MIX is secured for exclusive use by the MIX program and does not interfere with existing Excel windows or settings.
The interface consists of a menu bar, two toolbars, and several shortcut menus. The menu bar and toolbar are directly accessible and the shortcut menus pop up with a right click of the mouse. The MIX menu bar has eight main menus (File, Edit, View, Numerical Output, Graph-ical Output, Analysis, and Help) via which all functions of the MIX program can be executed. Most of the common functions require only a single click on the toolbars. Dou-ble clicking graph items skips the shortcut menu and directly provides options for changing the graph item's
Structure of the MIX program Figure 2
Structure of the MIX program. The MIX program is started by simply clicking the MIX icon on the desktop or in the Win-dows Start Menu. The program uses a number of Excel workbooks, of which only the output file (*) is directly accessible by the user. Via the custom interface, several educational features can be accessed and custom meta-analysis reports can be pro-duced.
Icon
Start-up program
MIX-dedicated Excel
Memory file
Output file *
Calculation file
Browser
Flash tours
MIX website
Office
Excel export
Excel
Add-in for Excel
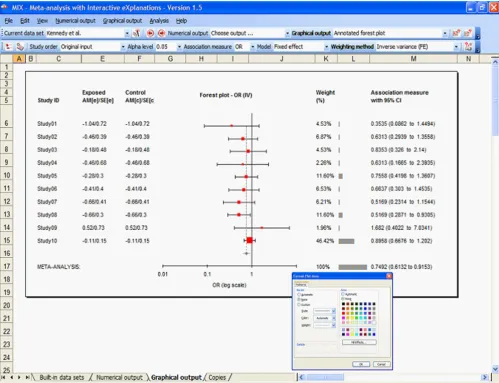
format. Figure 3 shows the MIX program's user-interface with a forest plot and a format box to change the graph's format.
The MIX program provides several options for importing or creating data sets for meta-analysis. The most conven-ient option is to create an Excel or CSV file with data (standard output option in Excel) and import this file into the MIX program. The variable ranges are then selected in Excel-manner to create a data set (see figure 4), which is subsequently loaded for analysis and optionally saved as a MIX data set file (*.mxd). The program accepts descrip-tive data from studies with continuous outcomes, e.g. sample size, mean, standard deviation, and dichotomous
outcomes, e.g. group sizes and event numbers (two-by-two table data). Comparative data can also be loaded by means of association measures with their standard error. Initially, however, it is not necessary to make a data set since 19 data sets from the most authoritative books on the subject ("Meta-analysis in Medical Research" by Sut-ton et al [10], "Systematic Reviews in Health Care, Meta-Analysis in Context" by Egger et al [6], and Systematic Reviews in Health Care, A Practial Guide by Glasziou et al [7]) have been included in the program. Most analyses and graphs presented in these books can be reproduced with a few clicks and the program can be used as a learn-ing or teachlearn-ing companion to these books. We hope to support more more books in this way in the future. In
The MIX program's graphical interface with a forest plot Figure 3
addition, the MIX website also contains a data set reposi-tory where users can contribute and download MIX data sets.
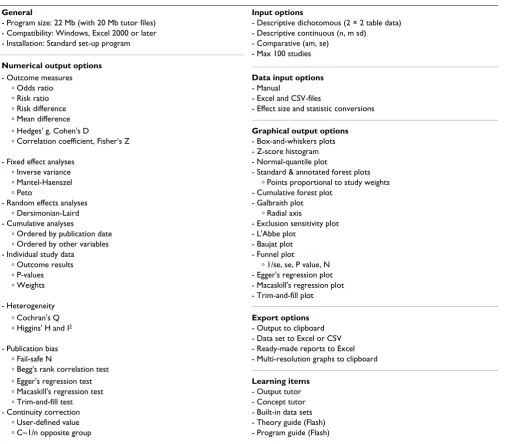
A large variety of numerical and graphical output can be produced by the program. Besides the association meas-ure values from the meta-analysis, several formal tests for heterogeneity, small study effects (publication bias), sin-gle study influence, and cumulative trends are also availa-ble in MIX. The graphical output is particularly comprehensive, with no less than eighteen informative plots that can be formatted in detail.
Possible association measures from continuous outcome data input are mean difference (MD), Hedges' g (HG), and Cohen's d (CD), analyzed by inverse variance fixed or
random effects models. Data from studies with dichoto-mous outcomes can be analyzed with a risk difference (RD), risk ratio (RR), or odds ratio (OR), weighted by inverse variance, Mantel-Haenszel, Peto (only odds ratio), or Dersimonian-Laird approaches. Analyses based on cor-relation coefficients or Fisher's Z are also possible, though only if the data are provided as comparative input, e.g. the association measures itself with their standard error. If correlation or effect size data are not in this format, they can be transformed via the MIX Statistics Converter that comes with the program. Table 1 gives an overview of the general features and the numerical and graphical methods in version 1.5 of the MIX program.
The most important educational features are the pro-gram's Output Tutor and Concept Tutor. Both are
interac-Creation of a data set with the MIX program Figure 4
tive dialog boxes that provide information about epidemiological and statistical concepts and tests. The Output Tutor changes with each analysis and always explains tests and results that are displayed or changed at the very moment. Additional teaching material includes a
Flash®-based Theory Tour that explains the fundamentals
of systematic reviews and meta-analyses and a Program Tour that shows the basics of how to use the program. The educational materials take up approximately 25 Mb and can also be downloaded separately.
To increase program stability and prevent users from acci-dentally altering the Visual Basic procedures, the source
code cannot be accessed while the program is running. Codes to unlock the VBA modules are provided by the first author upon request.
Validation
Version 9.2 of STATA [24], and more specifically version
1.81 of the metan program [25], version 1.2.4 of the
meta-bias program [26], and version 1.0.5 of the metatrim pro-gram [27] were used as the general reference standards for most tests. Details on the development of these user-writ-ten programs themselves can be found in the STATA Tech-nical Bulletins [25-27]. The meta-analysis software Comprehensive Meta-Analysis (CMA) version 2 [28] was Table 1: Overview of the MIX program's features
General Input options
- Program size: 22 Mb (with 20 Mb tutor files) - Descriptive dichotomous (2 × 2 table data) - Compatibility: Windows, Excel 2000 or later - Descriptive continuous (n, m sd)
- Installation: Standard set-up program - Comparative (am, se) - Max 100 studies
Numerical output options
- Outcome measures Data input options
ⴰ Odds ratio - Manual
ⴰ Risk ratio - Excel and CSV-files
ⴰ Risk difference - Effect size and statistic conversions ⴰ Mean difference
ⴰ Hedges' g, Cohen's D Graphical output options
ⴰ Correlation coefficient, Fisher's Z - Box-and-whiskers plots - Z-score histogram - Fixed effect analyses - Normal-quantile plot
ⴰ Inverse variance - Standard & annotated forest plots ⴰ Mantel-Haenszel ⴰ Points proportional to study weights
ⴰ Peto - Cumulative forest plot
- Random effects analyses - Galbraith plot
ⴰ Dersimonian-Laird ⴰ Radial axis
- Cumulative analyses - Exclusion sensitivity plot ⴰ Ordered by publication date - L'Abbe plot
ⴰ Ordered by other variables - Baujat plot - Individual study data - Funnel plot
ⴰ Outcome results ⴰ 1/se, se, P value, N
ⴰ P-values - Egger's regression plot
ⴰ Weights - Macaskill's regression plot
- Trim-and-fill plot - Heterogeneity
ⴰ Cochran's Q Export options
ⴰ Higgins' H and I2 - Output to clipboard
- Data set to Excel or CSV - Publication bias - Ready-made reports to Excel
ⴰ Fail-safe N - Multi-resolution graphs to clipboard ⴰ Begg's rank correlation test
ⴰ Egger's regression test Learning items
ⴰ Macaskill's regression test - Output tutor ⴰ Trim-and-fill test - Concept tutor - Continuity correction - Built-in data sets
ⴰ User-defined value - Theory guide (Flash) ⴰ C~1/n opposite group - Program guide (Flash)
used for validation of the Fail-safe N output and to double check the results of the other tests. Two investigators (LB, LMY) performed the validation independently with the MIX program (version 1.5 running in Excel 2003) and the reference standard(s) by analyzing eight data sets from meta-analyses that have been published in major journals [4,29-35].
The data sets represent three of the most often used types of data for meta-analysis in health care research: 1) descriptive data for dichotomous outcomes, 2) descriptive data for continuous outcomes, and 3) comparative (asso-ciation measure) data. For all three data types we chose a relatively small (less than 10 studies) and large data set (more than 20 studies) and we used two extra data sets in the 'descriptive dichotomous' category (one representing a meta-analysis of substantially heterogeneous studies and one with a rare event). The data sets are summarized
in table 2. The tests that were subject to the validation pro-cedures are shown in table 3. The items include individual study association measures, combined association meas-ures, and several heterogeneity and small study effect assessments. Whenever applicable, p-values and/or confi-dence intervals were also compared.
Results from the analyses of the eight data sets with MIX and the reference software were entered independently in identical custom-made spreadsheets. These spreadsheets were later compared in separate analysis sheets that used a cell-based formula to check for discrepancies of results up to 4 decimals.
Results and Discussion
In summary, we have been able to achieve our objective of developing a comprehensive and yet free program for meta-analysis. The Excel platform, although not without problems, has proved to be flexible enough to create an easy-to-use, and graphically and numerically comprehen-sive program.
In its current state (version 1.5) all results from the MIX program are identical (up to 4 decimals minimally) to
results from the most recent versions of the metan,
meta-bias, and metatrim commands in STATA. The small study
effect regression test by Macaskill [36] that was tested via
STATA's regress command also turned out to be accurate.
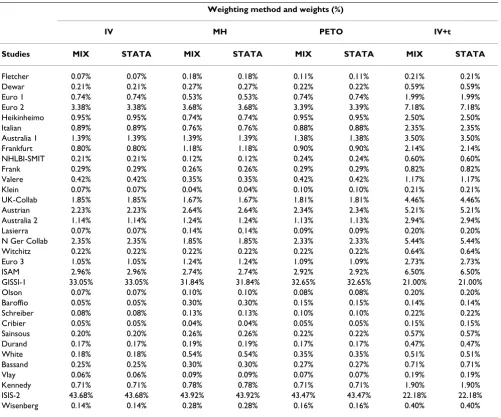
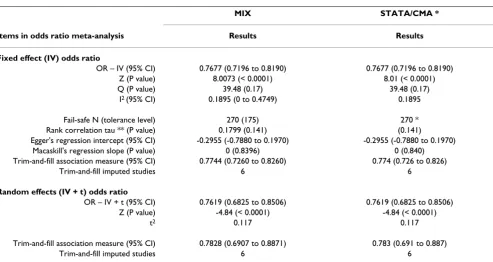
Table 4 and 5 are examples of the odds ratio validation results for data set 1 [4].
With regard to the trim-and-fill analysis [37], the MIX pro-gram allows for calculations using the weighting method applied in the original meta-analysis, whereas both CMA and STATA use only fixed or random effects inverse vari-ance methods when trimming and filling. While the cal-culations in MIX for trim-and-fill analyses with other weighting methods were verified manually and we have no reason to believe anything is wrong, we recommend using the inverse variance methods until more is known about approaches with alternative weighting.
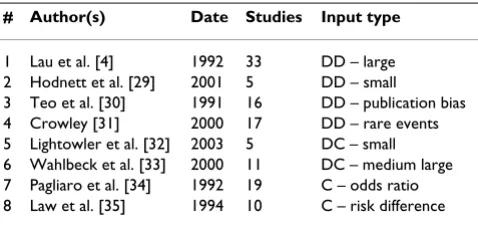
Although we are in the process of completing a formal software comparison project, we are confident that the MIX program can compete in many respects (usability, analytical options, comprehensiveness, and export options) with most of the existing meta-analysis programs like Comprehensive Meta-Analysis [28], MetaWin [38], RevMan [39], or WEasyMA [40]. However, there are also still some limitations. One is the maximum number of studies that can be analyzed in the meta-analysis, which is now 100. Though systematic reviews finding 100 studies for analysis are still very rare, this is something that may change in the future. Furthermore, while sub-group anal-yses are easy to perform within MIX, they are currently not Table 2: Overview of the data sets used in the validation
# Author(s) Date Studies Input type
1 Lau et al. [4] 1992 33 DD – large 2 Hodnett et al. [29] 2001 5 DD – small
3 Teo et al. [30] 1991 16 DD – publication bias 4 Crowley [31] 2000 17 DD – rare events 5 Lightowler et al. [32] 2003 5 DC – small 6 Wahlbeck et al. [33] 2000 11 DC – medium large 7 Pagliaro et al. [34] 1992 19 C – odds ratio 8 Law et al. [35] 1994 10 C – risk difference
The validation was done with eight data sets from meta-analysis that have been published in major peer-reviewed journals. The data sets were selected to represent a wide spectrum of potential input for meta-analysis. Abbreviations: "DD" = descriptive data for
dichotomous outcomes (two-by-two table data), "DC" = descriptive data for continuous outcomes (means with their standard deviations and sample sizes), and "C" = comparative data (association measures with standards error or confidence intervals).
Table 3: Meta-analytical tests that were part of the validation
Study data (per association measure/weighting)
- Association measure with 95% CI and/or P value - Study contribution weights
Meta-analysis (per association measure/weighting)
- Association measure with 95% CI and P value - Heterogeneity Q with 95% CI and/or P value - Inconsistency I2 with 95% CI and/or P value
- Fail-safe N with tolerance level
- Begg's rank correlation test with z-score and P value - Egger's regression intercept with 95% CI and/or P value - Macaskill's regression slope with 95% CI and/or P value - Trim-and-fill studies with new association measure and 95% CI
automated and during a group analysis not all sub-groups can be shown simultaneously in a single forest plot. The subgroup forest plot can however be created manually because the Excel graphs of individual forest plots are relatively easily formatted and stacked. We intend to improve the program with regard to these limi-tations in the near future.
Another important issue that we will focus on in upcom-ing updates is meta-regression. Although some univaria-ble regression methods are integrated in the tests for small study effects, the MIX program can currently not perform
meta-regression. We realize that meta-regression, espe-cially with multiple independent variables, is a valuable tool for assessing heterogeneity and adapting a meta-anal-ysis accordingly, but it requires matrix calculations that are far more difficult to program in Excel or VBA than the standard tests. Currently, univariable meta-regression is possible with Comprehensive Meta-Analysis [28] and MetaWin [38]. However, like all dedicated meta-analysis packages they lack the option for multivariable regression. We have started working on facilities for meta-regression within the MIX program and we hope it will be integrated sometime in 2007.
Table 4: Individual study weighting validation with data set 1
Weighting method and weights (%)
IV MH PETO IV+t
Studies MIX STATA MIX STATA MIX STATA MIX STATA
Fletcher 0.07% 0.07% 0.18% 0.18% 0.11% 0.11% 0.21% 0.21%
Dewar 0.21% 0.21% 0.27% 0.27% 0.22% 0.22% 0.59% 0.59%
Euro 1 0.74% 0.74% 0.53% 0.53% 0.74% 0.74% 1.99% 1.99%
Euro 2 3.38% 3.38% 3.68% 3.68% 3.39% 3.39% 7.18% 7.18%
Heikinheimo 0.95% 0.95% 0.74% 0.74% 0.95% 0.95% 2.50% 2.50%
Italian 0.89% 0.89% 0.76% 0.76% 0.88% 0.88% 2.35% 2.35%
Australia 1 1.39% 1.39% 1.39% 1.39% 1.38% 1.38% 3.50% 3.50%
Frankfurt 0.80% 0.80% 1.18% 1.18% 0.90% 0.90% 2.14% 2.14%
NHLBI-SMIT 0.21% 0.21% 0.12% 0.12% 0.24% 0.24% 0.60% 0.60%
Frank 0.29% 0.29% 0.26% 0.26% 0.29% 0.29% 0.82% 0.82%
Valere 0.42% 0.42% 0.35% 0.35% 0.42% 0.42% 1.17% 1.17%
Klein 0.07% 0.07% 0.04% 0.04% 0.10% 0.10% 0.21% 0.21%
UK-Collab 1.85% 1.85% 1.67% 1.67% 1.81% 1.81% 4.46% 4.46%
Austrian 2.23% 2.23% 2.64% 2.64% 2.34% 2.34% 5.21% 5.21%
Australia 2 1.14% 1.14% 1.24% 1.24% 1.13% 1.13% 2.94% 2.94%
Lasierra 0.07% 0.07% 0.14% 0.14% 0.09% 0.09% 0.20% 0.20%
N Ger Collab 2.35% 2.35% 1.85% 1.85% 2.33% 2.33% 5.44% 5.44%
Witchitz 0.22% 0.22% 0.22% 0.22% 0.22% 0.22% 0.64% 0.64%
Euro 3 1.05% 1.05% 1.24% 1.24% 1.09% 1.09% 2.73% 2.73%
ISAM 2.96% 2.96% 2.74% 2.74% 2.92% 2.92% 6.50% 6.50%
GISSI-1 33.05% 33.05% 31.84% 31.84% 32.65% 32.65% 21.00% 21.00%
Olson 0.07% 0.07% 0.10% 0.10% 0.08% 0.08% 0.20% 0.20%
Baroffio 0.05% 0.05% 0.30% 0.30% 0.15% 0.15% 0.14% 0.14%
Schreiber 0.08% 0.08% 0.13% 0.13% 0.10% 0.10% 0.22% 0.22%
Cribier 0.05% 0.05% 0.04% 0.04% 0.05% 0.05% 0.15% 0.15%
Sainsous 0.20% 0.20% 0.26% 0.26% 0.22% 0.22% 0.57% 0.57%
Durand 0.17% 0.17% 0.19% 0.19% 0.17% 0.17% 0.47% 0.47%
White 0.18% 0.18% 0.54% 0.54% 0.35% 0.35% 0.51% 0.51%
Bassand 0.25% 0.25% 0.30% 0.30% 0.27% 0.27% 0.71% 0.71%
Vlay 0.06% 0.06% 0.09% 0.09% 0.07% 0.07% 0.19% 0.19%
Kennedy 0.71% 0.71% 0.78% 0.78% 0.71% 0.71% 1.90% 1.90%
ISIS-2 43.68% 43.68% 43.92% 43.92% 43.47% 43.47% 22.18% 22.18%
Wisenberg 0.14% 0.14% 0.28% 0.28% 0.16% 0.16% 0.40% 0.40%
Finally, because we are still frequently updating the pro-gram and including new features, we have postponed the making of a hard-copy manual or methods guide until this process has stabilized.
Conclusion
The MIX program provides researchers, students, and lec-turers with a free tool to perform state-of-the-art meta-analyses and learn or teach about what it is they are doing. It uses an innovative approach with Excel as a computing platform and even provides some numerical and graphi-cal output that is not provided by other software. Results from version 1.5 of the MIX program are identical to those from STATA, and MIX can be regarded as a comprehensive and valid tool for performing causal meta-analyses.
Availability and requirements
Project name: MIX
Project homepage: http://www.mix-for-meta-analy sis.info or http://www.sourceforge.net/projects/meta-analysis/
Operating system(s): Microsoft Windows Programming language: Visual Basic (VB6, VBA)
Other requirements: Microsoft Excel 2000 or later License: Open Source, free
Competing interests
The author(s) declare that they have no competing inter-ests.
Authors' contributions
LB designed and developed the MIX program, under supervision of NI and HT and with testing by and recom-mendations from all authors. The validation was per-formed by LB and LY and supervised by KGM. LB drafted the manuscript and all authors participated in the writing.
Acknowledgements
The development and validation of the MIX program was supported by a one-year grant from the Graduate School of Medical Sciences of Kitasato University, # 3042. We are furthermore grateful to all members of the Department of Medical Informatics at Kitasato University for the stimulat-ing discussions durstimulat-ing the project.
References
1. Oxford-Center for Evidence Based Medicine, Levels of Evi-dence and Grades of Recommendation [http://www.cebm.net/ levels_of_evidence.asp]
2. Yusuf S, Cairns J, Camm A, Fallen E, Gersh B: Evidence-Based Cardiology
London: BMJ Publishing Group; 1998. Table 5: Summary of the validation with data set 1
MIX STATA/CMA *
Items in odds ratio meta-analysis Results Results
Fixed effect (IV) odds ratio
OR – IV (95% CI) 0.7677 (0.7196 to 0.8190) 0.7677 (0.7196 to 0.8190) Z (P value) 8.0073 (< 0.0001) 8.01 (< 0.0001)
Q (P value) 39.48 (0.17) 39.48 (0.17)
I2 (95% CI) 0.1895 (0 to 0.4749) 0.1895
Fail-safe N (tolerance level) 270 (175) 270 * Rank correlation tau ** (P value) 0.1799 (0.141) (0.141)
Egger's regression intercept (95% CI) -0.2955 (-0.7880 to 0.1970) -0.2955 (-0.7880 to 0.1970) Macaskill's regression slope (P value) 0 (0.8396) 0 (0.840) Trim-and-fill association measure (95% CI) 0.7744 (0.7260 to 0.8260) 0.774 (0.726 to 0.826)
Trim-and-fill imputed studies 6 6
Random effects (IV + t) odds ratio
OR – IV + t (95% CI) 0.7619 (0.6825 to 0.8506) 0.7619 (0.6825 to 0.8506) Z (P value) -4.84 (< 0.0001) -4.84 (< 0.0001)
t2 0.117 0.117
Trim-and-fill association measure (95% CI) 0.7828 (0.6907 to 0.8871) 0.783 (0.691 to 0.887)
Trim-and-fill imputed studies 6 6
Publish with BioMed Central and every scientist can read your work free of charge "BioMed Central will be the most significant development for disseminating the results of biomedical researc h in our lifetime."
Sir Paul Nurse, Cancer Research UK
Your research papers will be:
available free of charge to the entire biomedical community
peer reviewed and published immediately upon acceptance
cited in PubMed and archived on PubMed Central
yours — you keep the copyright
Submit your manuscript here:
http://www.biomedcentral.com/info/publishing_adv.asp
BioMedcentral
3. Yusuf S, Zucker D, Peduzzi P, Fisher L, Takaro T, Kennedy J, Davis K, Killip T, Passamani E, Norris R, et al.: Effect of coronary artery bypass graft surgery on survival: overview of 10-year results from randomised trials by the Coronary Artery Bypass Graft Surgery Trialists Collaboration. Lancet 1994, 344(8922):563-70.
4. Lau J, Antman E, Jimenez-Silva J, Kupelnick B, Mosteller F, Chalmers T: Cumulative meta-analysis of therapeutic trials for myo-cardial infarction. N Engl J Med 1992, 327(4):248-54.
5. The Cochrane Collaboration [http://www.cochrane.org] 6. Egger M, Davey Smith G, Altman D: Systematic Reviews in Health Care:
Meta-Analysis in Context London: BMJ Publishing Group; 2001. 7. Glasziou P, Irwig L, Bain C, Colditz G: Systematic Reviews in Health
Care: A Practical Guide Cambridge: Cambridge University Press; 2001. 8. Petitti D: Meta-Analysis, Decision Analysis, and Cost-Effectiveness Analysis: Methods for Quantitative Synthesis in Medicine second edition. Oxford: Oxford University Press; 2000.
9. Stangle D, Berry D: Meta-analysis in Medicine and Health Policy New York: Marcel Dekker; 2000.
10. Sutton A, Abrams K, Jones D, Sheldon T, Song F: Methods for Meta-Analysis in Medical Research Chichester: Wiley; 2000.
11. Whitehead A: Meta-Analysis of Controlled Clinical Trials Chichester: Wiley; 2002.
12. Egger M, Sterne J, Smith G: Meta-analysis software. BMJ 1998, 316(7126): [http://bmj.bmjjournals.com/archive/7126/7126ed9.htm]. 13. Normand S: Meta-analysis software – a comparative review –
DSTAT, version 1.10. Am Statistician 1995, 49:298-309. 14. Sterne J, Egger M, Sutton A: Meta-analysis software. In Systematic
Reviews in Health Care: Meta-Analysis in Context 2nd edition. Edited by: Egger M, Davey Smith G, Altman D. London: BMJ Books; 2001. 15. Sutton A, Lambert P, Hellmich M, Abrams K, Jones D: Meta-analysis
in practice: A critical review of available software. In Meta-Analysis in Medicine and Health Policy Edited by: Berry D, Stangl D. New York: Marcel Dekker; 2000.
16. Bax L, Ikeda N, Shirataka M, Takeuchi A: Explaining common meta-analytic statistics in Japan with a simple Excel add-in. In The 24th Joint Conference on Medical Informatics Nagoya, Japan; 2004. 17. Bax L, Ikeda N: Explaining and performing common meta-ana-lytic procedures in Japan: development of bilingual interac-tive software. In The 12th Cochrane Colloquium Ottawa, Canada; 2004.
18. Bax L, Tsuruta H, Ikeda N, Takeuchi A, Shirataka M: The MIX pro-gram, free software for learning, teaching, and exploring meta-analysis with Excel. The 13th Cochrane Colloquium, Mel-bourne, Australia 2005.
19. Bax L, Tsuruta H, Shirataka M, Takeuchi A, Ikeda N: The MIX pro-gram, an active way of learning about meta-analysis with Excel. International Symposium: Systematic Review and Meta-Analysis, Wako, Japan 2005.
20. Meta-analysis with Interactive explanations [http://www.mix-for-meta-analysis.info]
21. Knusel L: On the accuracy of statistical distributions in Micro-soft Excel 2003. Comput Statist Data Anal 2005, 48(3):445-449. 22. McCullough B, Wilson B: On the accuracy of statistical
proce-dures in Microsoft Excel 2000 and Excel XP. Comput Statist Data Anal 2002, 40:713-721.
23. McCullough B, Wilson B: On the accuracy of statistical proce-dures in Microsoft Excel 2003. Comput Statist Data Anal 2005, 49(4):1244-1252.
24. StataCorp: Stata Statistical Software, Release 9 College Station, TX: StataCorp LP; 2005.
25. Bradburn M, Deeks J, Altman D: Metan – an alternative meta-analysis command (Metan 1.81). Stata Technical Bulletin 2003, STB 44(sbe24):4-15.
26. Steichen T: Tests for publication bias in meta-analysis (Meta-bias 1.2.4). Stata Journal 2003, SJ3-4(sbe19_5):11.
27. Steichen T: Nonparametric trim and fill analysis of publication bias in meta-analysis (Metatrim 1.0.5). Stata Technical Bulletin
2003, STB61(sbe39.2):11.
28. Borenstein M, Hedges L, Higgins J, Rothstein H: Comprehensive Meta-Analysis Version 2 Engelwood, NJ: Biostat; 2005.
29. Hodnett E: Caregiver support for women during childbirth.
Cochrane Database Syst Rev 2000:CD000199.
30. Teo K, Yusuf S, Collins R, Held P, Peto R: Effects of intravenous magnesium in suspected acute myocardial infarction: over-view of randomised trials. Bmj 1991, 303(6816):1499-503.
31. Crowley P: Interventions for preventing or improving the out-come of delivery at or beyond term. Cochrane Database Syst Rev
2000:CD000170.
32. Lightowler J, Wedzicha J, Elliott M, Ram F: Non-invasive positive pressure ventilation to treat respiratory failure resulting from exacerbations of chronic obstructive pulmonary dis-ease: Cochrane systematic review and meta-analysis. Bmj
2003, 326(7382):185.
33. Wahlbeck K, Cheine M, Essali M: Clozapine versus typical neu-roleptic medication for schizophrenia. Cochrane Database Syst Rev 2000:CD000059.
34. Pagliaro L, D'Amico G, Sorensen T, Lebrec D, Burroughs A, Morabito A, Tine F, Politi F, Traina M: Prevention of first bleeding in cir-rhosis. A meta-analysis of randomized trials of nonsurgical treatment. Ann Intern Med 1992, 117:59-70.
35. Law M, Wald N, Thompson S: By how much and how quickly does reduction in serum cholesterol concentration lower risk of ischaemic heart disease? Bmj 1994, 308(6925):367-72. 36. Macaskill P, Walter S, Irwig L: A comparison of methods to
detect publication bias in meta-analysis. Stat Med 2001, 20(4):641-54.
37. Duval S, Tweedie R: Trim and fill: A simple funnel-plot-based method of testing and adjusting for publication bias in meta-analysis. Biometrics 2000, 56(2):455-63.
38. Rosenberg M, Adams D, Gurevitch J: MetaWin: Statistical Software for Meta-Analysis Version 2 Sunderland, Massachusetts: Sinauer Associates; 2000.
39. The Nordic Cochrane Centre: Review Manager (RevMan) Version 4.2 for Windows Copenhagen: The Cochrane Collaboration; 2003. 40. Chevarier P, Cucherat M, Freiburger T, Maupas J, Visele N, Bugnard
F, Bazog P: WeasyMA Lyon: ClinInfo; 2000.
Pre-publication history
The pre-publication history for this paper can be accessed here: