in the population sciences published by the Max Planck Institute for Demographic Research Konrad-Zuse Str. 1, D-18057 Rostock · GERMANY www.demographic-research.org
DEMOGRAPHIC RESEARCH
VOLUME 19, ARTICLE 4, PAGES 47-72
PUBLISHED 01 JULY 2008
http://www.demographic-research.org/Volumes/Vol19/4/ DOI: 10.4054/DemRes.2008.19.4
Research Article
Overview Chapter 2:
Parity distribution and
completed family size in Europe:
Incipient decline of the two-child family model?
Tomas Frejka
This publication is part of Special Collection 7: Childbearing Trends and Policies in Europe (http://www.demographic-research.org/special/7/)
© 2008 Frejka.
1 Introduction 48
2 The data 48
3 Family size trends 49
3.1 Northern and Western Europe 49
3.2 Southern Europe 52
3.3 Central and Eastern Europe 56
3.4 The entire continent and the overall picture 57 3.5 Cohorts completing childbearing early in the 21st century 62
4 Parity progression ratios (PPRs) 63
4.1 Northern, Western and Southern Europe (in short, the “West”) 64 4.2 Central and Eastern Europe (in short, the “East”) 65
5 Conclusions 70
Overview Chapter 2:
Parity distribution and completed family size in Europe:
Incipient decline of the two-child family model?
1Tomas Frejka2
Abstract
By the end of the 20th century the two-child family became the norm throughout Europe. Between 40 and over 50 percent of women in the 1950s and 1960s cohorts had two children. There were some incipient signs that shares of two-child families were declining, especially in Central and Eastern and Southern Europe. An increase in childlessness among recent generations was an almost universal trend. The increase in proportions of one-child families was prominent in CEE and in SE. Wherever shares of childless women and of women with one child continue to grow, the obvious result will be entrenched below replacement fertility. Much depends on progression ratios to first and to second births. In CEE mainly the progression ratios to second births are declining. In the Nordic countries progression ratios to first and to second births were relatively stable and even more so in France. Altogether, most people opt for two children, very few for three or more, the frequency of the one-child family is increasing as are the proportions of people remaining childless. The latter trends were more pronounced in Southern, Central and Eastern Europe and not so much in Northern and Western countries.
1 In this chapter the terms “parity” and “family size” will be used interchangeably. This is not an accurate use of the term “family size,” but it has become customary in this context and means the number of children borne by women irrespective of partnership status.
1. Introduction
From the middle of the 19th through the second half of the 20th century, the prevailing “large family” model of three or more children was gradually replaced by the two-child family. A diverse set of social, economic, political and cultural developments generated this process. Improved standards of living, advances in public sanitation, and increasing attention to personal hygiene were among the important conditions of declining mortality, particularly due to a drop in infant mortality, which was one reason for the decline in childbearing. Rising costs and declining benefits of children and childrearing were additional reasons for parents of successive generations to have smaller numbers of children. Gender relationships were changing in society and in the family, with increasing proportions of women employed. At the same time, people’s economic aspirations and expectations, as well as their growing individualism, materialism, secularism and desire for personal self-fulfillment, were undermining the satisfaction derived from having children. These were among the principal conditions leading to small family size.
This chapter will explore in some detail the demographic developments that generated the two-child family model which prevailed throughout the developed countries by the end of the 20th century (see, for instance, van de Kaa 2001:316-318). A crucial contemporary issue is whether the two-child family norm will last, or whether it will be replaced by societies in which large proportions of parents will decide to have only one child, or no children at all.
The focus will be on actual completed family size distributions and trends. Analyses of desired or ideal family size are not included because these have been dealt with quite extensively in recent literature (for instance, Goldstein et al. 2003; Fokkema and Esveldt 2005; Testa 2006)
2. The data
Data used in the overview analysis are from the country chapters complemented by those of the Observatoire Démographique Européen. The pathways of constructing parity distributions depend on the data available in the respective country. They are derived from population censuses or from vital statistics. A combination of both sources can also be applied, and at times these sources can be supplemented by informed professional estimates. Population census-based parity distributions utilize data on women of individual ages who have completed childbearing by number of children ever born. Vital statistics-based parity distributions use single-year, age-specific cohort fertility rates by single-year cohorts and by individual birth order to compute birth order total cohort fertility rates. In the analysis four family-size categories were used: childless women, women with one child, women with two children, and women with three or more children.
Data were not available for all European countries; therefore only three groups were used. Criteria for creating these were geographic and substantive. In very general terms, the countries in the respective groups experienced common socioeconomic and political developments during the 20th century. The groups are:
Northern and Western Europe: Denmark, Norway, Sweden, France, England & Wales, Netherlands, Austria and West Germany (included only in Panel A of Figure 1).
Southern Europe: Greece, Italy, Spain, and Portugal
Central and Eastern Europe (formerly socialist countries): Czech Republic, Slovak Republic, Slovenia, Poland, Lithuania, Bulgaria, Romania, and Russian Federation
3. Family size trends
3.1 Northern and Western Europe
In the four family-size categories, several developments common to a number, often a majority, of countries stand out (Figure 1):
In the long run, the proportion of childless women experienced an extended decline that reached a low plateau among the 1930s cohorts; a subsequent reversal occurred, and shares of childless women reached 15 to nearly 30 percent in the 1960s cohorts.
percent. In subsequent cohorts, a renewed increase in childless women is taking place. Among cohorts completing their childbearing early in the 21st century, i.e., the birth cohorts of the early 1960s, the share of childless women in several countries, such as Austria, the Netherlands, England & Wales, and Sweden, was between 15 and 20 percent. In contrast, shares of childless women in Denmark and France were low, close to 10 percent.
In Western Germany, the precise proportion of childless women is not known, but there is no doubt that it was rising steeply among the 1960s cohorts (Figure 1, Panel A). Some authors estimated the childlessness share to be as high as 30 percent in the mid-1960s cohorts (Germany chapter; Dorbritz, Ruckdeschel 2007). To a significant degree, childlessness had become a matter of deliberate choice (Höpflinger 1991). Among young people in Western Germany, there are two main groups: “those who live with children and as a rule are also married, as opposed to those who have chosen not to have children, the vast majority of whom do not marry” (Germany chapter). Low fertility has become a matter of considerable concern to the German government, which has started to implement policy measures aimed at creating incentives and conditions that encourage childbearing (Auth 2006; Prskawetz et al. 2006).
The principal reasons for the relatively high levels of childlessness among the cohorts born around 1900, and among those of the 1960s, were very different. Quite large proportions of women born in the late 19th and early 20th centuries remained single, and almost all of these did not have children. In part this was due to the large number of young men killed during the First World War (Germany chapter). Also, the unusually severe consequences of the Great Depression of the 1930s were reflected in generally low levels of fertility and high rates of childlessness. Relatively frequent childlessness in recent decades is related to the complex changes that have taken place as young women spend more time acquiring advanced education as well as building up their careers, and thus having to cope with the tensions between working and childrearing. The above reasoning often applies equally to other countries, and these developments are discussed in greater detail in the country chapters and in overview chapters 4, 5, and 6.
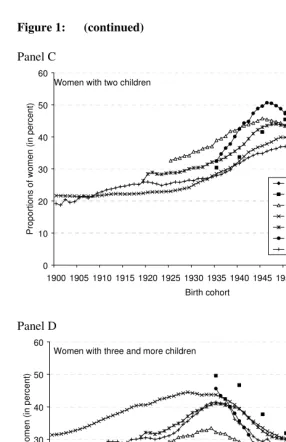
The two-child family became the norm following a steady long-term increase that reached a saturation point approximately with the birth cohorts born around 1950 (Figure 1, Panel C).
reality and in the general perception of the public. In almost all populations of Northern and Western Europe, a slight decline followed, and the shares of women with two children were clustered to a remarkable extent around 40 percent in the 1960s birth cohorts.
A less pronounced, and shorter-lived, increase in the shares of large families with three or more children occurred up to the prime baby boom cohorts of the 1930s; this was followed by a decline and stabilization (Figure 1, Panel D).
A more detailed analysis of large families indicates that the decline in the shares of families with four and more children was much faster than the decline in families with three children (not shown here). In Austria, for instance, large families decreased by 75 percent between the 1935 and the 1965 cohorts, and constituted about five percent of all families in the mid-1960s birth cohort. The share of the three-child family had declined by a mere 22 percent, with an almost stable 15 percent share of all families in the mid-1960s cohorts (Austria chapter).
Contrary to general perception, proportions of one-child families hardly changed over time, with quite a wide variation between countries (Figure 1, Panel B).
For the time being, the one-child family is not a very common choice in most Northern and Western European countries. In the Sweden chapter it is noted that “having only one child is a rarely chosen family pattern.”
3.2 Southern Europe
The time series for Southern European populations are shorter than for the other countries, but commonalities in parity distribution trends can be detected nevertheless (Figure 2).
Among the cohorts of the late 1940s and 1950s, the proportions of childless women were low, around 10 percent. These have been increasing among the cohorts of the 1960s (Figure 2, Panel A), although the absolute values of the percentages for the youngest cohorts in the available time series are probably higher than in reality3 (Sobotka 2004, chapter 5). But the trend of growth is the important aspect. The increase in childlessness has been the steepest in Italy, where, among the youngest cohorts, close to a fifth of all women apparently remain without children.
Indisputably, shares of one-child families have been on the increase starting with the cohorts born in the 1940s (Figure 2, Panel B). In the 1960s birth cohorts, about one-
Figure 1: Proportions of women, childless, or with one, two or three and more children, selected Northern and Western European countries, birth cohorts 1900-1965
Panel A Childless women 0 5 10 15 20 25 30 35
1900 1905 1910 1915 1920 1925 1930 1935 1940 1945 1950 1955 1960 1965 Birth cohort P ro p o rt io n s o f w o m e n ( in p e rc e n t) Denmark Norway Sweden France England &Wales Netherlands Austria West Germany Panel B
Women with one child
0 5 10 15 20 25 30 35
Figure 1: (continued)
Panel C
Women with two children
0 10 20 30 40 50 60
1900 1905 1910 1915 1920 1925 1930 1935 1940 1945 1950 1955 1960 1965 Birth cohort P ro p o rt io n s o f w o m e n ( in p e rc e n t) Denmark Norway Sweden France England &Wales Netherlands Austria Panel D
Women with three and more children
0 10 20 30 40 50 60
1900 1905 1910 1915 1920 1925 1930 1935 1940 1945 1950 1955 1960 1965 Birth cohort P ro p o rt io n s o f w o m e n ( in p e rc e n t) Denmark Norway Sweden France England &Wales Netherlands Austria
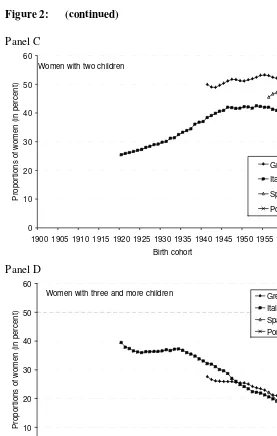
Figure 2: Proportions of women, childless, or with one, two or three and more children, selected Southern European countries, birth cohorts 1920-1965 Panel A Childless women 0 5 10 15 20 25 30 35
1900 1905 1910 1915 1920 1925 1930 1935 1940 1945 1950 1955 1960 1965 Birth cohort P ro p o rt io n s o f w o m e n ( in p e rc e n t) Greece Italy Spain Portugal Panel B
Women with one child
0 5 10 15 20 25 30 35
Figure 2: (continued)
Panel C
Women with two children
0 10 20 30 40 50 60
1900 1905 1910 1915 1920 1925 1930 1935 1940 1945 1950 1955 1960 1965 Birth cohort P ro p o rt io n s o f w o m e n ( in p e rc e n t) Greece Italy Spain Portugal Panel D
Women with three and more children
0 10 20 30 40 50 60
1900 1905 1910 1915 1920 1925 1930 1935 1940 1945 1950 1955 1960 1965 Birth cohort P ro p o rt io n s o f w o m e n ( in p e rc e n t) Greece Italy Spain Portugal
quarter of women in Italy and Spain had only one child. In Portugal, the proportion of one-child families was even higher; in Greece, lower.
The overwhelming majorities of women in the birth cohorts of the 1940s and 1950s had two children (Figure 2, Panel C). The two-child family was firmly established as the norm. An incipient decline in the percentages can be detected among the 1960s cohorts; in Italy, even among the cohorts of the late 1950s. The authors of the Italy chapter point out that, in the 1960 cohort, women with two children are outnumbered by the sum of mothers of an only child and of childless women.
The decline in the proportions of large families of three and more children was consistent in its direction, as were values for all the Southern European countries (Figure 2, Panel D). In Italy, the only country with a long time series, large families were still the norm among the 1920s cohorts, with almost a 40 percent share. The gradual decline started in the 1930s birth cohorts. Among the cohorts of the 1960s, less than 20 percent of women had large families. The trend direction indicates that this decline was still in progress among younger women.
3.3 Central and Eastern Europe
The countries for which data are available undoubtedly display common trends, yet at the same time there is a notably greater heterogeneity than in the other two regions (Figure 3).
Shares of childless women were apparently quite high in most of these countries among the cohorts born early in the 20th century (Figure 3, Panel A). These gradually declined to a level of around 10 percent and less. The low levels of childlessness were typical among the cohorts of the 1930s, and even more so among the 1940s and 1950s cohorts, essentially during the period of stable authoritarian rule. The childless shares started to increase among the cohorts of the 1960s. The rise in the shares of childless women is a recent phenomenon. The analyses in practically all the country chapters indicate that this growth is likely to continue in the foreseeable future.
rapidly thereafter, reaching three times that level among the 1920s cohorts. Starting with the cohorts of the mid-1930s, the proportion of one-child families has been notably higher in Russia than in any of the other countries. A considerable increase in one-child families occurred in the youngest cohorts, those born in the late 1950s and 1960s. Similar rates of growth of one-child families took place in all these countries among the youngest generations, but at lower levels (Figure 3, Panel B).
The two-child family experienced steady growth almost throughout the entire period of observation. The proportions were apparently between 10 and 30 percent among the cohorts born early in the 20th century, and increased to about 40 to 60 percent among the 1950s birth cohorts (Figure 3, Panel C). In most countries, the peak share was reached with the cohorts born around 1960. Among the cohorts of the 1960s, this proportion stabilized or experienced an incipient minor decline. The two-child family was firmly established as the norm. On average, it was as prevalent as the other three groups combined. In the Czech Republic, Slovenia and Bulgaria, the share of the two-child family was unusually high among the cohorts of the 1950s and early 1960s, 55 percent and higher.
In most countries of this region, shares of women with three or more children were slowly and steadily declining throughout almost the whole period of observation (Figure 3, Panel D). There were a few exceptions. In Bulgaria, a lower proportion of large families was already observable among cohorts of the 1930s. On the other hand, in Romania shares of large families increased, and were relatively high among the cohorts of the 1930s and 1940s as a result of the forceful pro-natalist policies of the Ceauşescu regime. In Poland, the relatively high proportion of women with large families remained unchanged for the cohorts of the late 1940s and the 1950s. In many countries, declines in shares of the large family were still continuing among the 1960s birth cohorts.
3.4 The entire continent and the overall picture
Based on the above exploration, answers to two crucial questions can be outlined:
What were the principal trends characterizing family size during the 20th century? Which changes in family size were important in shaping fertility trends?
Figure 3: Proportions of women, childless, with one, two or three and more children, selected Central and Eastern European countries, birth cohorts 1900-1965 Panel A Childless women 0 10 20 30 40
1900 1905 1910 1915 1920 1925 1930 1935 1940 1945 1950 1955 1960 1965 Birth cohort P ro p o rt io n s o f w o m e n ( in p e rc e n t) Czech Republic Slovak Republic Slovenia Poland Lithuania Bulgaria Romania Russian Federation Panel B
Women with one child
0 5 10 15 20 25 30 35 40
1900 1905 1910 1915 1920 1925 1930 1935 1940 1945 1950 1955 1960 1965 Birth cohort P ro p o rt io n s o f w o m e n ( in p e rc e n t)
Figure 3: (Continued)
Panel C
Women with two children
0 10 20 30 40 50 60 70 80
1900 1905 1910 1915 1920 1925 1930 1935 1940 1945 1950 1955 1960 1965 Birth cohort P ro p o rt io n s o f w o m e n ( in p e rc e n t) Czech Republic Slovak Republic Slovenia Poland Lithuania Bulgaria Romania Russian Federation Panel D
Women with three and more children
0 10 20 30 40 50 60 70 80
1900 1905 1910 1915 1920 1925 1930 1935 1940 1945 1950 1955 1960 1965 Birth cohort P ro p o rt io n s o f w o m e n ( in p e rc e n t) Czech Republic Slovak Republic Slovenia Poland Lithuania Bulgaria Romania Russian Federation
analysis, which precludes the possibility of learning about changes in family size during the most recent 10 to 15 years. It should also be noted that, while not all European countries were part of the analysis thus far, a sufficiently large number were included that these countries can be considered representative of the entire continent.
The most prominent feature in the development of parity distributions during the second half of the 20th century was the gradual ascension of the two-child family model, which established its undisputed reign notably among the cohorts of the 1950s. In virtually every country, the share of women with two children reached the 40 percent mark (Panels C, Figures 1, 2 and 3). In some populations, women with two children comprised the absolute majority of all families, i.e., over 50 percent constituted two-child families.
Among the 1950s, and more so among the 1960s, birth cohorts, signs of an incipient erosion of the two-child family model can be detected. In over half of the Central and Eastern European countries, and in the Southern European countries, there was a decline in the proportion of two-child families among these cohorts. We will return to this development below.
The decline in the shares of large families was another prevailing trend (panels D, Figures 1, 2 and 3). Detailed analyses show that it was mainly the proportions of really large families of four and more children that were declining (Country chapters; Frejka, Sardon 2004 and 2007). The shares of three-child families were decreasing at a moderate pace, and their proportions were stabilizing in some countries. There were also differing regional variants of the large family trends. In the Northern and Western European countries, there was an increase of large families in the middle of the 20th century, culminating among the baby boom cohorts born in the 1920s and 1930s. A rapid decline in large families followed, which ended among the 1950s cohorts. In the Southern, Central and Eastern European countries, the decline of large families was moderate and continuous.
industrialized countries, although the timing and the magnitude of this change varies across countries. … In the high-childlessness regions--especially West Germany and England & Wales--final childlessness among women born after 1970 is likely to come close to 25 percent and will almost certainly remain under 30 percent, while the more common levels will range between 15 and 22 percent.”
The prevalence of the one-child family was relatively large and growing in Central and Eastern European countries, as well as in Southern Europe. In most Northern and Western European countries, trends in the shares of the one-child family were flat and relatively low.
As indicated above, there were incipient signs of erosion of the two-child family norm. This could be observed mainly in the Central and Eastern European countries, whereas the two-child family norm appeared to hold steady in Northern and Western Europe. Among the birth cohorts of the late 1950s and the 1960s, the proportions of childless women, as well as those of women with one child, experienced considerable relative increases (Table 1). The increments were at the expense of large and of two-child families. In some countries, the proportions of two-childless women were increasing faster than the shares of one-child families, especially in countries where two-child families were losing ground, such as Slovenia, Poland and Bulgaria. While the relative increase of childless women was considerable, the growth in the proportions of one-child families was also important.
Table 1: Changes in proportions of family size between 1955 and 1965 birth
cohorts, Central and Eastern European countries
Percent change in proportion of family size between 1955 and 1965 birth cohorts (1955=100)
Country
Three and more
children Two child One child Childless
Czech Republic 82 100 121 120
Slovak Republic 76 103 145 114
Slovenia 83 91 118 160
Poland 89 93 104 159
Lithuania 74 94 124 111
Bulgaria 72 91 127 194
Romania 70 97 130 131
Russian Federation 59 90 140 127
3.5 Cohorts completing childbearing early in the 21st century
The average family size of the cohorts completing their childbearing around the year 2000 is, at best, at the replacement level: it ranges from 1.50 to 2.05, or, in lay language, from one and a half to two children (Table 2).
It cannot be stressed enough that a great deal of variety in the parity composition prevails as the principal feature.
In comparing the three regions, some might consider it counterintuitive that the smallest shares of large families were in Southern European (SE) countries, while the largest shares of these families were in Northern and Western Europe (NWE). The two-child family dominates throughout the continent, but especially in Central and Eastern Europe (CEE). The largest shares of the one-child family can also be found in CEE countries; the smallest, in NWE. The smallest proportions of childless women tend to be in CEE and the largest in NWE.
When looking at individual countries, various extremes emerge. The Russian Federation had the largest share of one-child families, combined with small proportions of childless women and a small share of large families. The country with the largest share of two-child families was Bulgaria, which also had numerous one-child families, but few large families and childless women. Norway, Sweden and France had the largest shares of families of more than three children. The largest shares of childless women were in Italy, followed by England & Wales, the Netherlands and Austria4.
Table 2: Parity distribution in percent, selected European countries, 1965 or latest available birth cohort
Parity (in percent)
Country, Region Cohort 0 1 2 3+ Total cohort fertility rate
Northern & Western Europe
Denmark 1965 12.7 17.9 44.3 25.1 1.93
Norway 1953 10.4 14.6 44.1 30.9 2.05
Sweden 1960 15.1 13.4 41.5 30.0 2.04
France 1965 10.3 18.4 41.2 30.2 2.03
England & Wales 1960 18.9 12.0 39.3 29.8 1.89
Netherlands 1965 18.2 16.9 42.0 22.9 1.78
Austria 1965 17.2 23.7 38.6 20.5 1.65
Southern Europe
Greece 1963 14.9 16.8 48.9 19.4 1.79
Italy 1965 24.0 23.5 36.9 15.6 1.51
Spain 1963 11.8 27.3 47.1 13.8 1.67
Portugal 1963 5.1 31.9 45.5 17.5 1.84
Central & Eastern Europe
Czech Republic 1965 7.5 18.7 54.4 19.4 1.93
Slovak Republic 1965 11.4 16.4 45.5 26.7 2.04
Slovenia 1965 10.5 25.3 50.1 13.9 1.77
Poland 1965 15.5 17.7 37.5 29.3 2.00
Lithuania 1965 9.5 28.3 47.3 14.9 1.73
Bulgaria 1965 9.4 24.6 55.4 10.6 1.83
Romania 1965 13.1 28.6 38.2 20.1 1.91
Russian Federation 1965 8.5 37.0 43.8 10.7 1.65
4. Parity progression ratios (PPRs)
4.1 Northern, Western and Southern Europe (in short, the “West”)
The propensity to have a first child moved along similar paths in all these populations among the cohorts of the 1930s and early 1940s (Figure 4, Panel A). This trend even increased somewhat, with close to 90 percent of women in the baby boom cohorts having a first birth. Beginning with the cohorts of the mid 1940s, the PPRs 0→1 began to decline in a number of countries, and remained stable in others. In France the propensity to have a first child remained at the 90 percent level through the cohorts of the 1960s, with Denmark not far behind. A moderate yet steady decline in the PPRs 0→1 started among the cohorts of the late 1940s in the Netherlands, England & Wales, and Austria. In the cohorts of the early 1960s, the propensity to have a first child was between 80 and 82 percent in the latter three countries. In Italy the decline of the PPR 0→1 started with the cohorts of the mid 1950s, and was steep so that, among the 1960s cohorts, only 75 to 80 percent of women had a first birth.
There was a considerable variety in the PPRs 1→2 in the West (Figure 4, Panel B). England & Wales, Sweden, the Netherlands, France and Greece had ratios at or above 0.80. In contrast, Austria and especially Italy experienced declines in the PPRs 1→2, and among the cohorts of the 1960s only about 70 percent of women with one child went on to have a second birth.
The retreat from the baby boom is especially visible in the declines of the progression ratios from second to third births, and even more so in a prolonged decline of the PPRs 3→4 (Figure 4, Panels C and D). The declines of the PPRs 2→3 occurred in most countries among the cohorts of the late 1930s and the early 1940s. Among the cohorts of the 1950s and 1960s, these ratios settled at levels over 0.35; in Italy and Austria, the decline continued even among the cohorts of the 1950s, with only around 30 to 35 percent of women with two children going on to have a third birth.
4.2 Central and Eastern Europe (in short, the “East”)
The progression ratios to first births were consistently high during the socialist era in all the Central and Eastern European countries, between 0.90 and 0.95 (Figure 5, Panel A). Signs of declines show up among the cohorts of the 1960s, most notably in Poland.
The levels of the PPRs 1→2 differed greatly between countries, but the trends were not too varied (Figure 5, Panel B). By far the lowest level of PPRs 1→2 was in the Russian Federation. Interestingly, progression to second births increased up to the 1950s cohorts in the Czech Republic, and some increase could also be detected in Poland. A common feature for all these populations was a notable subsequent decline in the PPRs 1→2, which usually started with the cohorts born around 1960. In the Russian Federation, this decline was the fastest.
The progression ratios to third births were declining among most cohorts in question (Figure 5, Panel C). The levels were distinctly higher in Poland and the Slovak Republic, which were the countries with higher fertility at that time.
A gradual decline occurred in the PPRs 3→4 up to the 1950s cohorts (Figure 5, Panel D), after which the percentage of women with three children who continued on to have a fourth child consolidated at between 20 and 40 percent. This may seem high, but it is actually of minor consequence because the intensity of third birth fertility rates was already extremely low in these countries (Frejka, Sardon 2007).
Figure 4: Parity progression ratios, Northern, Western and Southern Europe, birth cohorts 1930-1966
Panel A
Parity progression ratios to first births
0.70 0.75 0.80 0.85 0.90 0.95
1930 1935 1940 1945 1950 1955 1960 1965 Birth cohort P a ri ty p ro g re s s io n r a ti o Sweden Denmark Netherlands England & Wales France Austria Italy Greece
Panel B
Parity progression ratios from first to second birth
0.60 0.65 0.70 0.75 0.80 0.85 0.90
Figure 4: (Continued)
Panel C
Parity progression ratios from second to third births
0.2 0.3 0.4 0.5 0.6 0.7
1930 1935 1940 1945 1950 1955 1960 1965 Birth cohort
P
a
ri
ty
p
ro
g
re
s
s
io
n
r
a
ti
o
Sweden Denmark Netherlands England & Wales France Austria Italy Greece
Panel D
Parity progression ratios from third to fourth birth
0.2 0.3 0.4 0.5 0.6
1930 1935 1940 1945 1950 1955 1960 1965 Birth cohort
P
a
ri
ty
p
ro
g
re
s
s
io
n
r
a
ti
o
Sweden France Austria
Source: Country chapters and Observatoire Démographique Européen.
Figure 5: Parity progression ratios, Central and Eastern Europe, birth cohorts 1930-1966
Panel A
Parity progression ratios to first births
0.70 0.75 0.80 0.85 0.90 0.95 1.00
1930 1935 1940 1945 1950 1955 1960 1965 Birth cohort
P
a
ri
ty
p
ro
g
re
s
s
io
n
r
a
ti
o
Czech Republic Slovakia Slovenia Poland Lithuania Russian Federation
Panel B
Parity progression ratios from first to second births
0.55 0.60 0.65 0.70 0.75 0.80 0.85 0.90
1930 1935 1940 1945 1950 1955 1960 1965 Birth cohort
P
a
ri
ty
p
ro
g
re
s
s
io
n
r
a
ti
o
Figure 5: (Continued)
Panel C
Parity progression ratios from second to third births
0.1 0.2 0.3 0.4 0.5 0.6 0.7
1930 1935 1940 1945 1950 1955 1960 1965 Birth cohort
P
a
ri
ty
p
ro
g
re
s
io
n
r
a
ti
o
Czech Republic Slovakia Slovenia Poland Lithuania Russian Federation
Panel D
Parity progression ratios from third to fourth birth
0.1 0.2 0.3 0.4 0.5 0.6
1930 1935 1940 1945 1950 1955 1960 1965 Birth cohort
P
a
ri
ty
p
ro
g
re
s
s
io
n
r
a
ti
o
Czech Republic Slovakia Slovenia Poland Lithuania Russian Federation
5. Conclusions
The two-child family was well established in almost all European countries towards the end of the 20th century. But how long is this dominance of the two-child family going to last? Shares of childless women were growing among cohorts of the 1950s and 1960s, yet it is too early to tell when, and at what level, these shares might stabilize. Proportions of one-child families were stable in Northern and Western Europe, and were increasing in Southern Europe and the Central and Eastern European countries. So far it appears that proportions of childless women are growing faster than shares of women with one child. In some countries, however, shares of the one-child family were growing rapidly, and their proportions were becoming close to equal to those of the two-child family, notably in Romania and the Russian Federation. Shares of large families were continuing to decline in Southern, Central and Eastern Europe, and were quite stable in Western and Northern Europe. The overall analyses in the country chapters and in other overview chapters indicate that a comeback of the large family is not a realistic prospect.
References
Auth, D., and B. Holland-Cruz. (Eds.) 2006. Grenzen der Bevölkerungspolitik. Strategien und Diskurse demographischer Steuerung. Opladen: Verlag Barbara Budrich.
Council of Europe. 2006. Recent demographic developments in Europe 2005. Strasbourg: Council of Europe Publishing.
Dorbritz, J., and K. Ruckdeschel. 2007. Kinderlosigkeit in Deutschland – Ein europäischer Sonderweg? Daten, Trends und Gründe, in D. Konietzka and M. Kreyenfeld (Eds.), Ein Leben ohne Kinder. Wiesbaden: Verlag für Sozialwissenschaften,.
Frejka, T., and J.-P. Sardon. 2004. Childbearing Trends and Prospects in Low-Fertility countries: A cohort analysis. Dorbrecht: Kluwer Academic Publishers.
Frejka, T., and J.-P. Sardon. 2007. Cohort birth order, parity progression ratio and parity distribution trends in developed countries, Demographic Research 16(11): 315–374. www.demographicresearch.org.
Goldstein, J., W. Lutz, and M. R. Testa. 2003. The emergence of sub-replacement family size ideals in Europe, Population Research and Policy Review 22: 479–496.
Fokkema T., and I. Esveldt. 2005. Family size – wishes and limitations, Studia Demograficzne
2(2005): 35–53.
Höpflinger, F. 1991. Neue Kinderlosigkeit. Demographische Trends und gesellschaftliche Spekulationen. Acta Demographica. 1:81-100, Physica Verlag, Heidelberg.
Prskawetz, A., I. Buber, T. Sobotka, and H. Engelhardt. 2006. Recent changes in family policies in Austria and Germany: a response to very low fertility, Entre Nous 63:27–29.
Sobotka, T. 2004. Postponement of childbearing and low fertility in Europe. Amsterdam: Dutch University Press.
Sobotka, T. 2005. Childless societies? Trends and projections of childlessness in Europe and the United States. Unpublished manuscript.
Testa, M. R. 2006. Childbearing preferences and family issues in Europe. Special Eurobarometer 253/Wave 65.1 – TNS Opinion & Social, European Commission.