Ann. Geophys., 29, 883–887, 2011 www.ann-geophys.net/29/883/2011/ doi:10.5194/angeo-29-883-2011
© Author(s) 2011. CC Attribution 3.0 License.
Annales
Geophysicae
Photospheric magnetic vortex structures
S. Shelyag1, V. Fedun2, F. P. Keenan1, R. Erd´elyi2, and M. Mathioudakis1
1Astrophysics Research Centre, School of Mathematics and Physics, Queen’s University, Belfast, BT7 1NN, Northern Ireland, UK
2Solar Physics and Space Plasma Research Centre (SP2RC), School of Mathematics and Statistics, University of Sheffield, Hicks Building, Hounsfield Rd., Sheffield, S3 7RH, UK
Received: 31 January 2011 – Revised: 16 May 2011 – Accepted: 19 May 2011 – Published: 23 May 2011
Abstract. Using direct numerical magneto-hydrodynamic (MHD) simulations, we demonstrate the evidence of two physically different types of vortex motions in the solar pho-tosphere. Baroclinic motions of plasma in non-magnetic granules are the primary source of vorticity in granular re-gions of the solar photosphere, however, there is a signifi-cantly more efficient mechanism of vorticity production in strongly magnetised intergranular lanes. These swirly mo-tions of plasma in intergranular magnetic field concentramo-tions could be responsible for the generation of different types of MHD wave modes, for example, kink, sausage and tor-sional Alfv´en waves. These waves could transport a relevant amount of energy from the lower solar atmosphere and con-tribute to coronal plasma heating.
Keywords. Solar physics, astrophysics, and astronomy (Magnetic fields; Photosphere and chromosphere; Numeri-cal simulation studies)
1 Introduction
Recent high-resolution observations (Bonet et al., 2008; Wedemeyer-B¨ohm and Rouppe van der Voort, 2009) clearly demonstrate the presence of vortex motions in the solar pho-tosphere. These motions are found at photospheric bright points, thus suggesting the magnetic nature of the photo-spheric vortices. On the other hand, as it has recently been demonstrated by forward modelling (Shelyag et al., 2008; Fedun et al., 2009, 2011), the motions, which occur at the footpoints of photospheric magnetic flux tubes, effectively leak into the higher layers of the solar atmosphere thus even-tually reaching the corona and transporting energy into it (Fe-dun et al., 2004; Erd´elyi and Fe(Fe-dun, 2007; Taroyan, 2008;
Correspondence to: S. Shelyag
Taroyan and Erd´elyi, 2009; Antolin and Shibata, 2010). Thus, it is suggested that vortex motions in the photosphere may act as one of the potential mechanisms of energy supply to the upper solar atmosphere.
The origin of vorticity in the non-magnetic solar photo-sphere has been studied in detail (Stein and Nordlund, 1998). However, the computational limitations and model simplifi-cations did not allow detailed investigation of vorticity gen-eration in low plasma β regions (see e.g. Cameron et al., 2008, and references therein). In their simulations, V¨ogler et al. (2005) have demonstrated a connection between the magnetic field and photospheric vortex structures. Recently, Shelyag et al. (2011) have shown vorticity production in magnetic field concentrations and identified it as a mecha-nism that is physically different from the standard hydrody-namical mechanism of the vorticity generation.
In this paper, we analyse the three-dimensional structure of photospheric magnetic vortices. We demonstrate that the magnetic vortex configuration consists of a few concentric cylinder-like structures, embedded into the intergranular lane and rotating in the opposite directions. We also show that this structure is bounded by the surface at which the local Alfv´en speed is equal to the local sound speed.
2 Simulations
884 S. Shelyag et al.: Phorospheric magnetic vortex structures
Fig. 1. Modulus of the horizontal components of velocity (left panel) and the vertical component of magnetic field, taken at the height of
approximately 500 km above the visible solar surface level.
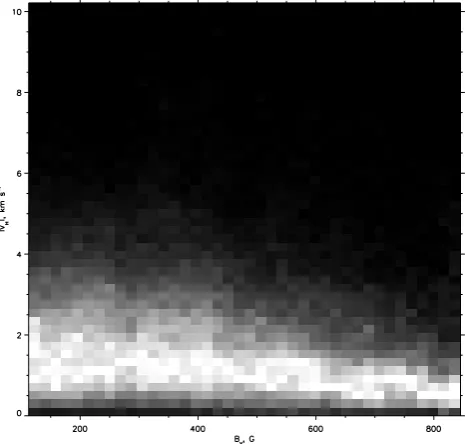
Fig. 2. Scatter plot of modulus of the horizontal velocity versus the
strength of the vertical magnetic field component.
plasma in- and outflows. The top boundary is closed with stress-free conditions for horizontal motions of plasma and magnetic field. Non-grey radiative transport is included in the code as a source term in the energy equation. A non-ideal equation of state, which takes into account first stage ionisation of the most abundant elements of solar chemical composition, is used to close the system of MHD equations. In the simulation discussed here we use a numerical do-main of size of 12×12 Mm2 in the horizontal directions and 1.4 Mm in the vertical (denoted asy) direction, which
is resolved by 480×480×100 grid cells, respectively. The numerical box is positioned in such a way that the approxi-mate visible solar surface is located at the height of 0.8 Mm above the bottom boundary. We start the computational modelling from a plane-parallel initial state based on the convectively-unstable model of the photosphere described by Spruit (1974). After a few convective turnover times the pat-tern of non-magnetic photospheric convection became suf-ficiently well developed and the simulation became statisti-cally stable. At this stage, a uniform vertical magnetic field of 200 G is introduced into the domain, and the simulation is let to evolve for a few more convective turnovers. Dur-ing this stage the magnetic field is forced out of the granules into the intergranular lanes, forming intergranular magnetic flux concentrations with the magnetic field strength of about 2 kG. At the last stage of the evolution a snapshot containing all model parameters is taken for further analysis.
3 Horizontal velocity in the upper photosphere
[image:2.595.51.284.310.532.2]S. Shelyag et al.: Phorospheric magnetic vortex structures 885
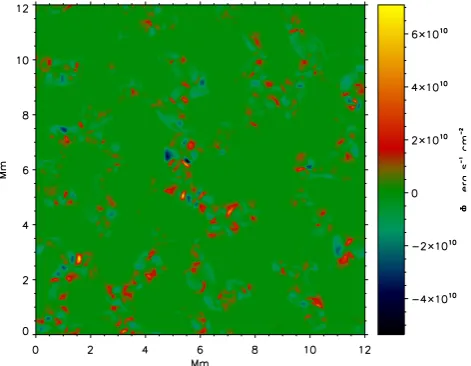
Fig. 3. Distribution of the vertical component of Poynting flux
vec-tor taken at the same height as Fig. 1.
structures of the second type are vortices, which are located just between the granules and have spiral or circular shapes with a small, about 1 Mm, size. Comparison between the left and right panels demonstrates that these features are co-located with the regions of strong magnetic field. As it was recently analysed by Shelyag et al. (2011), these vortices are generated by the action of the magnetic tension term in the MHD vorticity equation. The vortices show significantly higher horizontal velocities compared to the granular out-flows. The enhancement could be up to a factor of 2. Also, a comparison of the left and right panels in Fig. 1 shows that the horizontal velocity amplitude in the vortices does not de-pend on the magnetic field strength. Figure 2, a scatter plot of the horizontal velocity amplitude versus the vertical mag-netic field strength, confirms this observation, showing little or no evidence of such a dependence. However, there is some evidence of the dependence of the fine structure of the vor-tex on the magnetic field. For example, at the position (5.5, 7) Mm, where the magnetic field reaches the highest value of about a kG, the vortex ridges, corresponding to enhance-ments in the modulus of horizontal velocity, become notice-ably thinner.
The magnetic photospheric vortices correspond to regions of strong vertical Poynting flux (Fig. 3). From this figure it can be seen that positive (directed outwards) flux has larger amplitude, and the regions of positive Poynting flux cover larger area than the regions of negative flux, leading to a net positive vertical Poynting flux.
4 Magnetic photospheric vortex structure
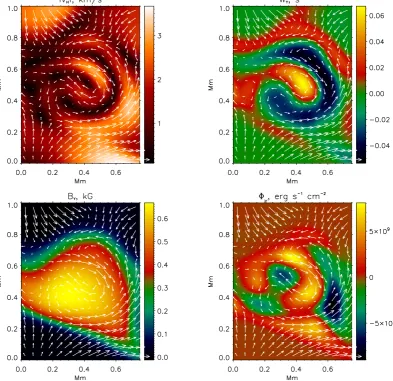
[image:3.595.51.287.63.246.2]A more detailed close-up look of a single magnetic photo-spheric vortex is presented in Fig. 5. The values for the mod-ulus of the horizontal velocity component (top-left panel),
Fig. 4. Dependence of vertical component of the Poynting flux
vec-tor, measured in the upper photosphere, on the simulation time.
the vertical component of vorticity (ωy=∂vx/∂z−∂vz/∂x, top-right panel), the vertical component of the magnetic field (bottom-left panel), and the vertical component of Poynting flux vector (bottom-right panel) are all taken at a height of about 0.5 Mm above the visible solar surface. The horizon-tal velocity field arrows are overplotted. A magnetic vortex is clearly visible. There are two distinct horizontal flow di-rections, making up together an S-shaped flow around the vortex magnetic centre at coordinates (0.35, 0.4) Mm (note that the maximum field strength in the magnetic flux concen-tration is shifted to the bottom-left corner of the image in the right panel). In agreement with the flow direction, the ver-tical component of vorticity has both positive and negative signs within the vortex. Thus, the photospheric magnetic vor-tices are different in nature and cannot be compared with the hydrodynamic “sink” vortices where the vorticity has single sign.
The map of the vertical component of the Poynting flux also shows both positive and negative values. Despite that the maximum value of the negative flux is slightly higher than the maximum positive one, the area covered by positive flux is visibly larger than the area covered by negative flux.
In Fig. 4 the net vertical Poynting flux dependence on the simulation time is shown. The oscillatory behaviour of the vertical flux is caused by the presence of the model eigen-modes in the simulations. The flux averaged over time is about 3×10⁸erg s−1cm−2, which is sufficiently hight to supply the energy flux for the upper layers of the solar at-mosphere.
The observed dependence of the net vertical Poynting flux is in agreement with that of Abbett and Fisher (2011), who found that it is directed downwards in the lower photosphere, and upwards in the upper photosphere (see Fig. 6).
886 S. Shelyag et al.: Phorospheric magnetic vortex structures
Fig. 5. A horizontal structure of the vortex. Modulus of horizontal components of velocity (top-left image), vertical component of vorticity
(top-right image), strength of the vertical component of magnetic field (bottom-left image) and vertical component of Poynting flux vector (bottom-right image) are shown. The snapshots are taken in the upper photosphere at about 500 km above the continuum formation level. The horizontal velocity field arrows are overplotted.
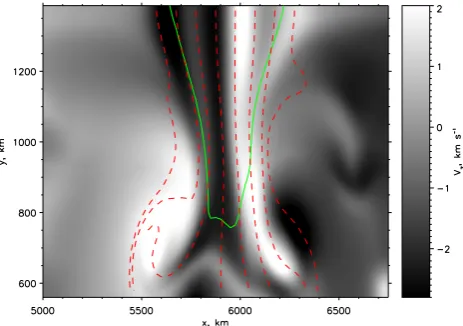
component perpendicular to the picture plane (note that the velocity field has not been normalised by the large-scale background flow which is present in the analysed region of the simulation). The red dashed lines are the magnetic field lines, while the green contour corresponds to the surface where the local Alfv´en speed is equal to the sound speed, vA=cs. An alternating pattern of vertical cylinder-like struc-tures, rotating in the opposite horizontal directions and nearly parallel to the magnetic field lines, is visible in the region bounded by the equipartition contour.
5 Conclusions
In this paper we present a brief study of the magnetic pho-tospheric vortices. The internal structure of the vortex has
S. Shelyag et al.: Phorospheric magnetic vortex structures 887
Fig. 6. Dependence of the mean vertical component of the Poynting
flux vector on the height in the photosphere.
Fig. 7. A vertical cut through the vortex. The background image
is the horizontal velocity component, perpendicular to the plane of the image. The solid green contour corresponds to thevA=cslayer.
The dashed lines are the magnetic field lines.
Acknowledgements. This work has been supported by the UK
Science and Technology Facilities Council (STFC). The authors also thank The Royal Society (UK) for the financial support re-ceived. F.P.K. is grateful to AWE Aldermaston for the award of a William Penney Fellowship. RE acknowledges M. K´eray for patient encouragement and is grateful to NSF, Hungary (OTKA, Ref. No. K83133). We also thank the referees for their construc-tive comments and suggestions.
Guest Editor M. Balikhin thanks two anonymous referees for their help in evaluating this paper.
References
Abbett, W. P. and Fisher, G. H.: Radiative Cooling in MHD Models of the Quiet Sun Convection Zone and Corona, arXiv:1102.1035, 2011.
Antolin, P. and Shibata, K.: The Role Of Torsional Alfvn Waves in Coronal Heating, ApJ, 712, 494–510, 2010.
Bonet, J. A., M´arquez, I., S´anchez Almeida, J., Cabello, I., and Domingo, V.: Convectively Driven Vortex Flows in the Sun, ApJL, 687, L131–L134, 2008.
Cameron, R., Gizon, L., and Duvall Jr., T. L.: Helioseismology of Sunspots: Confronting Observations with Three-Dimensional MHD Simulations of Wave Propagation, Solar Phys., 251, 291– 308, 2008.
Erd´elyi, R.: Magnetic coupling of waves and oscillations in the lower solar atmosphere: can the tail wag the dog?, Royal So-ciety of London Philosophical Transactions Series A, 364, 351, 2006.
Erd´elyi, R. and Fedun, V.: Are There Alfv´en Waves in the Solar Atmosphere?, Science, 318, 1572–1574, 2007.
Erd´elyi, R., Pint´er, B., and Malins, C.: Leakage of photospheric motions into the magnetic solar atmosphere: new prospects of magneto-seismology, Astronomische Nachrichten, 328, 305– 308, 2007.
Fedun, V. N., Yukhimuk, A. K., and Voitsekhovskaya, A. D.: The transformation of MHD Alfv´en waves in space plasma, J. Plasma Phys., 70, 699–707, 2004.
Fedun, V., Erd´elyi, R., and Shelyag, S.: Oscillatory Response of the 3D Solar Atmosphere to the Leakage of Photospheric Motion, Solar Phys., 258, 219–241, 2009.
Fedun, V., Shelyag, S., and Erd´elyi, R.: Numerical Modeling of Footpoint-driven Magneto-acoustic Wave Propagation in a Lo-calized Solar Flux Tube, ApJ, 727, 17–31, 2011.
Jess, D. B., Mathioudakis, M., Erd´elyi, R., Crockett, P. J., Keenan, F. P., and Christian, D. J.: Alfv´en Waves in the Lower Solar At-mosphere, Science, 323, 1582–1585, 2009.
Shelyag, S., Fedun, V., and Erd´elyi, R.: Magnetohydrodynamic code for gravitationally-stratified media, A&A, 486, 655–662, 2008.
Shelyag, S., Keys, P., Mathioudakis, M., and Keenan, F. P.: Vorticity in the solar photosphere, A&A, 526(A5), 1–7, 2011.
Spruit, H. C.: A model of the solar convection zone, Solar Phys., 34, 277–290, 1974.
Stein, R. F. and Nordlund, A.: Simulations of Solar Granulation. I. General Properties, ApJ, 499, 914–933, 1998.
Taroyan, Y.: Integrated approach to the coronal heating problem, IAU Symposium, 247, 184–194, 2008.
Taroyan, Y. and Erd´elyi, R.: Heating Diagnostics with MHD Waves, Space Sci. Rev., 149, 229–254, 2009.
Verth, G., Erd´elyi, R., and Goossens, M.: Magnetoseismol-ogy: Eigenmodes of Torsional Alfv´en Waves in Stratified Solar Waveguides, ApJ, 714, 1637–1648, 2010.
V¨ogler, A., Shelyag, S., Sch¨ussler, M., Cattaneo, F., Emonet, T., and Linde, T.: Simulations of magneto-convection in the solar pho-tosphere. Equations, methods, and results of the MURaM code, A&A, 429, 335–351, 2005.
[image:5.595.51.283.289.452.2]