2017 2nd International Conference on Information Technology and Management Engineering (ITME 2017) ISBN: 978-1-60595-415-8
A Study on Simulation of High Resolution SAR Image of Complex
Ground Target
Li-chun YANG*, Ying-yan GU and Ming-ming TAO
Jiangsu Automation Research Institute, Jiangsu, Lianyungang 222061, China
*Corresponding author
Keywords: Ground target, Synthetic aperture radar image, Electromagnetic scattering, Graphical electromagnetic computing.
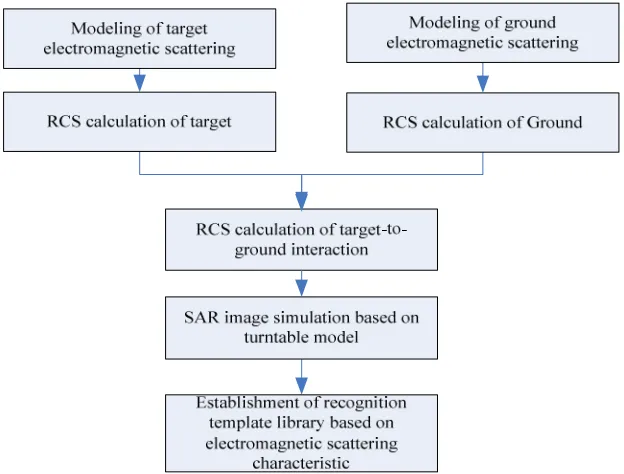
Abstract. SAR (Synthetic Aperture Radar) is used to detect the complex ground target, which can obtain the image of the military target. There is a great difference between the SAR image and the traditional optical image, and SAR image responses the distribution characteristics of the ground target microwave scattering which produces great challenges in the interpretation of the SAR image. A simulator method based on electromagnetic scattering characteristics of the target was presented to obtain SAR image of targets on the ground. According to the turntable imaging model, the method that classification interpolation of digital elevation model of the real ground simulated was used to build the ground structure. And the target’s electromagnetic scattering and the RCS (Radar Cross-Section) were computed by the graphical electromagnetic computing (GRECO) method. The accelerating ray-tracing method was applied to compute the interaction between the target and ground. A SAR simulation imaging system was built to simulate the SAR image of a tank target placed in the ground. The simulation result indicated that the simulated image fits the scattering characteristics of the actual object and it could provide recognition template for SAR image interpolation with the ground SAR image simulation based on electromagnetic scattering characteristics.
Introduction
SAR (Synthetic Aperture Radar) is a kind of active detection sensor, which detects the target by microwave signals and performs imaging processing on the received echoes. SAR imaging is not subject to weather, sunlight or other conditions, and can observe the target all-weather and all-day [1]. With the development of microelectronics and signal processing, SAR technology has been rapidly developed. The SAR image resolution is getting higher and higher, and the target could get fine observations, so that it has been widely used in earth remote sensing, land resources exploration, disaster assessment and military fields [2-3].
How to detect, interpret and identify the target quickly and accurately from the massive SAR image data has become a hot and difficult point and draws great attention [4-7]. While the current SAR image recognition is mainly based on studying the images themselves [8-9], the research of SAR images’ bright spots, shadows, contours and other characteristics which reflect the electromagnetic scattering properties of the target remains is lack. The SAR images reflect the distribution of microwave scattering of ground targets, while the optical images reflect the distribution of optical reflection, and mechanism of images is completely different, resulting significant differences between SAR images and optical images. For the targets with identical geometric shape, the scattering intensity and distribution reflected by SAR images will change obviously due to different electromagnetic characteristics of target, working frequency band, polarization mode and observing angle of the radar. These characteristics of SAR images lead to great difficulties in the interpretation of SAR images for the researchers accustomed to interpreting conventional optical images. Therefore, in order to improve the interpretation level of SAR images, the essence of the electromagnetic scattering mechanism of SAR images must be studied.
by the actual bandwidth of the imaging radar. The SAR images are the total reflection of radar echoes, and cannot separate the single scattering mechanism. And the cost of acquiring data is high. The target RCS data is calculated according to the electromagnetic scattering characteristics of the target. The SAR image can be obtained from the RCS data [11,12]. By means of SAR image simulation, images at arbitrary angle and resolution can be obtained, and different scattering sources can be separately imaged, providing template information for SAR image recognition. However, the simulation of SAR image is mainly focused on the single object and the target on the ground is considered less.
SAR image simulation of complex targets on the ground mainly has the following difficulties: 1) modeling the electromagnetic scattering of the ground scene; 2) calculating the RCS information under the interaction of the target and the ground; 3) SAR image simulation needs to calculate RCS at different frequencies and angles so that the computational efficiency of RCS is also a problem to be considered.
According to the target SAR electromagnetic scattering mechanism, the electromagnetic scattering from the target is calculated based on the graphical electromagnetic calculation method, DEM data is used to construct the ground structure and an improved ray tracing method is proposed to analyze the influence of the ground background on the multiple reflections. By analyzing the scattering mechanism of the target SAR image, the SAR image of the ground target is constructed using the turntable imaging model, which provides the template library and the knowledge base for the SAR recognition and can improve the SAR image interpretation level.
SAR Image Simulation Process of Ground Complex Target
[image:2.612.150.462.486.723.2]Calculation of RCS of Complex Target at High Frequency Region
Usually, the frequency of SAR is relatively high, the size of the target is relatively large and the size of the target is often much larger than the wavelength of the SAR radar, so that the target can be considered as the target of electricity and its scattering shows a high-frequency local scattering characteristics. High-frequency scattering source mainly includes: the scattering of the faces, the scattering of the edge and the scattering of the corner reflector.
Graphical electromagnetic computing uses the computer graphics technology [13] to construct the 3D mesh model of the target and reconstructs it in the computer. The normal vector information of the target is obtained by different illumination in opposite directions.
By obtaining the memory information of the computer, the normal vector and depth information of the real object corresponding to the computer pixel can be obtained and the RCS information of the complicated object can be calculated on the basis of the information.
Faces scattering model. According to the physical optical method the calculation formula of RCS of all metal target under the high frequency condition is:
2 2 2
4
sin ( tan ) j z pixl
c Kl e
π
σ θ
λ
=
∑
k. (1)
θ is the angle between the incident direction and the face normal vector, Z is the distance from the
face ds to the observer, and l is the length of the pixel.
Edge scattering calculation model. According to the high-frequency theory, the far-field scattering field generated by the edge can be regarded as the radiation of the equivalent current. The magnitude of the current is related to the direction of the incident and the direction of the opposite edge of the viewing point.
The monostatic scattering field in the far-edge region can be expressed using the equivalent current as [14]: 2 0 ˆ sin ˆ cos ' 2 ˆ cos r jkr
r i jKZ
x edge
i D e e
E E D e e dl
r D e γ γ π γ − ⊥ − − = − ∫
. (2)
where the line integral is performed along the edge illuminated by the incident wave. eˆiand ˆ
i e⊥ are
the normal vectors of the parallel and perpendicular incident planes, γ is the angle between the
incident electric field and ˆ
i
e⊥ , and D,Dx,D⊥ are single-station incremental length diffraction
coefficients.
Multiple scattering calculation model. When irradiating to a surface the electromagnetic waves will be reflected to the other surface and multiple scattering is produced. The ray tracing method can be used to calculate the multiple scattering between the face representations of different pixels. Ray tracing method is a high frequency approximation method that can compute the RCS of the target by combining the geometrical optics method and the physical optics method. The single electromagnetic wave reflection contribution of the target is calculated by the physical optics and the multiple reflections obtained by multiple geometrical optical ray tracing and the physical optical integration.
reflection points of each pixel; step 5, calculate the far field scattering field of each reflection by using the physical optics integration.
The multiple scattering field can be calculated by geometrical optics and physical optics [18]:
0
1
1
sin( )
ˆ ˆ 2
1 2
m
M m
jKR W jKR W r i
m m
m Ka W n e h
e p a e
T Ka W
σ
π =
⋅ ⋅ ×
= ⋅ ⋅
⋅ ∑
. (3)
i
h is the incident magnetic polarization unit vector, R0is the origin vector of the polygon
coordinate, W = −i s
, am
is the length vector of the m-th edge of the polygon; Rm
is the position
vector of the m-th edge, p= ×n W/ n W×
; W is the number of polygons, since the actual object represented by the pixel is a quadrilateral so that W is 4 here.
Electromagnetic Scattering Calculation of Ground Target
Geometric Modeling of Ground Scene. The common ground scene geometry model is the digital elevation model (DEM) whose data sampling interval is relatively sparse that it can hardly meet the need of calculating its electromagnetic characteristics so that the DEM data need to be compressed by interpolation.
[image:4.612.225.390.383.487.2]The research results show that the natural terrain scene has a fractal feature in a certain scale range, so the DEM data that can keep the random fluctuation characteristic of the scene surface and satisfy the electromagnetic characteristic calculation requirement could be obtained by fractal interpolation of the natural scene DEM data [15], and Figure 2 is the schematic diagram of an interpolated terrestrial scene.
Figure 2. Ground scene diagram recursive.
Figure 3. Scattering mechanism of ground target fractal interpolation.
[image:4.612.183.419.517.683.2]contains the scattering from the ground and the multiple scattering from the interaction between the ground and the target.
In general, the calculation of the scattering characteristics of a complex target on the ground consists of two parts: the individual scattering characteristics of the ground surface and the target; the multiple scattering properties of the ground and target. Regard the ground and target as a whole, the scattering mainly include the following parts as shown in Figure 3: 1) target direct scattering; 2) the scattering from the target to the ground; 3) the scattering from the ground to the target; 4) the ground direct scattering; 5) multiple scattering of ground and target. For the direct scattering from the ground surface can be calculated by the statistical method it is not considered in this paper. Therefore, we can get the electromagnetic scattering of the ground target including 1,2,3,5.
After obtaining the electromagnetic scattering component of the ground target, each of the components can be solved separately. For the direct scattering of the target, the calculation method of target scattering in section 2 is applied. For the three kinds of scattering between the target and the ground, ray tracing method can be used to trace the scattered rays by geometrical optics and the scattering field could be solved by physical optics. Considering that the electromagnetic wave reflection characteristic of the ground surface is affected by its roughness and the dielectric constant of its composition, the scattering field by the physical optics is multiplied by a certain complex scattering value representing the ground scattering loss for the rays passing through the ground. Finally, the electromagnetic scattering characteristic under the ground scene is obtained by coherently superimposing the scattering field of the target and the scattering field of the target coupled with the ground.
SAR Image Simulation Based on Turntable Imaging Principle
According to the theory of radar imaging, high range resolution can be obtained by transmitting broadband signal and the high azimuth resolution can be obtained by using the equivalent large aperture formed by the relative motion between radar and target, two-dimensional high resolution SAR/ISAR imaging can be obtained. Turntable imaging is a common method for simulating ISAR imaging which places the target on a rotatable platform and makes the target and radar rotate accordingly with the rotation of the platform. After motion compensation, the ISAR imaging can be represented by turntable imaging model.
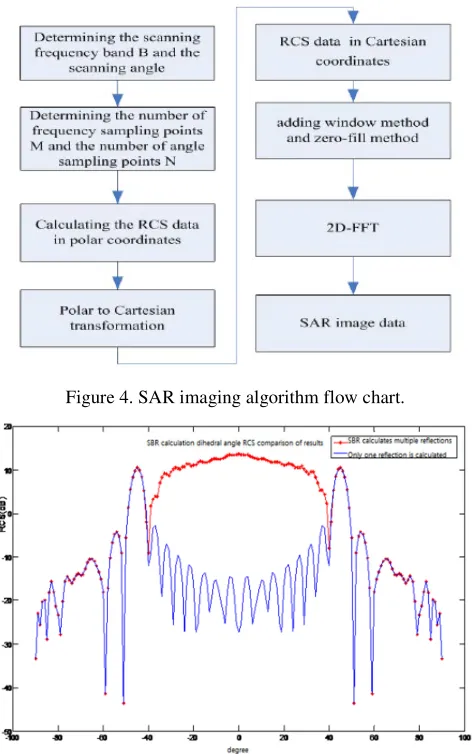
The SAR image simulation process based on the turntable imaging principle is shown in Figure 4: 1) Determining the scanning frequency band B and the scanning angle θm;
The scanning band B and the scanning angle θm can be expressed as:
,
2 2
x m y
r a
c
B k θ k λ
ρ ρ
= =
. (4) In this formula ρr represents the range resolution,
ρ
a represents the azimuth resolution, c represents speed of light, kx and ky are the resolution reduction factors of the window function usedfor imaging, and λ is the carrier wavelength.
2) Determining the number of frequency sampling points M and the number of angle sampling points N;
Supposed the target distance length is Lx, the azimuth length is Ly, and the carrier frequency is fc,
the frequency sampling interval ∆f and the azimuth sampling interval ∆θ respectively meet:
/ 4 x, / 4 c x
f c L θ c f L
∆ ≤ ∆ ≤ . Then, M B
f
=
∆ ,
m
N θ
θ
= ∆
3) Calculating the RCS data σM N× ( , )f θ in polar coordinates;
In the two-dimensional interpolation FFT imaging algorithm, the polar coordinate data needs to be
interpolated to the Cartesian coordinate (fx,fy) then the frequency-domain M N× -dimensional data
( , )
M N fx fy
σ × is obtained. the corresponding SAR image can be obtained by carrying out the
two-dimensional inverse Fourier transform for σM N× (fx,fy).
[image:6.612.188.424.169.546.2]5) Using adding window method, zero-fill method and two-dimensional FFT method to get SAR image;
Figure 4. SAR imaging algorithm flow chart.
Figure 5. Calculated dihedral angle RCS results by ray tracing method.
Experimental Results and Analysis
The correctness of the ray tracing method is verified by the standard reflector dihedral structure. An 90 degrees angle reflector is simulated with the settings that the side length is 0.179 meters, the incident wave frequency is 9.4 GHz and the azimuth angle is calculated from -90 degrees to 90 degrees. The results of the ray tracing show that the rays with three ejections return along the incident direction. The results of the SBR calculating multiple reflections and only one reflection are shown in Figure 5. According to the RCS computing value of the dihedral corner reflector, the back scattering
is
2 2
4πs
λ in the forward direction and the RCS theoretical value of the corner reflector in the 0 degree
direction is 11.02 dBsm. The total RCS value of the multiple scattering calculation is the same as the theoretical value.
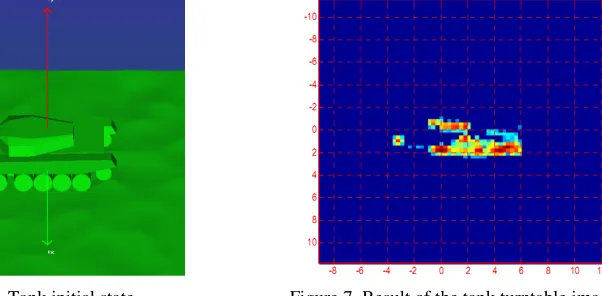
Figure 6. The pitch angle of the tank is 30 degrees, the azimuth angle is 90 degrees, the bandwidth B
is 512 MHz ( 11.2 GHz ~ 11.712 GHz ), the carrier frequency fc is 11.456 GHz, the frequency
interval ∆ρf is 2 M, the maximum rotation angle θm is 2.56 degrees, the rotation angle interval ∆θ
is 0.01 degrees, the number of sampling points is 256 * 256, the azimuth resolution is 0.293 meters and the distance resolution is 0.146 meters. The imaging result is shown in Figure 7 with the abscissa for the azimuth, the ordinate for the distance and the unit in meters.
Figure 6. Tank initial state. Figure 7. Result of the tank turntable imaging.
This RCS calculation only considered the target and the scattering between the target and the ground without considering the ground reflection. From the simulation image it can be seen that the gun barrel, the top turret and the tank all have clear shape, and that the simulation image can reflect the scattering characteristic of the target well which can be used in the target recognition template.
Summary
The interpretation of ground target SAR image is so seriously needed that the SAR image simulation has great significance for researchers. In this paper, complex ground targets SAR images which provide template information for SAR image recognition are simulated.
The real terrain the ground structure is constructed by using the fractal interpolation method based on the digital terrain elevation model. An improved graphical electromagnetic computing method which combines physical optics method, equivalent electromagnetic flow method and ray tracing method is used to calculate the radar cross section of the target. The multiple reflection method is used to calculate the interaction between the target and the ground which is regarded as a consumption material. According to the turntable imaging model the SAR imaging simulation system is built using the amplitude and phase data of the RCS. The RCS of the corner reflector calculated result is closer to the actual scattering value by using the multiple reflection technique than using the single physical optics method, which shows that the fast ray tracing method owns fastness and accuracy. The feasibility and correctness of the method proposed in this paper is verified by using this method to achieve the SAR imaging simulation of the tank target placed on the ground, simulation results are in agreement with the actual object characteristics. Based on the electromagnetic scattering mechanism of SAR imaging, combining the electromagnetic scattering mechanism with SAR theory, the SAR image knowledge base for typical targets and typical targets in complex background can be established, which can be used to identify high resolution SAR images and to greatly improve the SAR image target interpretation level.
References
[2]Zhang Jixian, Huang Guoman, Liu Jiping. SAR remote sensing monitoring of the Yushu Earthquake disaster situation and the information service system[J]. Journal of Remote Sensing, 2010, 14(5): 1038-1052.
[3]Liu Bintao, Tao Heping, Fan Jianrong, Tian Binwei, Zhang Jianqiang, Yan Dong. Application of High-Resolution SAR Images in Wenchuan Earthquake Hazard Monitoring and Assessment[J]. Journal of Mountain Science, 2008, 26(3):267-271.
[4]Liu X, Huang Y, Pei J, Yang J. Sample Discriminant Analysis for SAR ATR[J]. IEEE Geo science and Remote Sensing Letters, 2014, 11(12): 2120–2124.
[5]Huang Yulin, Peia Jifang, Yanga Jianyu, et al. Neighborhood Geometric Center Scaling Embedding for SAR ATR[J]. IEEE Transactions on Aerospace and Electronic Systems, 2014:50(1): 180-192.
[6]Srinivas Umamahesh, Monga Vishal, Ra Raghu. SAR Automatic Target Recognition Using Discriminative Graphical Models[J]. IEEE Transactions on Aerospace and Electronic Systems, 2014:50(1): 591–606.
[7]Ohno S, Kidera S, Kirimoto T. Efficient SOM-Based ATR Method for SAR Imagery With Azimuth Angular Variations[J]. IEEE Geoscience and Remote Sensing Letters, 2014: 11(11):1901-1905.
[8]Deng Shaoping, Zhang Jixian, Li Pingxiang. Review of edge detection from polarimetric SAR imagery. Computer Engineering and Applications, 2011:47(22):1-5.
[9]Yin Kuiying. Study on SAR Image Pressing and Ground Target Recognition Technology[D]. Xi’an: Xidian University, 2011.
[10]Huang Peikang, Yin Hongcheng, Xu Xiaojian. Radar Target Characteristics [M]. Beijing: Electronics Industry Press, 2005: 22-47.
[11]Li Renjie, Ji Kefeng, Zou Huanxin, Zhou Shilin. Simulation of SAR Imagery of Target Based on Electromagnetic Scattering Characteristic Computation[J]. Radar Science and Technology, 2010: 8(5).
[12]Zhou Wenming, Song Jianshe, Zheng Yongan, Xu Jun. Establishing Target Recognition Template in SAR Images Based on Electromagnetic Characteristics[J]. Electronics Optics & Control, 2008: 15(7).
[13]J.M. Rius, M. Ferrando, L. Jofre. Greco: Graphical electromagnetic computing for RCS Prediction in real time[J].IEEE Antennas Propagetion Magazine, vol, AP-35, pp. 7-17, Apr. 1993.
[14]E F Knott, J F Shaeffer, M T Tuley. Radar Cross Section[M], Artech House, 1985.