Creative Components Iowa State University Capstones, Theses and Dissertations
Fall 2018
Functional and dysfunctional relationships at work and their
Functional and dysfunctional relationships at work and their
impact on individual performance
impact on individual performance
Dileep K. Nunna
Iowa State University, [email protected]
Follow this and additional works at: https://lib.dr.iastate.edu/creativecomponents
Part of the Construction Engineering and Management Commons
Recommended Citation Recommended Citation
Nunna, Dileep K., "Functional and dysfunctional relationships at work and their impact on individual performance" (2018). Creative Components. 89.
https://lib.dr.iastate.edu/creativecomponents/89
i
Functional and dysfunctional relationships at work and their impact on individual performance
by
Dileep Nunna
A creative component research report submitted to the graduate faculty
in partial fulfillment of the requirements for the degree of
MASTER OF SCIENCE
Major: Civil Engineering
Program of Study Committee: Cristina Poleacovschi, Major Professor
Charles Jahren Melissa Chamberlin
The student author, whose presentation of the scholarship herein was approved by the program of study committee, is solely responsible for the content of this creative component. The Graduate College will ensure this creative component is globally accessible and will not permit
alterations after a degree is conferred.
Iowa State University
Ames, Iowa
2018
ii
TABLE OF CONTENTS
LIST OF FIGURES………iii
LIST OF TABLES………..iv
ACKNOWLEDGEMENTS……….v
ABSTRACT………vi
CHAPTER 1 INTRODUCTION………..1
CHAPTER 2 BACKGROUND...4
2.1 Dysfunctional and functional relationships………....4
2.2 Individual performance………...6
CHAPTER 3 METHODS………...7
3.1 Data collection………....7
3.2 Significant work connections………...7
3.3 Functional and dysfunctional relationships………....8
3.4 Individual Attributes: Hierarchy, Tenure and Gender……….…...9
3.5 Individual Performance………..9
CHAPTER 4 DATA ANALYSIS………...10
4.1 Social Network Analysis………...10
4.2 Linear regression analysis………...12
CHAPTER 5 RESULTS………...13
CHAPTER 6 DISCUSSIONS AND IMPLICATIONS………..22
CHAPTER 7 CONCLUSIONS………...25
iii
LIST OF FIGURES
Page
Figure 1 Visual representation of in-degree centrality………..……11
Figure 2 Spring map for functional network………....13
Figure 3 Concentric map of functional network………...14
Figure 4 Spring map of dysfunctional network………...14
iv
LIST OF TABLES
Page
Table 1 Descriptive statistics of variables………..16
Table 2 Linear regression analyses results for functional and dysfunctional……….17
in-degree centrality and manager rated performance scores
Table 3 Linear regression analyses results for functional in-degree centrality………...18
and manager rated individual scores
Table 4 Linear regression analyses results for dysfunctional in-degree………...19
centrality and manager rated individual scores
Table 5 Linear regression analyses results for functional and dysfunctional………..20
shortest paths and manager rated performance scores
Table 6 Linear regression analyses results for functional shortest path………..…20
and manager rated individual scores
Table 7 Linear regression analyses results for dysfunctional shortest………21
v
ACKNOWLEDGEMENTS
I would like to thank my major professor, Dr. Cristina Poleacovschi and my committee
members, Dr. Charles Jahren and Dr. Melissa Chamberlin, for their guidance and support
throughout the course of this research.
In addition, I would also like to thank my family, friends, the department faculty and staff
vi
ABSTRACT
The impact of workplace relationships on individual performance in the construction
industry has been understudied. Nevertheless, improving individual performance is essential for
project performance and gaining competitive advantage. This case study aims to study how the
department climate in terms of existing relationships influence individual performance as rated by
managers. Specifically, the paper presents the idea of functional and dysfunctional relationships
in project-based organizations and its importance to individual performance. The case study uses
data from a survey distributed to employees in one department within a global construction and
engineering organization. First, different types of relationships were identified using the survey
data available on frequency of knowledge sharing interactions and functional and dysfunctional
relationships among the employees. Second, a social network analysis approach was used to
identify centrality scores and shortest paths for both functional and dysfunctional networks.
Finally, a linear regression analysis was performed to study the impact of functional and
dysfunctional relationships on the individual performance. The results demonstrate that functional
relationships have significant positive impact on individual performance while the dysfunctional
relationships does not have any significant impact. These results have practical implications for
practitioners in construction and engineering companies as they improve understanding regarding
the factors affecting individual performance. Furthermore, the results contribute to theory of work
climate by indicating that work climate could affect the individual performance which eventually
1
CHAPTER 1: INTRODUCTION
Construction and engineering firms are increasingly interested in improving employee
individual performance. The study of individual performance and the factors affecting individual
performance is important, as the way individuals perform their everyday tasks collectively
contributes to project results and organizational performance (Cheng and Li, 2006). However,
despite the importance of individual performance, past research mainly focused on identifying the
antecedents for project level performance (Leu and Lin, 2006; Chan, Scott and Chan, 2004;
Barraza, Back and Mata, 2004) and the antecedents of individual performance continue to be
understudied. Moreover, the few scholarly works which studied individual performance in
construction and engineering organizations have primarily focused on individual expertise and
knowledge sharing (Poleacovschi and Javernick-Will, 2016; Tuuli and Rowlinson, 2009, Cheng
and Li, 2006). This paper takes a different stance to identifying the antecedents of individual
performance by focusing on working relationships which are frequently neglected from
practitioners’ and scholars’ perceptive on improving individual performance. The rationale for
studying work relationships is the past work that identified the role of work environment and
climate on individual performance. For example, the way people share knowledge positively or
negatively affects their performance (Poleacovschi et al. 2017; Poleacovschi and Javernick-Will
2016) partially because employees spend less time getting their tasks done whenever they have
strong relationships or relationships that are based on frequent interactions as they could access
2
Maintaining strong relationships with people at work could help an individual in many
ways such as making better and quicker decisions, performing better as a team member, reduced
conflicts and creating a welcoming environment, which could eventually help in boosting
productivity and individual performance. Interactions with colleagues represent central individual
experiences and have the most emotional impact on employees (Elfenbien, 2007). This work
underlines the importance of the relationships in the workplace especially because construction
and engineering organizations heavily emphasize formal processes as key to how performance is
improved (Cao and Hoffman, 2010; Simpson et al., 2006; Lauras et al. 2010) and tend to
undervalue the importance of social and “soft” practices. This research takes a different stance and
shows that individual performance is affected by how employees “feel” about their relationships
with other employees.
Specifically, the nature of the relationships, dysfunctional or functional is expected to be
essential as people in construction and engineering organizations spend a large portion of their
time interacting with other employees and the quality of these interactions could affect their
productivity. This research departs from a previous meta-analysis of the relationships literature
which showed that dysfunctional relationships influence employees’ desire to leave an
organization (LePine, Podsakoff & LePine, 2007; Kinjerski and Skrypne, 2004) suggesting that
the nature of relationships (functional and dysfunctional) plays an important role to people’s
experiences at work. However, there is dearth of work that studied this topic in the context of
construction and engineering organization and to my knowledge, no previous work had evaluated
the relationship between the nature of relationships and individual performance.
The case study was conducted using survey data obtained from a single department in a
3
relationships, was collected from one department in the organization. Using the social network
analysis the centrality scores and shortest path scores were calculated to study the types of
relationships that were formed among the employees based on frequency and energizing or
de-energizing effect. Using linear regression analysis, it has been found that the nature of relationships
among employees has a significant impact on manager rated performance scores and also that the
shortest path in functional and dysfunctional networks affect the manager rated performance
4
CHAPTER 2: BACKGROUND
In this section, a summary of previous research on functional and dysfunctional
relationships and an overview of the literature on individual performance is provided.
2.1 Dysfunctional and functional relationships
Construction and engineering organizations are known to have strict project constraints
(e.g. cost, and schedule) which is expected that employees’ stress level. The activities or situations
that might cause stress among employees are called stressors (Leung, Chan and Yu, 2009;
Skitmore et al. 2005b) Construction activities, work tasks and people are some of the examples of
stressors in the construction and engineering industry. The impact of stressors on the individuals
depends on the type of stressor (LePine, Podsakoff & LePine, 2007). Stressors can work both ways
and researchers have found that stressors can have both positive and negative impacts on
employees (LePine, Podsakoff & LePine, 2007). The stressors that are associated with the positive
impacts such as promoting personal growth and achievement are called challenge stressors,
whereas stressors that are associated with negative impacts such as turnover and job dissatisfaction
are called hindrance stressors (Boswell et al. 2004; Cavanaugh et al. 2000).
Previous empirical work on stressors has identified the role of challenge and hindrance
stressors in job performance (LePine, Podsakoff & LePine, 2005; Beehr et al. 2000) and turnover
intentions (Hang-Yue, Foley and Loi 2007; Qasim, Javed and Shafi, 2014). For example, past
research has proved that hindrance stressors were negatively related to the job satisfaction and job
performance. People and the nature of relationships with employees is a type of stressor which can
have both positive and negative impacts on individual performance. For example, when we talk to
5
complemented on our work. Indeed, previous work has shown that the type of interactions affect
employees’ emotional experiences at work or their energy level (Elfenbien, 2007). Functional
relationships are relationships that energize and motivate people during their work (Cavanaugh et
al, 2000; LePine, Podsakoff & LePine, 2005), relationships that help employees find meaning in
their work and feel motivated (Kinjerski and Skrypne, 2004). Conversely, dysfunctional
relationships are relationships that de-energize and de-motivate people in their work. Functional
relationships are expected to help with job satisfaction, task performance and loyalty, whereas the
dysfunctional relationships might be associated with employee turnover as they are negatively
related to the job attitudes, job satisfaction and organizational commitment. (LePine, Podsakoff &
LePine, 2007). Additionally, Cavanaugh et al. (2000) found that employees tend to see
dysfunctional relationships as obstacles for personal growth and task accomplishment whereas the
functional relationships are viewed to be promote achievement and personal development. The
importance of functional and dysfunctional relationships has been studied in the management
literature, in the context of mentorship between senior employees and junior employees (Scandura,
1998), decision making by managers and organizational conflict resolution (Labianca, Brass and
Gray; 1998). However, their importance has been understudied in the context of construction and
engineering organizations. The relationships in construction and engineering organizations are
especially important because the tasks are highly interdependent. To achieve project goals,
engineers need to interact and share their knowledge with other engineers to get their work done.
As a result, everyday interactions with colleagues become important for their job performance. For
instance, when there is a positive relation between two colleagues they share useful knowledge
which could reduce their time spent on a particular project task (Poleacovschi et al. 2017) which
6
2.2 Individual performance
In the time where construction and engineering industry is increasingly competitive,
performance measures have become critical to organizational success (Bassioni, Price and Hassan;
2004). Construction and management literature has identified a few important factors that
influence individual performance including work processes, work structures and personal
characteristics. First, work processes that involve networks and ties affects individual performance
in a knowledge-intensive network (Cross and Cummings, 2004) as they provide unique
information and multiple perspectives to an individual working on a task. Second, work structures
such as rewards and incentives influence individual performance as they motivate employees to
stay committed to their work (Ajila and Abiola, 2004). Lastly, personal characteristics such as
emotional intelligence helps to increase individual performance and productivity as people who
are emotionally intelligent are able to identify and control their own emotions (Lam and Kirby,
2002). While these factors provide a comprehensive understanding of individual performance by
emphasizing macro (work processes and structures) and micro (personal characteristics) level
factors, they do not consider the dyad level relationships which represent an essential portion of
an employee’s time especially in project based-organizations where tasks are highly
inter-dependent. This research addresses the need to identify the relational antecedents of individual
performance in construction and engineering organizations.
The goal of this study is to understand the impact of functional and dysfunctional
relationships on individual performance by classifying the types of relationships in office based
on responses from the survey questions. Present work covers the gaps in the previous literature by
proving that relationships can also be a stressor and affect individual performance. This research
7
CHAPTER 3: METHODS
The study was conducted using the data obtained from a global construction and
engineering organization. The company provides consultation and management services for
construction, engineering, hydropower, mining and transportation. The company has various
locations all over the world and employs 7000 people. The company provides preconstruction
services, construction services, operations and maintenance and a full range of project delivery
methods. They focus on constructing new facilities, infrastructure improvement and expansion,
waste to energy construction and capital construction services.
3.1 Data collection
The data was obtained from the manager of the company who conducted a survey with the
goal to improve performance and knowledge sharing among employees. The survey data was
collected from the IT department of the company. A total of 161 employees were surveyed and a
66% response rate was obtained. Every employee in the department was provided the survey and
asked to rate significant work connections, the type of relationships (functional and dysfunctional
relationships) and individual attributes (hierarchy level, tenure and gender). Data on individual
performance was obtained from the dataset that included individual performance as rated by the
managers.
3.2 Significant work connections
In this study, significant work connections are considered as those with whom people
frequently share knowledge. As such, to capture significant work connections employees were
asked to identify and rate every individual with whom they interact and share knowledge with.
8
the people we work with to provide us with information to get our work done. For example, people
might provide us with simple or routine administrative or technical information that we need to
do our work. Alternatively people might provide us with complex information or engage in
problem solving with us to help us solve novel problems. Please indicate the extent to which the
people listed below provide you with information you use to accomplish your work.” The question
was assessed on a scale of 0 to 6 (0=I Do Not Know This Person/I Have Never Met this Person; 1
= Very Infrequently; 2 = Infrequently; 3 = Somewhat Infrequently; 4 = Somewhat Frequently; 5
= Frequently; 6 = Very Frequently).” Based on the responses to this question the relationships
were classified into two categories, infrequent and frequent. Infrequent relationships are those that
were rated 0 (I do not know this person), 1 (Very Infrequently), 2 (Infrequently) or 3 (Somewhat
Infrequently) while frequent relationships are those that were rated 4 (Somewhat Frequently), 5
(Frequently) or 6 (Very Frequently). Infrequent relationships were excluded from they are
expected to have insignificant effect on the performance of employees.
3.3 Functional and dysfunctional relationships
The variable was operationalized based on a single item to reduce a respondent’s cognitive
effort of rating the entire department. Respondents were provided a list of people in the department
and asked to respond to the following prompt: “When an individual interacts with their colleagues
they might be energized or de-energized based on the qualities of the opposite person. When you
interact with this person, how does it affect your energy level? The question was assessed on a
scale of 0 to 4 (0 = De-energizing; 1 = Somewhat de-energizing; 2 = No effect; 3 = Somewhat
energizing; 4 = Energizing)”. Based on the responses to this question the relationships were
classified into two categories, de-energizing and energizing. De-energizing relationships are those
9
are those that were rated as 3 (Somewhat) or 4 (Energizing). The relationships that were rated 2
(No effect) were not included in this analysis since they are expected to have no effect on
employees’ everyday activity. The final dataset on functional relationships included those
relationships that were frequent and energizing whereas dysfunctional relationships included
frequent and energizing relationships.
3.4 Individual Attributes: Hierarchy, Tenure and Gender
In the survey the employees were also asked to identify their hierarchal level on a scale of
1 to 5 (1 = Individual Contributor/Team Member; 2 = Supervisor/Team Leader; 3 = Project
Manager/Program Manager; 4 = Manager/Business Unit Manager; 5 = Director). The
employees were also asked to mention their tenure at the company in number of years. The gender
data of the employees was provided by the company and coded as 0 (females) and 1 (males). These
variables were considered as control variables as they could affect individual performance.
3.5 Individual performance
Individual performance data is generated by asking the managers to rate the people whom they
have supervised on a scale of 1 to 5 points based on the eight dimensions which the organization
believed were major factors for the project performance: (1) Knowledge and skills, (2) business
development, (3) client service management, (4) project management, (5) general management,
(6) leadership, (7) decision-making and (8) baseline skills. Since every employee is not assessed
or involved in project management and general management decisions, these two scores were
excluded from the analysis. The average of the six remaining scores was calculated and termed as
manager rated performance score and the individual dimensions of the average were termed as
manager rated individual scores. In the present research both manager rated performance scores
10
CHAPTER 4: DATA ANALYSIS
The following section explains the methods used to calculate the centrality scores, shortest
path and the average of individual performance based on functional and dysfunctional
relationships.
4.1 Social network analysis
Social network analysis is a method used to quantify and map the relationships among any
connected entities (e.g. groups, organizations, people, computers) (Wasserman and Faust, 1994).
It also provides analytical tools that allows us to perform mathematical analysis regarding
individual and network properties and patterns. People who are involved in a social network, which
are called nodes, are connected either directly or indirectly to other nodes.
There are multiple social network analysis indicators that can be calculated at the node
level to describe different phenomena. The most widely used indicators includes centrality score
which is used to determine how influential a node is in a particular network. Centrality scores were
used in this research to determine how influential each employee is, based on their ability to
energize or de-energize their network ties and also how their network ties energize or de-energize
them. It can be calculated by using the formula listed below.
𝐶𝑖 =
∑𝑗:𝑗≠1𝑦𝑖,𝑗 𝑛 − 1
Where 𝐶𝑖 = Centrality of node i
𝑦𝑖,𝑗 = Weight of incident links of i
11
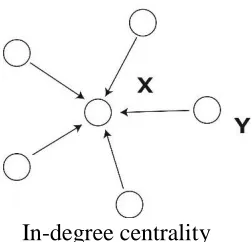
In-degree centrality of a node is the number of inbound links to a node. These scores help
to understand how people energize or de-energize their network ties based on the number of
functional or dysfunctional ties that they have. They can be calculated using the formulas listed
below.
𝐶𝑖𝑖 = ∑𝑗:𝑗≠1𝑦𝑗,𝑖 𝑛 − 1
Where 𝐶𝑖𝑖 = In-degree centrality of node i
𝑦𝑗,𝑖= Weight of incident links directed towards i
[image:18.612.241.367.353.474.2]n = Total number of nodes
Figure 1 Visual representation of in-degree centrality
In-degree centrality
In-degree centrality scores for both functional and dysfunctional networks were calculated
for each node, or person, using Netminer software. As a result, two variables were included in the
final analysis as independent variables which are functional in-degree and dysfunctional in-degree
scores. Functional in-degree represents the number of ties that a node has in the functional network
and its impact on those ties whereas dysfunctional in-degree represents the number of ties a node
has in a dysfunctional network and its impact on those ties.
Another important indicator used in this research includes the shortest path. A path is a
12
helps us to calculate average distance between a particular node and the rest of the nodes in a
network minimizing the total associations in the path. High shortest path scores indicates that more
number of steps are required to connect with others and low shortest path scores indicates that
lower number of steps are required to connect with others. It can be used to understand the pattern
of information flow and also the possibilities for fastest flow. The shortest path scores were
calculated for each node involved in functional and dysfunctional networks using Netminer
software and are termed as functional shortest path and dysfunctional shortest path scores.
Functional shortest path score represents the number of steps required to connect with a person in
functional network and dysfunctional shortest path represents the number of steps required to
connect with a person in dysfunctional network.
4.2 Linear regression analysis
Linear regression analysis is a widely used predictive analysis which identifies if a set of
independent variables are affecting the outcome variable or dependent variable. Specifically, it
helps identify which variable has the most significant impact and also the magnitude with which
the independent variable affects the dependent variable. The regression estimates help explain the
relationship between one dependent variable and one or more independent variables. In this
research, linear regression analysis was performed using the software JMP pro to determine the
impact of functional and dysfunctional relationships on individual performance of the employees
by using centrality and shortest path scores. Since the functional and dysfunctional relationships
are expected to have an impact on the individual performance they are called independent variables
13
CHAPTER 5: RESULTS
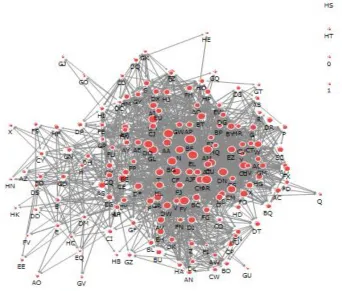
The following figures represents the functional and dysfunctional networks using spring
map and concentric map. These maps can be used as a tool to identify the nature of networks and
[image:20.612.143.485.236.527.2]centrality of the people involved in the network.
Figure 2 Spring map for functional network
The red dots on the map represent the nodes of the network and the size of the dot represents the
level of its centrality. The larger the dot is, the higher is its centrality score. The lines that are
14
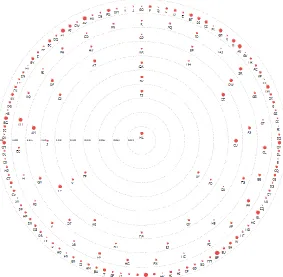
Figure 3 Concentric map of functional network
The red dots on the map represent the nodes in the network and their distance from the center is
based on the magnitude of the centrality. The dots closest to the center are the ones with highest
centrality.
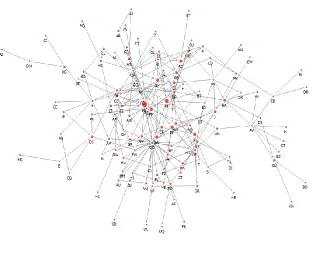
[image:21.612.142.454.465.722.2]15
The red dots on the map represent the nodes of the network and the size of the dot represents the
level of its centrality. The lines that are connecting the dots represent the dysfunctional
[image:22.612.172.455.194.471.2]relationships between the employees.
Figure 5 Concentric map of dysfunctional network
The red dots on the map represent the nodes in the network and their distance from the center is
based on the magnitude of the centrality. The dots closest to the center are the ones with highest
16
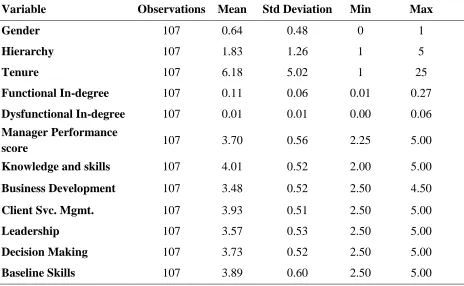
Table 1 represents the descriptive statistics of all the variables used in the linear regression
[image:23.612.76.540.172.458.2]analysis.
Table 1 Descriptive statistics of variables
Variable Observations Mean Std Deviation Min Max
Gender 107 0.64 0.48 0 1
Hierarchy 107 1.83 1.26 1 5
Tenure 107 6.18 5.02 1 25
Functional In-degree 107 0.11 0.06 0.01 0.27
Dysfunctional In-degree 107 0.01 0.01 0.00 0.06
Manager Performance
score 107 3.70 0.56 2.25 5.00
Knowledge and skills 107 4.01 0.52 2.00 5.00
Business Development 107 3.48 0.52 2.50 4.50
Client Svc. Mgmt. 107 3.93 0.51 2.50 5.00
Leadership 107 3.57 0.53 2.50 5.00
Decision Making 107 3.73 0.52 2.50 5.00
Baseline Skills 107 3.89 0.60 2.50 5.00
To study the impact of functional and dysfunctional relationships on individual
performance, the manager rated performance scores were compared to the functional in-degree
and dysfunctional in-degree using the linear regression analysis.
Table 2 includes the results for relationship between the functional and dysfunctional
in-degree centrality scores and manager rated performance scores. The results in model 1 evaluate
the relationship between dysfunctional in-degree centrality and manager rated performance scores.
The results indicate a positive coefficient but no significant effect (P>0.05). Model 2 evaluates the
17
indicate a positive coefficient with a significant effect (P<0.05). For instance, in model 1, a 1 unit
standard deviation increase of dysfunctional in-degree centrality is associated with 1.65 units of
standard estimate increase in the manager rated performance scores. Similarly, in model 2, a 1 unit
standard deviation increase of in-degree functional centrality is associated with 11.29 units of
standard estimate increase in manager rated performance scores.
Table 2 Linear regression analyses results for functional and dysfunctional in-degree centrality
and manager rated performance scores
Variables Model 1 Model 2
Gender 0.02 (0.06) 0.03 (0.06)
Tenure 0.01 (0.01) 0.00 (0.01)
Hierarchy -0.07 (0.05) -0.09 (0.05)
In-degree dysfunctional 1.65 (0.91)
In-degree functional 11.29 (5.52)a Note: Linear regression coefficients are standardized
aCorrelation is significant at p<0.05
bCorrelation is significant at p<0.01
cCorrelation is significant at p<0.001; N=107
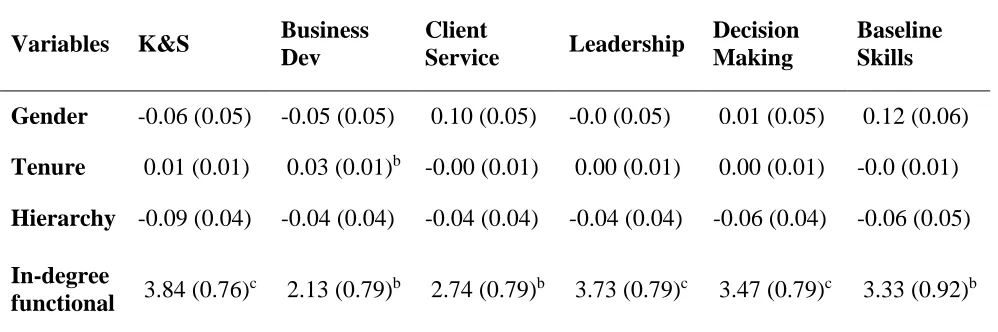
Table 3 includes the results for relationship between functional in-degree centrality and
manager rated individual scores. The results indicates a positive coefficient with highly significant
effect (P<0.001) on knowledge and skills, leadership and decision making skills scores. It also
indicates a positive coefficient with a significant effect (P<0.01) on business development skills,
client service management and baseline skills. For instance, a 1 unit standard deviation increase of
functional in-degree centrality is associated with 3.73 units of standard estimate increase in the
[image:24.612.81.525.282.399.2]18
Table 3 Linear regression analyses results for functional in-degree centrality and manager rated
individual scores
Variables K&S Business Dev
Client
Service Leadership
Decision Making
Baseline Skills
Gender -0.06 (0.05) -0.05 (0.05) 0.10 (0.05) -0.0 (0.05) 0.01 (0.05) 0.12 (0.06)
Tenure 0.01 (0.01) 0.03 (0.01)b -0.00 (0.01) 0.00 (0.01) 0.00 (0.01) -0.0 (0.01)
Hierarchy -0.09 (0.04) -0.04 (0.04) -0.04 (0.04) -0.04 (0.04) -0.06 (0.04) -0.06 (0.05)
In-degree
functional 3.84 (0.76)
c 2.13 (0.79)b 2.74 (0.79)b 3.73 (0.79)c 3.47 (0.79)c 3.33 (0.92)b
Note: Linear regression coefficients are standardized
aCorrelation is significant at p<0.05
bCorrelation is significant at p<0.01
cCorrelation is significant at p<0.001; N=107
Table 4 includes the results for relationship between dysfunctional in-degree centrality and
manager rated individual scores. The results indicate both positive and negative coefficients with
[image:25.612.71.566.520.631.2]no significant effect (P>0.05) on any individual score.
Table 4 Linear regression analyses results for dysfunctional in-degree centrality and manager rated
individual scores
Variables K&S Business Dev
Client
Service Leadership
Decision Making
Baseline Skills Gender -0.06(0.05) -0.05(0.05) 0.09(0.05) -0.0(0.05) 0.01(0.05) 0.12(0.06)
Tenure 0.01(0.01) 0.02(0.01)a 0.00(0.01) 0.00(0.01) 0.00(0.01) -0.0(0.01)
Hierarchy -0.06(0.06) -0.01(0.04) 0.01(0.04) -0.0(0.05) -0.0(0.05) -0.03(0.05)
In-degree
dysfunctional 7.72(5.11) 1.76(5.00) -0.84(5.02) 6.2(5.27) 1.57(5.24) 7.53(5.91)
Note: Linear regression coefficients are standardized
aCorrelation is significant at p<0.05
bCorrelation is significant at p<0.01
19
From the set of results represented above, it was observed that people with high functional
in-degree centrality have higher performance ratings. A potential explanation for the positive and
significant relationship between functional in-degree and individual performance is that people
who are involved in frequent functional interactions could share information more easily within
their networks which could help them perform better in their daily tasks.
Table 5 includes the results for relationship between shortest path functional and shortest
path dysfunctional on manager rated performance scores. The results in model 1 indicates a
negative coefficient with a significant effect (P<0.01) of functional shortest path on manager rated
performance scores. The results in model 2 indicates a negative coefficient with no significant
effect (P>0.05) of dysfunctional shortest path on manager rated performance scores. For instance,
a 1 unit standard deviation increase in the functional shortest path is associated with 0.11 units
standard estimate decrease in the manager rated performance scores of the employees. It means
that when the length of shortest path in a functional network between two nodes is increased the
performance of the employees is decreased. No significant impact of shortest paths in
dysfunctional network was observed on the manager rated performance scores.
Table 5 Linear regression analyses results for functional and dysfunctional shortest paths and
manager rated performance scores
Variables Model 1 Model 2
Gender 0.00 (0.04) 0.01 (0.04)
Tenure 0.01 (0.01) 0.01 (0.01)
Hierarchy 0.00 (0.03) -0.00 (0.03)
Shortest Path Functional -0.11 (0.04)b
Shortest Path Dysfunctional -0.03 (0.03) Note: Linear regression coefficients are standardized
aCorrelation is significant at p<0.05
bCorrelation is significant at p<0.01
[image:26.612.72.503.541.641.2]20
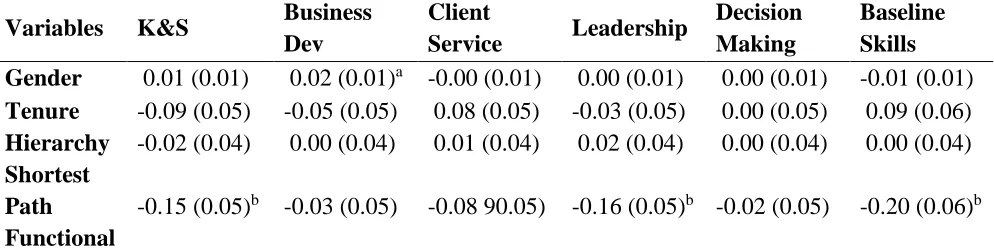
Table 6 includes the results for relationship between functional shortest path and manager
rated individual scores. The results indicate a negative coefficient with a significant effect (P<0.01)
of functional shortest path on knowledge and skills, leadership and baseline skills. For instance, a
1 unit standard deviation increase in the functional shortest path is associated with 0.15 units of
[image:27.612.75.572.267.392.2]standard estimate decrease in knowledge and skills scores.
Table 6 Linear regression analyses results for functional shortest path and manager rated individual
scores
Variables K&S Business Dev
Client
Service Leadership
Decision Making
Baseline Skills Gender 0.01 (0.01) 0.02 (0.01)a -0.00 (0.01) 0.00 (0.01) 0.00 (0.01) -0.01 (0.01)
Tenure -0.09 (0.05) -0.05 (0.05) 0.08 (0.05) -0.03 (0.05) 0.00 (0.05) 0.09 (0.06)
Hierarchy -0.02 (0.04) 0.00 (0.04) 0.01 (0.04) 0.02 (0.04) 0.00 (0.04) 0.00 (0.04)
Shortest Path Functional
-0.15 (0.05)b -0.03 (0.05) -0.08 90.05) -0.16 (0.05)b -0.02 (0.05) -0.20 (0.06)b
Note: Linear regression coefficients are standardized
aCorrelation is significant at p<0.05
bCorrelation is significant at p<0.01
cCorrelation is significant at p<0.001; N=107
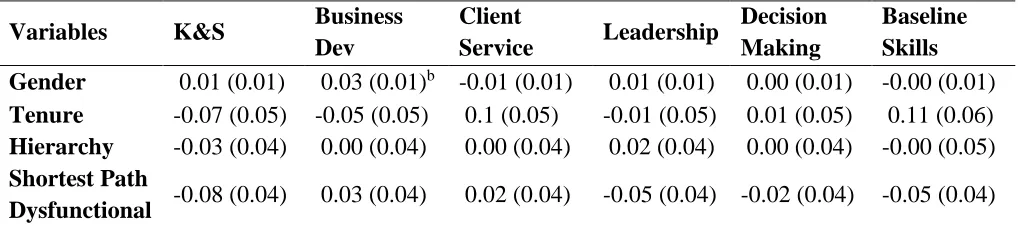
Table 7 includes the results for relationship between dysfunctional shortest path and
manager rated individual scores. The results indicates both positive and negative coefficients with
no significant effect (P>0.05) of dysfunctional shortest path on the manager rated individual
21
Table 7 Linear regression analyses results for dysfunctional shortest path and manager rated
individual scores
Variables K&S Business Dev
Client
Service Leadership
Decision Making
Baseline Skills Gender 0.01 (0.01) 0.03 (0.01)b -0.01 (0.01) 0.01 (0.01) 0.00 (0.01) -0.00 (0.01)
Tenure -0.07 (0.05) -0.05 (0.05) 0.1 (0.05) -0.01 (0.05) 0.01 (0.05) 0.11 (0.06)
Hierarchy -0.03 (0.04) 0.00 (0.04) 0.00 (0.04) 0.02 (0.04) 0.00 (0.04) -0.00 (0.05)
Shortest Path
Dysfunctional -0.08 (0.04) 0.03 (0.04) 0.02 (0.04) -0.05 (0.04) -0.02 (0.04) -0.05 (0.04)
Note: Linear regression coefficients are standardized
aCorrelation is significant at p<0.05
bCorrelation is significant at p<0.01
cCorrelation is significant at p<0.001; N=107
From the set of results represented above, it was observed that people with low shortest
path scores in functional network have higher performance ratings. A potential explanation for
this observation is that people with low shortest path scores have shorter average distance to other
nodes in the network which helps them approach others more easily when seeking and sharing
[image:28.612.73.582.127.240.2]22
CHAPTER 6: DISCUSSIONS AND IMPLICATIONS
This case study used data obtained from a global construction and engineering organization
was used to study the impact of functional and dysfunctional relationships on individual
performance. These relationships were classified into functional and dysfunctional relationships
depending on employee’s perceptions on whether they felt energized or de-energized by the people
with whom they frequently interacted. Social network analysis was used to calculate the in-degree
centrality scores and shortest path scores for each employee based on their functional and
dysfunctional connections. In-degree centrality scores were calculated based on the number of ties,
or connections, that each node has within their functional or dysfunctional networks. Shortest path
scores were calculated based on the average of distances between a source node and rest of the
nodes in a network. Linear regression analysis was used to calculate the impact of functional
in-degree centrality, dysfunctional in-in-degree centrality, functional shortest path and dysfunctional
shortest path scores on manager rated performance scores.
The first set of results revealed the relationship between the in-degree centrality of people
in functional and dysfunctional networks and manager rated performance scores. Social network
analysis was used to calculate the in-degree centrality scores for each employee based on their
functional and dysfunctional connections.The results from this analysis showed the number of
inbound, or incoming, connections (functional or dysfunctional) that each node has. Linear
regression analysis was used to study the impact of in-degree centrality of functional and
dysfunctional networks on manager rated performance. The results (Table 2) indicate that
functional in-degree centrality of the employees has a significant positive impact on the manager
rated performance scores. The results (Table 3) also indicates that functional in-degree centrality
23
results show that a person’s performance was improved when they were frequently connected with
the people who energized them. A potential explanation for the positive and significant
relationship between functional in-degree and individual performance is the utility of functional
relationships towards individual work productivity. Specifically, people who are involved in
frequent functional interactions could share information more easily within their networks which
could help them perform better in their daily tasks. On the other hand, another set of results (Table
2) indicates that the manager rated performance scores of people with high dysfunctional in-degree
centrality was not affected in a significant way. This also applies in the case of manager rated
individual scores (Table 4) where dysfunctional in-degree centrality had no significant impact on
any of the manager rated individual scores. It means that a person’s performance was not affected
when they were frequently connected with people who de-energized them .
The second set of results revealed the relationship between shortest path scores of
employees in functional and dysfunctional networks and manager rated performance scores.
Social network analysis was used to calculate the shortest path scores of every employee based on
their functional and dysfunctional connections. The results of this analysisshowed the average of
distances between a source node and the rest of the nodes in a network. Linear regression analysis
was used to determine the impact of functional and dysfunctional shortest path scores on manager
rated performance scores. The results (Table 5) indicate that shortest path scores in functional
networks have a significant negative effect on the manager rated performance scores. The results
(Table 6) also indicate that shortest paths in functional network have a significant negative impact
on knowledge and skills, leadership and baseline skills of the employee. This means that people
with low shortest path scores in functional network are associated with improved manager rated
24
with low shortest path scores have shorter average distance to other nodes in the network which
helps them approach others more easily when seeking and sharing information. As a result, they
perform better in their daily tasks. On the other hand, another set of results (Table 5) indicates that
shortest path scores of employees in dysfunctional networks have no significant impact on the
manager rated performance scores. The results (Table 7) also indicate that shortest path scores in
dysfunctional networks have no significant impacts on the manager rated individual scores. This
means that shortest path scores in dysfunctional networks does not affect either manger rated
performance scores or manager rated individual scores of the employees.
This study has practical implications by showing that frequent and functional interactions
between employees help employees to improve their individual performance. An explanation for
this finding is that frequent and positive interactions affect employees’ work productivity as they
can easily reach out to their netowkr with the goal to solve everyday work problems. This study
adds to the theory of stressors and their impact on employees by showing that interpersonal
relationships among employees can also be viewed as a stressor that affects individual
performance. As a result, the current case study improves understanding regarding the impact of
25
CHAPTER 7: CONCLUSIONS
To conclude, the results in this study showed that functional relationships in the workplace
positively contribute to individual performance. A potential explanation for these results is that
people feel motivated and energized when they interact with their functional peers. Therefore,
practitioners are encouraged to promote functional relationships and interactions in the workplace.
This research contributes to current construction management research by identifying the
antecedents of individual performance. Additionally, functional and dysfunctional relationships
were studied in the context of turnover intentions, employees’ experiences and job satisfaction
while this research studied the nature of relationships in the context of individual performance.
The current research comes with various limitations and scope for future research. First,
the data was obtained from a single company and it cannot be generalized to other companies
without further investigation. Second, the performance data was obtained based on the managers’
assessment which are subjective scores and may not necessarely be representative of actual
performance. Future research could focus on addressing the gaps in this research by obtaining data
26
CHAPTER 8: REFERENCES
Ajila, C., & Abiola, A. (2004). Influence of rewards on workers performance in an organization. Journal of
Social Sciences, 8(1), 7-12.
Barraza, G. A., Back, W. E., & Mata, F. (2004). Probabilistic forecasting of project performance using
stochastic S curves. Journal of Construction Engineering and Management, 130(1), 25-32.
Bassioni, H. A., Price, A. D., & Hassan, T. M. (2004). Performance measurement in construction. Journal
of management in engineering, 20(2), 42-50.
Beehr, T. A., Jex, S. M., Stacy, B. A., & Murray, M. A. (2000). Work stressors and coworker support as
predictors of individual strain and job performance. Journal of Organizational Behavior, 21(4),
391-405.
Boswell, W. R., Olson-Buchanan, J. B., & LePine, M. A. (2004). Relations between stress and work
outcomes: The role of felt challenge, job control, and psychological strain. Journal of Vocational
Behavior, 64(1), 165-181.
Cavanaugh, M. A., Boswell, W. R., Roehling, M. V., & Boudreau, J. W. (2000). An empirical examination of
self-reported work stress among US managers. Journal of applied psychology, 85(1), 65.
Chan, A. P., Scott, D., & Chan, A. P. (2004). Factors affecting the success of a construction project. Journal
of construction engineering and management, 130(1), 153-155.
Cheng, E. W., & Li, H. (2006). Job performance evaluation for construction companies: an analytic network
process approach. Journal of Construction Engineering and Management, 132(8), 827-835.
Cross, R., & Cummings, J. N. (2004). Tie and network correlates of individual performance in
knowledge-intensive work. Academy of management journal, 47(6), 928-937.
Elfenbein, H. A. (2007). 7 Emotion in organizations: a review and theoretical integration. The academy of
27
Hang-Yue, N., Foley, S., & Loi, R. (2005). Work role stressors and turnover intentions: A study of
professional clergy in Hong Kong. The International Journal of Human Resource
Management, 16(11), 2133-2146.
Kinjerski, V. M., & Skrypnek, B. J. (2004). Defining spirit at work: Finding common ground. Journal of
organizational change management, 17(1), 26-42.
Labianca, G., Brass, D. J., & Gray, B. (1998). Social networks and perceptions of intergroup conflict: The
role of negative relationships and third parties. Academy of Management journal, 41(1), 55-67.
Lam, L. T., & Kirby, S. L. (2002). Is emotional intelligence an advantage? An exploration of the impact of
emotional and general intelligence on individual performance. The journal of social
Psychology, 142(1), 133-143.
LePine, J. A., Podsakoff, N. P., & LePine, M. A. (2005). A meta-analytic test of the challenge stressor–
hindrance stressor framework: An explanation for inconsistent relationships among stressors and
performance. Academy of management journal, 48(5), 764-775.
Leu, S. S., & Lin, Y. C. (2006). Project performance evaluation based on statistical process control
techniques. Journal of Construction Engineering and Management, 134(10), 813-819.
Leung, M. Y., Chan, Y. S., & Yu, J. (2009). Integrated model for the stressors and stresses of construction
project managers in Hong Kong. Journal of Construction Engineering and Management, 135(2),
126-134.
Leung, M. Y., Ng, S. T., Skitmore, M., & Cheung, S. O. (2005). Critical stressors influencing construction
estimators in Hong Kong. Construction Management and Economics, 23(1), 33-44.
Podsakoff, N. P., LePine, J. A., & LePine, M. A. (2007). Differential challenge stressor-hindrance stressor
relationships with job attitudes, turnover intentions, turnover, and withdrawal behavior: a
meta-analysis. Journal of applied psychology, 92(2), 438.
Poleacovschi, C., & Javernick-Will, A. (2016). Spanning Information and Knowledge across Subgroups and
28
Poleacovschi, C., Javernick-Will, A., & Tong, T. (2017). The link between knowledge sharing connections
and employee time savings: A social network analysis. Construction Management and
Economics, 35(8-9), 455-467.
Qasim, T., Javed, U., & Shafi, M. S. (2014). Impact of stressors on turnover intention: Examining the role
of employee well-being. International Journal of Social, Management, Economics and Business
Engineering, 8(1), 181-189.
Scandura, T. A. (1998). Dysfunctional mentoring relationships and outcomes. Journal of
management, 24(3), 449-467.
Tuuli, M. M., & Rowlinson, S. (2009). Performance consequences of psychological empowerment. Journal
of construction engineering and management, 135(12), 1334-1347.
Wasserman, S., & Faust, K. (1994). Social network analysis: Methods and applications (Vol. 8). Cambridge