RESEARCH
Characteristics of Nitisol profiles
as affected by land use type and slope class
in some Ethiopian highlands
Eyasu Elias
*Abstract
Background: The success of soil management depends on understanding of how soils respond to agricultural land use practices over time. Nitisols are among the most extensive agricultural soils in the Ethiopian highlands but soil degradation threatens their productive capacity. In this study, the effects of two land use systems, intensive cereal and agroforestry systems, and slope class on physical and chemical characteristics of some Nitisol profiles were investigated. In total 12 sample profiles were described and soil samples were collected from each of the identified master horizon. Soil physical characteristics evaluated were particle size distribution, structural aggregate stability, water holding capacity and bulk density. Chemical characteristics determined were exchangeable bases and cation exchange capacity, soil pH and the contents of organic carbon (OC), total nitrogen (TN), available phosphorus (AP) and some micronutrients.
Results: Among the physical characteristics, land use and slope significantly (p < 0.05) affected particle size distribu-tion and plant available water content. The mean sand (28%) and silt (26%) particles in the intensive cereal system were significantly (p < 0.05) higher compared to 15% sand and 18% silt in the agroforestry system. Conversely, the mean values of fine grained texture materials including 39% fine sand, 42% fine silt and 67% clay in the agroforestry system were significantly higher than 30% fine sand, 21% fine silt and 46% clay in the cereal system. Similarly, the lower slope had significantly (p < 0.05) higher fin texture materials (39% fine sand, 30% fine silt, and 63%) clay) com-pared to 17% fine sand, 14% fine silt and 51% clay fractions in the upper slope. The proportion of water stable aggre-gate (WSA) were highlight (63–94%) and there was no significant difference between land types and slope classes. Following from high structural aggregate stability, the soils have high water holding capacity that ranged from 22 to 32% at PWP to 34–49% at FC while plant available water content (AWC) was in the 120–230 mm m−1 range. Consider-ing the chemical characteristics, land use significantly affected soil pH, total nitrogen (TN), exchangeable magnesium (Mg2+), potassium (K+), percent base saturation (PBS), and available micro nutrients—iron (Fe2+), manganese (Mn2+) and zinc (Zn2+). The mean pH value (5.29) in the intensive cereal system strongly acidic while the pH value for the agroforestry system (6.12) was taken moderately acidic. The mean OC content was 2.0 and 2.1% for the intensive cereal and agroforestry systems that were rated very low. The mean TN values were 0.15 and 0.22% for intensive cereal and agroforestry systems that were taken as low to very low. Similarly the mean values for AP were 8 and 10 mg kg−1 for cereal and agroforestry systems that were rated low. On the other hand, the CEC, exchangeable bases (Ca2+, Mg2+, K+) and PBS of the soil were rated high while Na+ appeared only in trace amount, and there was no significant differ-ence between land use type and slope classes except for Mg2+, K+ and PBS. Mean values of Mg2+ and K+ (15 and 3 cmol(+) kg−1) and PBS (75%) in the agroforestry system were significantly higher than those in the cereal system (6 and 1.6 cmol(+) kg−1 of Mg2+ and K+ and 51% PBS). Among micronutrients, land use significantly (p < 0.05) affected
© The Author(s) 2017. This article is distributed under the terms of the Creative Commons Attribution 4.0 International License (http://creativecommons.org/licenses/by/4.0/), which permits unrestricted use, distribution, and reproduction in any medium, provided you give appropriate credit to the original author(s) and the source, provide a link to the Creative Commons license, and indicate if changes were made.
Open Access
Background
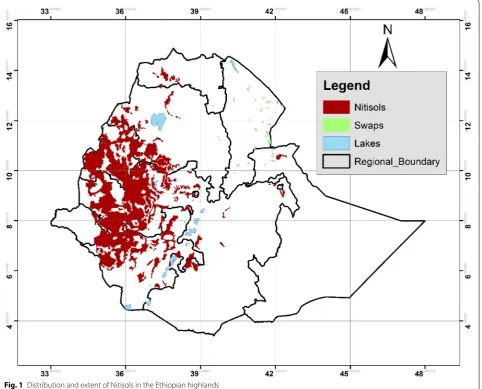
In Ethiopia, diversities in state factors such as topog-raphy, parent materials, climate and vegetation have resulted in the development of 18 soil types of which Nitisols are among the most extensive soils (FAO 1984; Elias 2016). Indeed, more than half of all the Nitisols of tropical Africa are found in the Ethiopian highlands fol-lowed by Kenya, Congo and Cameroon (Stocking 1988; FAO 2001). Different reports provide different area esti-mates of Nitisols in the Ethiopian highlands (FAO 1984; Zewdie 2013). The most recent survey puts the extent of Nitisols to cover about one million hectares that account for 31% of the agricultural lands in the Ethiopian high-lands (Elias 2016). The soils are particularly extensive in the south-western and north-central highlands repre-senting 64 and 25% of the agricultural landmass, respec-tively (Fig. 1). Nitisols are among the most productive agricultural soils along with Vertisols, Luvisols, and Planosols (Stocking 1988). They support the bulk of the cereal and livestock production in the Ethiopian high-lands. More importantly, the production of coffee (Cofea arabica), the most important export commodity in Ethi-opia, relies almost exclusively on Nitisols. In addition, the large proportion of tea production comes from strongly acidic Nitisols in the western part of the country (Elias 2002).
However, soil nutrient and organic matter depletion, acidification and soil erosion losses as result of inap-propriate land use practices have become major cause of concern for agricultural soils in the Ethiopian high-lands (Elias 2002; IFPRI 2010). In particular, due to the land form of occurrence (high to mountains relief hills with moderately steep slopes) and intensive cereal cul-tivation and cattle grazing, Nitisols have become prone to degradation in spite of their high structural aggregate stability to resist erosion (FAO 2001; Elias 2016). Land
use changes and cultivation of fields without adequate conservation practices, low levels of fertilizer application and failure to recycle crop residues are among the causal factors. Traditionally, soil fertility is replenished through fallow cycles of up to 20 years during which time the land gains fertility through atmospheric deposition, biologi-cal fixation and the supply of fresh organic matter and nutrients to the soils (Smaling and Braun 1996; Elias et al. 1998). As population increases, fallow periods are either shortened or abandoned altogether resulting in continu-ous cultivation of the land. In some parts of the Ethiopian highlands, steep slopes with gradients as steep as 50% are cultivated without installing adequate conservation measures (Assen and Tegene 2008). Often, resource-poor farmers have a short time horizon, i.e., they are primar-ily concerned with the crop and animal production of the forthcoming season than the long-term productivity of the soil. Longer-term processes that adversely affect agri-cultural sustainability such as depletion of soil organic matter and nutrient stocks are less visible and perhaps less noteworthy by farmers (Hailu et al. 2015; Elias 2016).
As result, land degradation has become a major policy concern in Ethiopia that is experiencing one of the high-est rates of soil erosion and nutrient depletion in Africa (Elias et al. 1998; Hailu et al. 2015; Laekemariam et al. 2016). The rate of soil erosion losses, 130 tons ha−1 for cultivated fields, was estimated to be one of the high-est in Africa (FAO 1986; Elias 2016). The depletion rate of macronutrients, −122 kg N ha−1, −13 kg P ha−1 and
−82 kg K ha−1, was estimated to be high (Haileslassie et al. 2005). The field level nutrient balances on Niti-sols reported from southern Ethiopia (−102, −45 and
−67 kg N, P and K ha−1) are even more threatening (Elias 2002).
Among the unsustainable land use practices farmers that fuel soil degradation include low and unbalanced available Fe2+, Mn2+ and Zn+. The mean values of Fe2+ (97 mg kg−1) and Mn2+ (68 mg kg−1) in the agroforestry
system were taken as excessively high while they were moderately sufficient (37, 39 mg kg−1, respectively) in the cereal system. Slope effects were significant for OC, TN and AP having higher mean values (2.5% OC, 0.22% TN and 17 mg kg−1 AP) in the lower slope than in the upper slope (1.5% OC, 0.13% TN and 8 mg kg−1 AP).
Conclusion: Land use and slope had significant effect on some soil physical and chemical characteristics. The land use practices in the intensive cereal system are adversely affecting important soil characteristics as compared to the soil under the agroforestry system. These include alteration of particle size distribution, strongly acidic soil reaction, organic matter and nutrient depletion (N, P, K and Zn) and low plant available water content. Among the inappro-priate land use practices include repeated cultivation to create fine seedbed that predisposes the soil to erosion, unbalanced fertilizer application, rotation of maize with potato that are depleting soil nutrient stocks (e., K and Zn), and removal of crop residues from fields. Therefore, a more balanced fertilizer blend application that contain N, P, K and Zn combined with liming to raise soil pH, organic matter management and integrated soil water conservation are recommended.
fertilizer application leading to mining of soil nutrient stocks, complete removal of crop residues, and dung burning as household energy rather than recycling to augment soil fertility and intensive tilling to create smooth seed bed for small cereals that predisposes the soil to erosion (Elias 2002; Hailu et al. 2015). In addi-tion, research reports suggest that continued application of nitrogen and phosphorus alone would accentuate the uptake and deficiency of other nutrients that are not sup-plied in the fertilizer. Application of N and P fertilizer alone would particularly increase the uptake of micro-nutrients (e.g., Zn, Bo, Mn) and eventually depletes them unless included in the fertilizer scheme (FAO 2006b; Elias 2016).
The government of Ethiopia has initiated various inter-ventions to arrest soil degradation primarily mass mobi-lisation and participatory watershed protection and fertilizer extension. Until 2015, a blanket recommenda-tion of 150 kg DAP ha−1 (Di-ammonium Phosphate: 18%
production while at the same time maintaining soil qual-ity (through balanced nutrition) and reversing nutrient depletion.
A more nuanced approach should, therefore, take into considerations of the spatial diversities in soil nutrient stocks and land use practices, which are factors driv-ing crop demand for soil nutrients (Elias 2016). On the one hand, studies suggest that soil fertility deple-tion and land use effects on soil physical and chemical characteristics vary strongly across land use type, slope gradients and soil types (Gebreselassie et al. 2015; Hailu et al. 2015; Laekemariam et al. 2016). On the other hand, reports suggest that land use effects vary consid-erably with soil types with some soils being more prone to physical and chemical deterioration than others (USDA-NRCS 2014). For example, Gebreselassie et al. (2015) working on Luvisols in the central highlands of Ethiopia reported significantly higher mean values of organic matter, TN and exchangeable bases in the lower slope than in the upper slopes. Information on the effects of land use type and slope class on the physical and chemical characteristics of Nitisol is largely lack-ing for the Ethiopian highlands thus implack-inglack-ing up on more nuanced soil fertility management decisions. Such information is crucially important for planning soil management strategies that curb the adverse effects of inappropriate land use on soil characteristics. Hence, this study was set out to evaluate how Nitisols profiles occurring in upper and lower slope positions respond to different land use types in terms of their physical and chemical characteristics.
Soil sites and methods Location, landform and geology
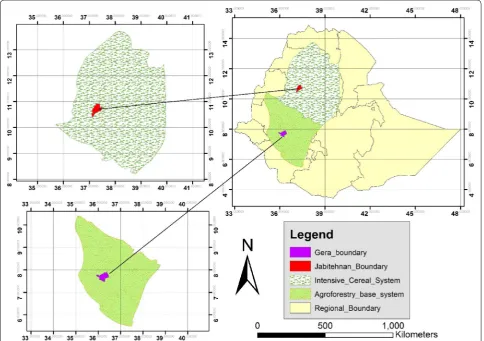
The study was conducted in two districts (Jabi Tehnan and Gera) representing the cereal and agroforestry systems in the north-central and south-western highlands where Nitisols are most dominant (Fig. 1). The landforms in the north central highlands are characterized by the undulat-ing to rollundulat-ing high plateaus with scattered moderate relief hills, dissected side slopes and river gorges including the popular Blue Nile gorge (Elias 2016). The landform in the south-western highlands is characterized by moderate to high relief mountains and undulating to rolling hills. Trap Series volcanic rocks (basalt, trachyte, ignimbrite ash flows, and tuff) predominate the high plateau landscapes in the north-central highlands. Basaltic basement com-plex was overflown by lavas in the Tertiary-Quaternary volcanic rocks resulting in geologically young soils that are developed over pre-weathered materials (Elias 2016). According to Davidson (1983), the geological materials building the soil profiles in the south-western highlands are recent pyroclastic deposits over the volcanic rocks of
the late Eocene to the late Oligocene period. Major parent materials include basic rocks such as alkali-olivine basalts, gabbro, amphibole mixed with more recent flood basalts and tuff.
Climate
Much of the Nitisol areas in the Ethiopian highlands are characterized by humid to sub-humid agro-climatic conditions (Elias 2016). The main monsoon rains over much of the Ethiopian highlands are influenced by the Inter-Tropical Convergence Zone (ITCZ) weather sys-tem as blown from the Atlantic Ocean. The average annual rainfall ranges between 1300 and 1600 mm in the north-central highlands that falls between June and September months. The rainy season is much extended in the south-western highlands spanning from Febru-ary to October with average annual rainfall in the range of 1800–2000 mm. The mean annual air temperature in much of the Ethiopian highlands is 22–25 °C (Elias 2016). According to Eswaren (1988) the Ethiopian highlands are categorized by udic soil moisture and hyperthermic soil temperature regimes.
Farming system and land use types
In the intensive cereal system, five major cereals form the staples for the population: tef1 (Eragrostis tef (Zucc), maize (Zea mais), wheat (Triticum aestivum), barley (Hordeum vulgarae) and sorghum (Sorghum bicolor). Maize-potato rotation is the main form of crop rotation and free range grazing in crop fields after harvest is com-monly practiced. In the agroforestry based system, the fields are divided into home gardens and distant out-fields. In the home gardens, enset2 (Enset ventricosum or
Musa ensete), coffee and shade trees (e.g., Cordia afri-cana) and fruit trees such as avocado (Persia americana) and mango (Mangifera indica) are typical features with undergrowth of root crops, tubers and species. The dis-tant out fields are planted to cereals (maize, wheat, tef)
that are cultivated in rotation with legumes such as faba bean (Vicia faba), haricot bean (Phaseulus vulgaris) and soybean (Glycinemax sp.) in certain places. Trees such as Codia africana, Milletia ferruginea, Croton macros-tachyus, and various species of acacia are interspersed in the crop fields providing fresh supply of organic matter in the form of leaf litter to the soil.
1 Tef (Eragrostis tef) is small cereal cultivated in Ethiopia for its grain that is
used to make the most favorite national food—Enjera. The plant rarely known as food staple outside of Ethiopia.
2 Enset (Enset ventricosum or Musa ensete otherwise called false banana) is
Soil fertility management practices are also distinctly dif-ferentiated according to the farming system. In the inten-sive cereal system the majority of farmers apply 150 kg DAP ha−1and 100 kg urea ha−1 as per the extension rec-ommendation thus, supplying 73–69 kg N-P2O5 ha−1. In the agroforestry system, the home gardens receive the application of farm yard manure and household refuse while the outer fields are treated with 75–50 kg DAP-urea ha−1, thus, supplying 37–35 kg N-P
2O5 ha−1. This is sup-plemented by application of on average 1.5–2.0 ton ha−1 of compost as well as systematic manuring through kraaling3 system (Elias 2016).
Soil sampling units
Following the intervention sites of the project4 that sup-ported the study and using the soil landscape map (Elias
3 During the dry season, cattle kraals are set up in crop fields that rotate to
new fields every two weeks thus systematically distributing animal dung over much of the cultivated outfields.
4 The Dutch project, Capacity building for scaling up of evidence based
best practices in Ethiopia (CASCAPE for short) has supported the study.
a depth of 200 cm (bedrock permitting) and the soil was described according to the FAO guidelines for soil description (FAO 2006a). Soil samples were taken from each of the identified genetic horizons for laboratory investigation.
Soil analytical procedures
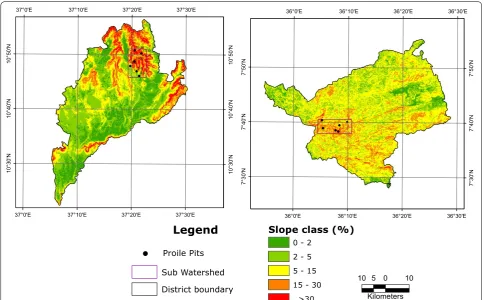
A total of 53 samples were collected from 12 profiles and taken to the soil fertility lab of the Water Works Design and Supervision Enterprise (WWDSE) in Addis Ababa, Ethiopia. The analytical methods followed the standard Fig. 3 Slope map of Jabi Tehnan district (left) and Gera district (right) showing sub-watershed and soil sampling units
Table 1 Geographic location, slope class, elevation and land use types in the profiles sites
Profile ID Latitude Longitude Slope (%) Altitude (m)
Intensive cereal-livestock system (north-central highlands)
ET_AJJIP001 10°39′33.407″N 37°19′29.398″E 2–5 2790
ET_AMAMP001 11°24′26.593″N 37°3′36.276″E 2–5 2800
ET_ASAA-P001 11°21′49.326″N 36°57′8.624″E 2–5 2446
ET_ASAA-P002 11°20′21.373″N 36°55′52.203″E 15–30 1946
ET_MTA-HBP1 9°26′23.008′’N 41°42′56.008″E 15–30 2272
ET_GIR-GGP3 8o11′36.640″N 36o56′27.632″E 15–30 2954
Agroforestry-livestock system (south-western highlands)
ET_JIMG-SLP2 7º46′36.005″N 36º24′33.012″E 2–5 1917
ET_JIMG-WKP1 7º47′05.003″N 36º22′17.011″E 2–5 1932
ET_BAK-AGP3 8º59′21.779″N 37º12′21.316″E 2–5 1665
ET_JIMLS-SP2 8º11′36.640″N 36º56′27.632″E 15–30 1953
ET_JIMG-GCP2 7º43′39.994″N 36º15′09.014″E 15–30 2025
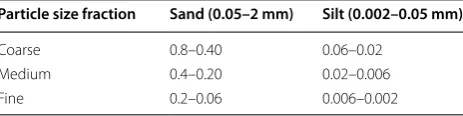
procedures as outlined in Van Reeuwijk (2006). The per-centage of sand (0.05–2.0 mm), silt (0.002–0.05 mm) and clay (<0.002 mm) fractions of the fine earth (<2 mm) was determined using the modified sedimentation hydrometer procedure (Bouyoucos 1962). Particle grain size analysis to separate coarse, medium and fine sand and silt frac-tions was carried out following the procedures outlined in USDA-NRCS (2014). Particle size limits for the coarse, medium and fine fractions are given in Table 2. This was to evaluate the effect of land use and slope on particle size fractions which in turn have impact on erosion and management practices to be implemented. Soil aggregate stability test was conducted by wet sieving method as outlined in USDA-NRCS (2014). It involves abrupt sub-mergence of air dry aggregates in water followed by wet sieving using 0.5 mm sieve. Figures reported are percent-age of aggregates retained after wet sieving. Soil moisture contents (w/w, %) were determined by means of pressure membrane extractor at different pressure forces to the crushed samples (Baruah and Barthakur 1997). The field capacity (FC) was determined at 1/3 bar and the perma-nent wilting point (PWP) at 15 bars for sieved and air dry soil samples. The plant available water content (AWC) was determined as the difference between FC (the upper limit) and PWP (the lower limit).
Soil pH was determined in water (pH—H2O) using a 1:2.5 soil to water solution ratio with a pH meter as out-lined in Van Reeuwijk (2006). Organic carbon (OC) con-tent of the soil was analyzed using the Walkley and Black method (Nelson and Sommers 1982). Total nitrogen (TN) was analyzed according to the Macro-Kjeldahl method that involves digestion of the sample and a wet-oxidation procedure (Bremner and Mulvaney 1982). Available phos-phorus (AP) content was determined using Olsen5
5 In Ethiopia, the Olsen’s NaHCO
3 method (pH 8.5) is widely used for
determining soil available P. A study on the evaluation of soil test meth-ods for available phosphorus on 32 Ethiopian soils reported that the Olsen method followed by Warren and Cooke, and Truog methods is the best of the eight chemical methods they used to assess available P (Mamo and Hague (1991). This was further confirmed by Mamo, Christian and Heilig-tag (2002) who found the magnitude of soil available P extraction in the order Truog > CAL > Olsen > Bray II > Warren and Cooke. Since Troug and CAL methods are not practiced in the analytical labs in Ethiopia, the Olsen, Cole, Watanabe and Dean (1954) remains the best method for avail-able P-extraction in Ethiopia to date.
sodium bicarbonate extraction solution at pH 8.5 (Olsen et al. 1954) and the amount of AP (mg kg−1) was deter-mined by spectrophotometer (Van Reeuwijk 2006). Exchangeable cations and CEC (cmol(+) kg−1) were determined by Ammonium Acetate method at pH 7. In the leachate, Exchangeable Ca2+ and Mg2+ were deter-mined using Atomic Absorption Spectrophotometer (AAS) and Na+ and K+ by flame photometer as outlined in Van Reeuwijk (2006). The contents of selected micro-nutrients (Fe2+, Mn2+, Zn2+ and Cu2+) was determined using the di-ethylene tri-amine-penta-acetic acid (DTPA) extraction method (Tan 1996).
Statistical analysis and data presentation
Descriptive statistics was applied and mean values for the surface horizons of all profiles investigated were com-puted by means of weighted average. The presence of sig-nificant difference in mean values between the two land use types and slope classes was tested using paired T test in SPSS (Statistical Package for Social Science) software Version 23. The results of the Paired T test analysis pre-sent the weighted mean values of all profiles investigated. Full profile information (analytical data) on physical and chemical characteristics is presented for four sample profiles representing the two land use types and slope classes.
Results and discussion
Soil physical characteristics as affected by land use type and slope class
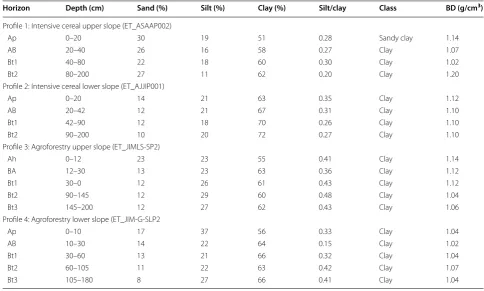
The soils are clayey with clay content ranging from 51 to 55% in the A-horizon and from 58 to 72% in the B-hori-zon (Table 3). The clay enrichment in the B-horizon is as result of clay migration. The silt/clay ratio ranges from 0.28 to 0.41 in the A-horizon and from 0.22 to 0.41 in the B-horizon that were rated as high according to the ratings of Hazelton and Murphy (2007). This suggests the presence of weatherable mineral reserve in the soil. The bulk density was within 1.04–1.14 g cm−3 range in the A-horizon and 1.02–1.12 g cm−3 in the B-horizon. These values are below the critical values for agricultural use (1.4 g cm−3) suggested by Hillel (2004) indicating the absence of excessive compaction or restrictions for root development.
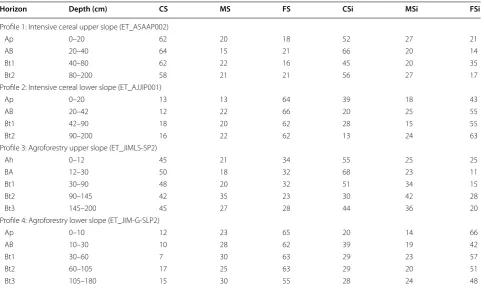
Land use and slope significantly (p < 0.05) affected particle size distribution and plant available water con-tents. The mean values of fine grained texture materi-als including 39% fine sand, 42% fine silt and 67% clay in the agroforestry system were significantly higher than 30% fine sand, 21% fine silt and 46% clay in the cereal system (Tables 4, 5). These findings suggest that although texture is an inherent property of the soil, it can be altered by land use practices over a longer period Table 2 Particle size limits for coarse, medium and fine
sand and silt fractions (USDA-NRCS 2014)
Particle size fraction Sand (0.05–2 mm) Silt (0.002–0.05 mm)
Coarse 0.8–0.40 0.06–0.02
Medium 0.4–0.20 0.02–0.006
of time (Schaetzl and Anderson 2005). Slope effect was also significant for particle size distribution. The mean values of fine sand (39%), fine silt (30%) and clay (63%) in the lower slope were significantly (p < 0.05) higher than mean values in the upper slope—17% fine sand, 14% fine silt and 51% clay in the upper slope (Table 6). The find-ings suggest residual accumulation of coarser particles and removal of finer particles from in the upper slopes by runoff water and its deposition in the lower slopes. The result is in agreement with the findings of Gebrese-lassie et al. (2015) and Gebrekidan and Negassa (2006) that reported increasing trends of coarse fractions with increasing slope and increasing clay fractions with decreasing slope gradients.
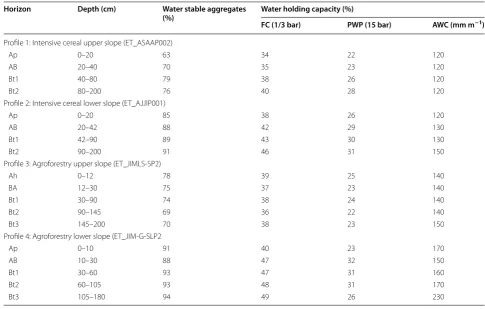
Soil structural aggregate stability has a key role in the functioning of soil such as water retention, aera-tion, infiltration and therefore resistance to erosion (Abrishamkesh et al. 2010; USDA-NRCS 2014). The man values of water stable aggregate (WSA), the proportion of structural aggregates retained after wet sieving in 0.5 mm sieve, were 79 and 87% for the intensive cereal and agroforestry systems, respectively (Table 5). Accord-ing to the ratAccord-ings of Hazelton and Murphy (2007), the WSA was rated as very high and were not significantly
different between land use types (Table 7). This indicates that Nitisols have little water dispersible aggregates and hence they are fairly resistant to erosion. This is part of the reason why the Nitisols remained deep and pro-ductive in spite of centuries of intensive cultivation and severe erosion hazards in the Ethiopian highlands (Elias 2016).
The water content of the soil at FC (1/3 bar) and PWP (15 bar) were 35 and 23% in the cereal system and 37 and 24% in the agroforestry system (Table 5). According to the rating of Hazelton and Murphy (2007), the water content at FC and PWP were rated as high while AWC was in the medium to high range. The generally favour-able water holding capacity of the soil can be attributed to high clay content, well-developed soil structural aggre-gates and reasonably good organic matter contents of the soils. The result is in agreement with another report from Welega, western Ethiopia that found higher water hold-ing capacity for soils with higher clay content (Chimdi et al. 2012). On the other hand, the mean AWC in the agroforestry system (135 mm/m) was significantly higher than that in the cereal system (112 mm/m) suggesting differences in particle grain size distribution and organic matter content.
Table 3 Particle size distribution, textural class and bulk density of Nitisol sample profiles
BD bulk density
Horizon Depth (cm) Sand (%) Silt (%) Clay (%) Silt/clay Class BD (g/cm3)
Profile 1: Intensive cereal upper slope (ET_ASAAP002)
Ap 0–20 30 19 51 0.28 Sandy clay 1.14
AB 20–40 26 16 58 0.27 Clay 1.07
Bt1 40–80 22 18 60 0.30 Clay 1.02
Bt2 80–200 27 11 62 0.20 Clay 1.20
Profile 2: Intensive cereal lower slope (ET_AJJIP001)
Ap 0–20 14 21 63 0.35 Clay 1.12
AB 20–42 12 21 67 0.31 Clay 1.10
Bt1 42–90 12 18 70 0.26 Clay 1.10
Bt2 90–200 10 20 72 0.27 Clay 1.10
Profile 3: Agroforestry upper slope (ET_JIMLS-SP2)
Ah 0–12 23 23 55 0.41 Clay 1.14
BA 12–30 13 23 63 0.36 Clay 1.12
Bt1 30–0 12 26 61 0.43 Clay 1.12
Bt2 90–145 12 29 60 0.48 Clay 1.04
Bt3 145–200 12 27 62 0.43 Clay 1.06
Profile 4: Agroforestry lower slope (ET_JIM-G-SLP2
Ap 0–10 17 37 56 0.33 Clay 1.04
AB 10–30 14 22 64 0.15 Clay 1.02
Bt1 30–60 13 21 66 0.32 Clay 1.04
Bt2 60–105 11 22 63 0.42 Clay 1.07
Soil chemical characteristics as affected by land use and slope
Tables 8 and 9 summarize important chemical character-istics of the sample profiles of Nitisols while mean values as affected by land use type and slope class are presented in Tables 10 and 11. The mean pH values were 5.29 and 6.12 for the cereal and agroforestry systems (Table 8) which are statistically significantly (p < 0.05) different. Based on the ratings of Hazelton and Murphy (2007), the soil pH is rated as strongly acidic and moderately acidic respectively. The strongly acidic soil reaction in the cereal system was attributed to intense leaching of bases and continued application of DAP and urea fertilizers. The base saturation 62 and 77% for the cereal and agrofor-estry systems that are significantly (p < 0.05) different (Table 10). The implication is that there is more intense leaching of basic cations in the cereal system resulting in higher exchangeable acidity. In addition, the rate of fer-tilizer application in the cereal system (100 kg urea and 150 kg DAP ha−1) was double the rate applied in the agroforestry system (i.e., 50 kg DAP and 75 kg urea ha−1). Previous research findings suggest that continuous appli-cation ammonia fertilizers such as DAP and urea can contribute to increased exchangeable acidity of the soil (Smaling and Braun 1996; Elias et al. 1998; Elias 2016).
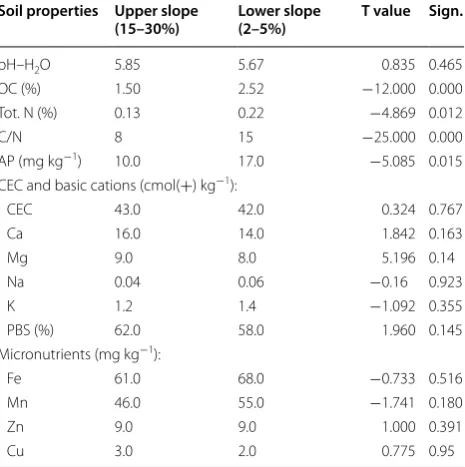
The mean OC content was 2.0 and 2.1% for the inten-sive cereal and agroforestry systems (Table 10). Based on the ratings of Landon (1991), the OC of the soil was rated very low showing no significant difference between the land use types. On the other hand, slope effect was significant (p < 0.05) with higher mean val-ues (2.5% OC) in the lower slope compared to 1.5% in the upper slope (Table 11). This is attributed to the movement of humus particles down slope with runoff water. The finding is in agreement with Gebreselassie et al. (2015) that reported increasing OC contents with decreasing slope.
The mean TN values, 0.15 and 0.22% for the inten-sive cereal and agroforestry systems, were rated low based on the ratings of Landon (1991) and significantly (p < 0.05) different between the two land use types. Higher TN content in the agroforestry system was due to crop residues addition and leaf litter accumulation from land use practices that added to N-mineraliza-tion. This is further elaborated by significantly lower C/N ratios with mean value of 10 in the agroforestry system compared to 18 in the intensive cereal system (Table 10). Although rate of decomposition was not measured in this study, the significantly higher C/N ratios are indicative of somewhat depressed microbial Table 4 Grain size fractionation of sand (>0.05 mm) and silt (0.05–0.002 mm) particles (%)
CS coarse sand, MS medium sand, FS fine sand; CSi coarse silt, MS medium silt, FSi fine silt
Horizon Depth (cm) CS MS FS CSi MSi FSi
Profile 1: Intensive cereal upper slope (ET_ASAAP002)
Ap 0–20 62 20 18 52 27 21
AB 20–40 64 15 21 66 20 14
Bt1 40–80 62 22 16 45 20 35
Bt2 80–200 58 21 21 56 27 17
Profile 2: Intensive cereal lower slope (ET_AJJIP001)
Ap 0–20 13 13 64 39 18 43
AB 20–42 12 22 66 20 25 55
Bt1 42–90 18 20 62 28 15 55
Bt2 90–200 16 22 62 13 24 63
Profile 3: Agroforestry upper slope (ET_JIMLS-SP2)
Ah 0–12 45 21 34 55 25 25
BA 12–30 50 18 32 68 23 11
Bt1 30–90 48 20 32 51 34 15
Bt2 90–145 42 35 23 30 42 28
Bt3 145–200 45 27 28 44 36 20
Profile 4: Agroforestry lower slope (ET_JIM-G-SLP2)
Ap 0–10 12 23 65 20 14 66
AB 10–30 10 28 62 39 19 42
Bt1 30–60 7 30 63 29 23 57
Bt2 60–105 17 25 63 29 20 51
decomposition of organic matter and N-mineraliza-tion in the cereal system. Further, the land use system might be adversely affecting soil microorganisms which
remains subject for future research. Slope effect of TN was also significant (p < 0.05) with higher mean values in the lower slope (0.22%) compared to 0.13% in the Table 5 Structural aggregate stability and water holding capacity of Nitisol sample profiles
Horizon Depth (cm) Water stable aggregates
(%) Water holding capacity (%)
FC (1/3 bar) PWP (15 bar) AWC (mm m−1)
Profile 1: Intensive cereal upper slope (ET_ASAAP002)
Ap 0–20 63 34 22 120
AB 20–40 70 35 23 120
Bt1 40–80 79 38 26 120
Bt2 80–200 76 40 28 120
Profile 2: Intensive cereal lower slope (ET_AJJIP001)
Ap 0–20 85 38 26 120
AB 20–42 88 42 29 130
Bt1 42–90 89 43 30 130
Bt2 90–200 91 46 31 150
Profile 3: Agroforestry upper slope (ET_JIMLS-SP2)
Ah 0–12 78 39 25 140
BA 12–30 75 37 23 140
Bt1 30–90 74 38 24 140
Bt2 90–145 69 36 22 140
Bt3 145–200 70 38 23 150
Profile 4: Agroforestry lower slope (ET_JIM-G-SLP2
Ap 0–10 91 40 23 170
AB 10–30 88 47 32 150
Bt1 30–60 93 47 31 160
Bt2 60–105 93 48 31 170
Bt3 105–180 94 49 26 230
Table 6 Mean values of physical and chemical characteristics of Nitisol (0–20 cm) as affected by slope class
Soil properties Upper slope (15–30%) Lower slope (2–5%) T value Sign.
Sand (%) 27 12 4.829 0.017
Silt (%) 22 25 −0.441 0.689
Clay (%) 51 63 −1.604 0.027
Bulk density (g cm−3) 1.2 1.1 1.787 0.172
Particle size fractions (%)
Coarse sand 49 15 3.141 0.042
Medium sand 34 33 0.097 0.929
Fine sand 17 52 −4.447 0.041
Coarse silt 54 41 1.065 0.365
Medium silt 32 21 1.392 0.258
Fine silt 14 38 −2.637 0.078
Water stable aggregates 80 82 −0.935 0.419
Water holding capacity w/w, %)
FC (1/3 bar) 35 37 −1.095 0.353
PWP (33 bar) 23 24 −0.662 0.555
upper slope (Table 11). Similar results are reported by Gebreselassie et al. (2015) who found increasing TN levels with decreasing slope.
The mean AP content, 10 and 8 mg kg−1 for the cereal and agroforestry systems, were rated as low based on the ratings of Hazelton and Murphy (2007). Although Table 7 Mean values of physical and chemical characteristics of Nitisols (0–20 cm) as affected by land use
Soil property Intensive cereal system Agroforestry based system T value Sign.
Sand (%) 28 15 3.677 0.032
Silt (%) 26 18 −2.320 0.103
Clay (%) 46 67 −5.536 0.012
Bulk density (g cm−3) 1.2 1.1 1.163 0.329
Particle size fractions (%)
Coarse sand 43 19 6.453 0.008
Medium sand 41 16 4.494 0.021
Fine sand 30 39 −3.307 0.045
Coarse silt 59 30 7.769 0.004
Medium silt 38 17 3.859 0.031
Fine silt 21 42 −3.23 0.045
Water stable aggregates 79 87 −3.068 0.055
Water holding capacity w/w, %):
FC (1/3 bar) 35 37 −1.424 0.250
PWP (33 bar) 23 24 −0.132 0.903
AWC (mm/m) 112 135 −9.000 0.003
Table 8 Selected chemical characteristics of Nitisol profiles by land use type and slope
TEB total exchangeable bases, PBS percent base saturation
Horizon Depth (cm) PH H2O OC (%) TN (%) C/N CEC and exchangeable bases (cmol(+) kg−1)
CEC Ca Mg Na K TEB PBS
Profile 1: Intensive cereal upper slope (ET_ASAA-P002)
Ap 0–20 4.8 2.1 0.16 13 44 15 4 0.1 1.4 20 43
AB 20–40 5.1 1.7 0.10 17 32 14 3 0.1 1.2 18 53
Bt1 40–80 5.5 1.0 0.05 20 30 13 2 0.1 1.3 16 50
Bt2 80–200 5.7 1.0 0.06 17 30 14 4 0.2 1.2 19 60
Profile 2: Intensive cereal lower slope (ET_AJJI-P001)
Ap 0–20 4.7 3.6 0.20 18 42 15 7 0.4 1.2 22 52
AB 20–42 4.9 2.0 0.12 17 49 20 7 0.4 1.1 27 55
Bt1 42–90 4.5 1.1 0.06 18 48 20 6 0.5 1.4 26 54
Bt2 90–200 4.9 1.1 0.07 15 45 17 5 0.4 1.3 22 49
Profile 3: Agroforestry upper slope (ET_JIMLS-SP2)
Ah 0–12 6.2 2.5 0.25 10 37 13 14 0.2 2.2 29 78
BA 12–30 5.5 1.3 0.12 11 41 18 10 0.6 2.0 29 70
Bt1 30–90 5.5 0.9 0.09 10 35 14 10 0.9 2.0 25 71
Bt2 90–145 5.3 0.6 0.06 10 32 14 8 0.2 2.1 23 72
Bt3 145–200 5.8 0.4 0.04 10 30 12 11 0.2 2.0 18 77
Profile 4: Agroforestry lower slope (ET_JIM-G-SLP2)
Ap 0–10 5.5 3.6 0.33 11 30 11 8 0.2 3.0 21 70
AB 10–30 5.9 1.9 0.13 14 28 13 8 0.1 2.0 22 79
Bt1 30–60 5.6 1.5 0.13 12 27 12 9 0.1 2.2 22 81
Bt2 60–105 5.6 1.1 0.10 11 30 12 10 0.1 2.4 23 77
some profiles in the cereal system had high AP contents (Table 9), the mean values were not significantly differ-ent between the two land use types. The low levels of AP in spite of relatively higher doses DAP application (i.e., 150 kg ha−1) in the cereal system suggests the unavailabil-ity of the applied phosphate in the soil solution. This was attributed to increased exchangeable acidity and higher P-sorption capacity of the strongly acidic soils under the cereal system. Literature indicates the applied phosphate is fixed by iron and aluminum compounds (i.e., sesquioxides) and hence, rendered unavailable in the soil solution in low pH soils (Schaetzl and Anderson 2005; Hillel 2004). On the other hand, AP contents were significantly (p < 0.05) differ-ent between the two slope classes with higher mean values (17 mg kg−1) in the lower slope compared to 10 mg kg−1 in the upper. The conventional practice of farmers is to apply DAP at planting (i.e., basal application) when the monsoon rains are at their peak that results in the runoff removal of some of the applied fertilizer from the upper slopes that are deposited in the lower slopes.
On the other hand, the CEC, exchangeable bases (Ca2+, Mg2+, K+) and PBS of the soil were rated high based on the Table 9 Available phosphorus and micronutrient contents (mg kg−1) of the surface horizons in the Nitisol profiles
Profile ID Land use Slope AP Fe Mn Zn Cu
ET_ASAA-P002 Cereal 15–30 8 29 63 3 2
ET_AJJI-P001 Cereal 2–5 16 32 69 2 2
ET_JIMLS-SP2 Agroforestry 15–30 9 66 94 13 3
ET_JIM-G-SLP2 Agroforestry 2–5 8 60 98 10 2
Table 10 Mean values of selected chemical characteristics of Nitisols (0–20 cm) as affected by land use
Soil property Intensive cereal system Agroforestry based system T value Sign
pH–H2O 5.29 6.12 −6.935 0.006
OC (%) 2.00 2.12 −0.620 0.579
Tot. N (%) 0.15 0.22 −4.217 0.024
C/N 18 10 2.600 0.080
AP (mg kg−1) 10.0 8 0.504 0.649
CEC and basic cations (cmol(+) kg−1):
CEC 40 44 1.800 0.170
Ca 14 16 −1.507 0.229
Mg 6 15 −10.832 0.002
Na 0.02 0.14 0.522 0.638
K 1.60 3.0 −3.705 0.024
PBS (%) 51 75 −6.937 0.006
Micronutrients (mg kg−1):
Fe 37 97 −8.895 0.003
Mn 39 68 −9.731 0.002
Zn 3 13 −8.278 0.004
Cu 2 3 −1.732 0.182
Table 11 Mean values of selected chemical characteristics of Nitisols (0–20 cm) as affected by slope
Soil properties Upper slope
(15–30%) Lower slope (2–5%) T value Sign.
pH–H2O 5.85 5.67 0.835 0.465
OC (%) 1.50 2.52 −12.000 0.000
Tot. N (%) 0.13 0.22 −4.869 0.012
C/N 8 15 −25.000 0.000
AP (mg kg−1) 10.0 17.0 −5.085 0.015
CEC and basic cations (cmol(+) kg−1):
CEC 43.0 42.0 0.324 0.767
Ca 16.0 14.0 1.842 0.163
Mg 9.0 8.0 5.196 0.14
Na 0.04 0.06 −0.16 0.923
K 1.2 1.4 −1.092 0.355
PBS (%) 62.0 58.0 1.960 0.145
Micronutrients (mg kg−1):
Fe 61.0 68.0 −0.733 0.516
Mn 46.0 55.0 −1.741 0.180
Zn 9.0 9.0 1.000 0.391
ratings of Landon (1991) while Na+ appeared only in trace amount. The paired T-test showed no significant difference between land use type and slope classes except for Mg2+, K+ and PBS. Mean values of Mg2+ (15 cmol(+) kg−1), K+ (3 cmol(+) kg−1) and PBS (75%) in the agroforestry system were significantly higher than those in the cereal system (6 and 1.6 cmol(+) kg−1 of Mg2+ and K+ and 51% PBS). The PBS was in the medium to high range (43–60%) in the cereal system while it was high to very high (70–81%) in the agro-forestry system (Table 8). The generally high base saturation of the soil was consistent with high contents of exchange-able bases (chiefly Ca2+ and Mg2+) but not consistent with generally acidic soil reaction (pH 5.5–6.2) that needs some explanation. First, the soils in the Ethiopian highlands have developed on recent Trapean lava flows that have high base status (Mohr 1971). Secondly, according to Buol et al. (2011) the volcanic parent materials such as rhyolites, granite, tra-chytes, ignimbrites, andesites and some acidic basalts that dominate the Ethiopian produce inherently acidic clays. Thirdly, the humid climatic conditions might have resulted in increased microbial oxidation to produced organic acids, which provide H+ to the soil that can also contribute towards low soil pH (Schaetzl and Anderson 2005).
The mean values for Fe2+, Mn2+, Zn2+ and Cu2+ were respectively 37, 39, 3 and 2 mg kg−1 in the cereal system while it was 97, 68, 13 and 3 mg kg−1 in the agroforestry system (Table 9). According to the ratings of Havlin et al. (1999), the micronutrient contents were rated as high to very high except for Zn+ that was low to medium. The high levels of micronutrients is consistent with the low pH of the soil and the low Zn2+ contents are in agreement with previous report that indicated widespread Zn deficiency in the Nitisol areas of the Ethiopian highlands (Dibabe et al. 2007). According to FAO (2006b), low soil pH induces increase in micronutrient contents that may eventually lead to root toxicity unless soil pH is corrected through liming. The paired T-test showed significant (p < 0.05) dif-ference between land use types for Fe2+, Mn2+, and Zn2+ but slope effect was nonsignificant. The mean value of Fe2+ (97 mg kg−1), Mn2+ (68 mg kg−1) and Zn2+ (13 mg kg−1) in the agroforestry system were significantly higher than 37, 39 and 3 mg kg−1 of Fe2+, Mn2+, and Zn2+ in the cereal system (Table 10). According to Mohr (1971) and David-son (1983), the soil parent materials in the agroforestry system are dominated by basic rocks such as alkali-olivine basalts, amphibole and mica that are rich in ferromanga-nese minerals thus explaining the exceptionally high Fe2+ and Mn2+ contents in these sites.
Conclusion
The study showed that land use practices and slope class significantly affects important soil physical and chemical characteristics. These include particle size distribution,
plant available water contents (AWC), soil pH and OC, TN, AP exchangeable basses and some micronutrients. The land use practices in the intensive cereal system was found to be adversely affecting important soil physical and chemical characteristics as compared to the agro-forestry system. These include alteration of particle size distribution, strongly acidic soil reaction, organic matter depletion, multiple nutrient deficiencies (N, P, K and Zn) and low plant available water content. Among the inap-propriate land use practices include repeated cultivation to create fine seedbed that predisposes the soil to ero-sion, unbalanced fertilizer application, rotation of maize with potato that are depleting some nutrient stocks (e., K and Zn), and removal of crop residues from fields. As can be seen from the significantly lower PBS in the cereal sys-tem, leaching of basic cations was intense that resulted in increased levels of exchangeable acidity. In addition, con-tinued use of DAP and urea seems to have contributed to increased exchangeable acidity as well as accentuating the uptake and deficiency of other nutrients such as K and Zn that are not supplied in the fertilizer application. Slope position of the profiles also had significant effect on soil characteristics with significantly higher propor-tions of coarse textured particles that were low in OC, AP and TN contents in the upper slope compared to lower slopes. Organic matter and nutrient contents decreased with increasing slope gradient particularly in the cereal system indicating the effect of erosional losses of fine particles.
biological and agronomic measures mainly in the cereal system. In addition, soil textural fractionation analysis indicates that repeated tillage practice is found to pre-dispose the soil to erosion by adversely affecting the soil textural fractions. Therefore, minimum tillage combined with legume rotation (maize-tef-bean) observed in some parts of west Gojam (e.g., South Achefer and Bure) need to be widely disseminated among farmers in the cereal-livestock highlands.
Abbreviations
AP: available phosphorus (mg kg−1); AWC: available water content; BD: bulk density (dgcm3); C/N: carbon to nitrogen ratio; Ca/Mg: calcium to magnesium ratio; CEC: cation exchange capacity (cmol(+) kg−1); Cu: copper (mg kg−1); DAP: di-ammonium phosphate (18% N, 46% P2O5); FC: field capacity; ITCZ: Inter Tropical Convergence Zone; K: Potassium (cmol(+) kg−1); Mg: Magne-sium (cmol(+) kg−1); Mn: Manganese (mg kg−1); Na: Sodium (cmol(+) kg−1); PBS: percent base saturation; SC: sandy clay; TN: total nitrogen (%); PWP: permanent wilting point; WSA: water stable aggregates; Zn: zinc (mg kg−1).
Author’s information
The author is a Ph.D. working in the area of Soil Science and environment having 20 years of post-Ph.D. research, teaching and development work. Currently, he holds associate Professor’s position with College of Natural and Computational Science of Addis Ababa University. Over the past years, he has been working on soil survey, characterization and mapping work with scientists from the Wageningen University and Research Centre and the International Soil Reference and Information Centre (ISRIC), the Netherlands. Some of his work has recently been published in a book entitled, “Soils of the Ethiopian Highlands: Geomorphology and Properties”—ISBN: 978-99944-952-6-9. In addition, the author published a number of peer reviewed journal articles and book chapters previously.
Acknowledgements
The author acknowledges the technical support of CASCAPE field staff in the study sites. These technical assistance do not qualify for co-authorship since data accrual, analysis, interpretation and write was done solely by the author.
Competing interests
The authors declares that there is no financial or non-financial competing interests.
Availability of data and materials
I declare that the data and materials presented in this manuscript can be made publically available by Springer Open as per the editorial policy.
Consent for publication
The manuscript does not contain no data or information from any person or individual apart from his own field investigation. All data and information are generated and synthesized by the author himself.
Ethics approval and consent to participate
Not applicable to this manuscript submission.
Funding
This research was conducted as part of the action research and capacity building project entitled, “Capacity building for Scaling up of Evidence based best Practices for increased Agricultural Production in Ethiopia (CASCAPE)” with kind financial assistance from the Ministry of Foreign Affairs of the Dutch Government through its Embassy in Addis Ababa.
Publisher’s Note
Springer Nature remains neutral with regard to jurisdictional claims in pub-lished maps and institutional affiliations.
Received: 13 January 2017 Accepted: 8 August 2017
References
Abrishamkesh S, Gorji M, Asadi H (2010) Long-term effects of land use on soil aggregate stability. Int Agrophys 25:103–108
Assen M, Amd Tegene B (2008) Characteristics and classification of the soils of the plateau of Siemen Mountains National Park. SINET Ethiopia J Sci 31(2):89–102
Baruah TC, Barthakur HP (1997) A textbook of soils analysis. Vikas Publishing House, New Delhi
Bouyoucos GJ (1962) Hydrometer method improvement for making particle size analysis of soils. Agronomy 5:179–186
Bremner JM, Mulvaney CS (1982) Total nitrogen. In: Page AL, Miller RH, Keeney DR (ed) Methods of soil analysis II. Chemical and microbiological proper-ties. American Society of Agronomy, Soil Science Society of America Buol SW, Southard RJ, Graham RC, McDaniel PA (2011). Soil genesis and
clas-sification, 6th edn. Wiley-Blackwell, London
Chimdi A, Gebrekidan H, Kibret K, Tadesse A (2012) Status of selected physico-chemical properties of soils under different land use systems of Western Oromia, Ethiopia. J Biodivers Environ Sci 2(3):57–71
Davidson A (1983) The Omo river project: reconnaissance geology and geo-chemistry of parts of Ilubabor, Kafa, Gamo Gofa, and Sidamo. Ethiop Instit Geol Surv 2:1–89
Dibabe A, Bekele T, Assen Y (2007) The status of micronutrients in Nitisols, Vertisols, Cambisols and Fluvsisols in major maize, wheat, tef and citrus growing areas of Ethiopia. Ethiopian Agricultural Research Organization (EARO) Research Report, Addis Ababa
Elias E (2002) Farmers perceptions of soil fertility change and management. In: SOS-Sahel and institute for sustainable development, Addis Ababa Elias E (2016) Soils of the Ethiopian highlands: geomorphology and properties.
ALTERA Wageningen University Research Centre, The Netherlands. ISBN: 978-99944-952-6-9
Elias E, Morse S, Belshaw DG (1998) Nitrogen and phosphorus balances of Kindo Koisha farms in southern Ethiopia. Agric Ecosyst Environ 71(1):93–113 Eswaren H (1988) Taxonomy and management related properties of the red
soils of Africa. In: Nyamapfene K, Hussein J, Asumadu K (eds) The red soils of eastern and southern Africa. Proceedings of an international sympo-sium, Harare, pp 1–23
FAO (1984) Geomorphology and soils of Ethiopia. In: Assistance to land use planning and provisional soil association map of Ethiopia. Field document AG DP/ETH/78/003. Food and Agriculture Organization of the UN, Rome FAO (1986) The Ethiopian highlands reclamation study (EHRS). vol 1, In: Main
Report. Food and Agriculture Organization of the UN, Rome
FAO (2001) Lecture notes on the major soils of the world. In: ISRIC-ITC-Catholic University of Leuven World soil resources Report No 94. Food and Agri-culture Organization, Rome
FAO (2006a) Guideline for soil description. 4th edn, Food and Agriculture Organization of the UN, Rome
FAO (2006b) Plant nutrition for food security: a guide for integrated nutrient management. In: FAO fertilizer and plant nutrition, vol 16. Food and Agriculture Organization of the UN, Rome
Gebrekidan H, Negassa W (2006) Impact of land use and management prac-tices on chemical properties some soils of Bako area, western Ethiopia. Ethiop J Nat Res 8(2):177–197
Gebreselassie Y, Anemut F, Addis S (2015) The effects of land use types, man-agement practices and slope classes on selected soil physico-chemical properties in Zikre watershed, North-Western Ethiopia. Environ Syst Res 4(3):1–7. doi:10.1186/s40068-015-0027-0
Haileslassie A, Priess J, Veldkamp E, Teketay D, Lesschen JP (2005) Assessment of soil nutrient depletion and its spatial variability on smallholders’ mixed farming systems in Ethiopia using partial versus full nutrient balances. Agric Ecosyst Environ 108:1–16
Havlin JL, Beaton JD, Tisdale SL, Nelson WL (1999) Soil fertility and fertilizers. Prentice Hall, New Jersey
Hazelton P and Murphy B (2007) Interpreting soil test results: what do all those numbers mean? CSIRO. Department of Natural Resources
Hillel D (2004) Introduction to environmental soil physics. Elsevier Academic Press, Amsterdam
IFPRI (2010) Fertilizer and soil fertility potentials in Ethiopia. In: Constraints and opportunities to enhance the system. International Food Policy Research Institute, Washington
Karltun E, Mamo T, Bekele T, Gameda S, an Kidanu S (2013) Towards improved fertilizer recommendations in Ethiopia—Nutrient indices for categoriza-tion of fertilizer blends from Ethiopia Soil Informacategoriza-tion System (Ethio-SIS) woreda soil inventory data. In: A discussion paper. The Ethiopian Agricultural Transformation Agency (ATA) and the Ministry of Agriculture, Addis Ababa
Laekemariam F, Kibret K, Mamo T, Karltun E, Gebrekidan H (2016) Physi-ographic characteristics of agricultural lands and farmers’ soil fertility management practices in Wolaita zone, Southern Ethiopia. Environ Syst Res 5(24):1–15. doi:10.1186/s40068-016-0076-z
Landon JR (1991) Booker tropical soil manual: a hand book for soil survey agricultural land evaluation in the tropics and sub-tropics. In: Longman Scientific and Technical, Routledge
Mamo T, Hague I (1991) Phosphorus status of some Ethiopian soils. III, Evalua-tion of soil test methods for available phosphorus. Trop Agric 68:51–56 Mamo T, Christian R, Heiligtag Burkhard (2002) Phosphorus availability studies
on ten Ethiopian Vertisols. J Agric Rural Dev Trop Subtrop 103(2):177–183
Mohr AP (1971) The geology of Ethiopia. Haile Selassie I University Press, Addis Ababa
Nelson DW and Sommers LE (1982) Total carbon, organic carbon and organic matter. In: Page AL (ed) Methods of soil analysis, Part 2: chemical and microbiological properties. Agronomy, Madison, pp 539–579 Olsen SR, Cole CV, Watanabe FS, Dean LA (1954) Estimation of available
phos-phorus in soils by the extraction with sodium bicarbonate. US Depart-ment of Agriculture, Washington
Schaetzl RJ, Anderson S (2005) Soils: genesis and geomorphology. Cambridge University Press, Cambridge
Smaling EM, Braun AR (1996) Soil fertility research in Sub-Saharan Africa”: new dimensions, new challenges. Commun Soil Sci Plant Anal. 27(3–4):365–386
Stocking M (1988) Tropical red soils of Africa: Fertility management and deg-radation. In: Nyamapfene K, Hussein J, Asumadu K (eds) The red soils of eastern and southern Africa. Proceedings of an international symposium, Harare
Tan KH (1996) Soil sampling, preparation, and analysis. Marcel Dekker, New York
USDA-NRCS (2014) Soil survey field and laboratory methods manual. In: Soil Survey Investigations Report No. 51 Version 2. United State Department of Agriculture and Natural Resources Conservation Service, Lincoln Van Reeuwijk LP (2006) Procedures for soil analysis, 6th edn. International soil
reference and information centre (ISRIC), Wageningen, The Netherlands Zewdie E (2013) Properties of major agricultural soils of Ethiopia. Lambert