RESEARCH
Effects of socio-economic status
and seasonal variation on municipal solid
waste composition: a baseline study for future
planning and development
Ali Kamran
1*, Muhammad Nawaz Chaudhry
1and Syeda Adila Batool
2Abstract
Background: The present study has highlighted the effects of seasonal variation and socio-economic status on gen-eration and composition of municipal solid waste (MSW) in Shalimar Town (ST). The total amount of MSW generated in ST is estimated to be 927 tons per day per year. The average per capita rate of MSW collected in ST is 0.69 kg per day in all four seasons.
Results: No significant difference was found in overall waste generation; however, statistical analyses show the sig-nificant difference for food waste, paper and plastic (p < 0.01) among socio-economic groups and seasons. The results show that the lowest income group produces 0.39 kg per capita per day during winter months which is the minimum of MSW generated as compared to high (1.1 kg per capita per day) and middle (0.56 kg per capita per day) income groups in the same season.
Conclusions: It is also concluded that the low-income group produces the minimum of waste in each of the four seasons. In terms of breakdown of the MSW, organic waste is in the highest percentage (81%) followed by paper (5%), plastic (6%), glass (2%) and others (5%). Food waste is 84% of the entire generated MSW as well as having very low heating value of 5,642 J per g. Elemental and proximate analyses of mixed food waste had carbon 48.72%, nitrogen 2.41%, hydrogen 6.37%, sulphur 0.29 and oxygen 40.15% respectively.
© 2015 Kamran et al. This article is distributed under the terms of the Creative Commons Attribution 4.0 International License (http://creativecommons.org/licenses/by/4.0/), which permits unrestricted use, distribution, and reproduction in any medium, provided you give appropriate credit to the original author(s) and the source, provide a link to the Creative Commons license, and indicate if changes were made.
Background
Waste management is a complex issue, which has to assess and aptly take into account the environmental impacts, technical aspects, implementation and operational costs of each specific treatment and disposal option [1–3]. The municipal solid waste (MSW) generation has radically increased with the increase in economic growth, popu-lation as well as with the upsurge in living standards in semi-developing countries. The generated municipal solid waste is not managed appropriately in most of the under-developed countries and causes stern issues with respect to collection, storage, and ultimate disposal of waste [4–6].
Public health and environmental risks are often caused by incongruous solid waste operations, storage, collection, and transportation and disposal practices [7].
For an apposite management of urban solid waste, knowledge of solid waste composition is exceptionally important [8, 9]. There are numerous ways to deal with the solid waste generated by human activities in cos-mopolitan areas of the developing countries all over the world. MSW production is strongly influenced by geo-graphical conditions [10], rapid urbanization and pattern of consumption [11]. Those responsible for the design and operation of MSW management systems must know the sources and composition of MSW generated and to set out goals for the collection in their borough. Informa-tion on the composiInforma-tion of MSW helps to define equip-ment needs, collection methodologies, manageequip-ment programs and plans. The waste management process can
Open Access
*Correspondence: [email protected]
1 College of Earth and Environmental Sciences, University of the Punjab,
Lahore, Pakistan
help conserve resources and safeguard the environment [12]. The waste generation and management issues cause amassed effects on socio-economics, public health and aesthetics of many societies around the world [13–15].
Improper storage of waste as well as open dumping of waste in streets and on open plots is a grave concern [16,
17]. Unscientific and inapt management of MSW can cause different types of environmental pollution affecting public health, with MSW providing harborage for various forms of disease-carrying vectors such as flies, mosquitoes and rats [18]. Many have stated that increasing generation of MSW is causing environmental problems in urban areas of devel-oping countries [10, 19]. The most common methods used for the disposal of MSW include open dumping, sanitary landfilling, composting and incineration [20]. City officials often devote derisory time or resources to the management of MSW in developing countries like Pakistan [5].
Description of study area
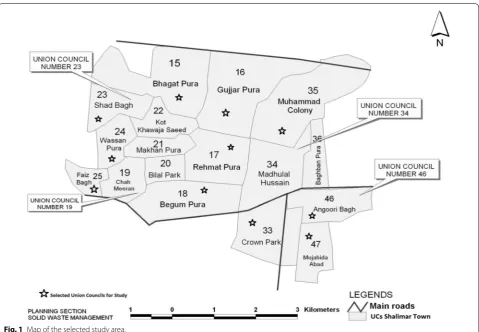
Lahore is the second largest city of Pakistan in terms of both population and land area. The city of Lahore [lati-tude 31°510′N, longitude 74°0.40′E, 711 feet (217 m) above sea level] experiences four distinct seasons, namely monsoon or rainy/wet season (July, August and Septem-ber), winter (November, December and January), spring (February, March and April) and summer (May, June and October). Lahore is divided into nine administrative towns. ST is one of the administrative towns and it has a total population of 1,344,000. ST is further divided into 17 union councils. Table 1 shows the self-classified monthly income and average number of family members in ST.
Waste composition was measured during each of the following seasons:
• wet (July, August and September)
• winter (November, December and January)
• spring (February, March and April); and
• summer (May, June and October)
Description of MSW collection system in ST Lahore
More than half of the waste generated in ST is collected by the Lahore Municipal Waste Corporation (LMWC) of
the City District Government Lahore (CDGL). LMWC is responsible for the collection of MSW from most parts of the city. LMWC is funded by the Government of the Punjab. Another important data is the composition of the MSW that is generated by the residents of three socio-eco-nomic levels in ST. In Lahore, a communal container col-lection system is mainly in practice. The total number of steel waste storage containers in ST is 62 out of which 40 are 5 m3 in size and 22 are of 10 m3 in size. These containers
are placed at different locations of the town without con-sidering their effectiveness and suitability. MSW from these containers is transported to the dump site which is located almost 10 km by road from the town center. The transpor-tation of MSW is on a daily basis from containers placed in high-income areas and is on alternate days in low and mid-dle income areas. A total number of 57 vehicles are used for the collection of MSW in ST. Most of these vehicles are not properly maintained and some of them often remain out of order. The diurnal collection operation of MSW is hampered due to worn out vehicles. Out of these 57, only 5 are fully contained compactor vehicles to control supple-mentary pollution during transportation and to improve efficiency of waste collection operations. MSW, generated in low and middle income areas, rarely, contains high-value recyclables as these are separated at source.
In Lahore, there are three dump sites. These dump sites are located in the out skirts of Lahore. The biggest among three is known as Mehmood Booti Dump Site (located in Mehmood Booti area near the River Ravi). It is situ-ated within the flood plain between the channel belt and the first terrace of the River Ravi. The landfilling in and around Lahore is not an environmentally adequate option due to the geological factors and the price of land.
Objective
The objective of this study is to characterize and to quan-tify the MSW generated from three different income groups of ST, Lahore, during four different seasons of the year and among three different socio-economic levels (income groups). For planning a sustainable integrated municipal solid waste management (IMSWM), quality and quantity of MSW should be known. The study shall be helpful in minimizing the human health risks associ-ated with waste management.
Methods
Before carrying out the actual sampling, numerous physi-cal surveys of the area were carried out to fully understand the collection system of MSW in ST. During the surveys, it was also observed that scavenging is very active between 7:00 am to 9:00 am. Therefore, the sample collection was carried out early in the morning starting at 6:00 am. Table 1 Self-classified monthly income and average
num-ber of family memnum-bers in ST Income
groups Average monthly income (Euro equivalent) Average number of family members per house
Sample collection procedures
Sample collection was started from wet season in the month of July using ASTM Method D5231-92. On the basis of physical surveys, 11 union councils (UCs) were selected as population of these UCs comprised of all three socio-eco-nomic levels. Since the population of low-income groups is greater than both the high and middle income groups, therefore, for better statistical results of MSW composi-tion, four steel containers were randomly selected from low-income areas and three steel containers each were selected from high and middle income areas. Hence, sampling was conducted from randomly selected ten steel containers from all three socio-economic levels. Samples were collected for a period of 1 week from open steel containers placed in each socio-economic area during all four seasons.
Collection system in ST
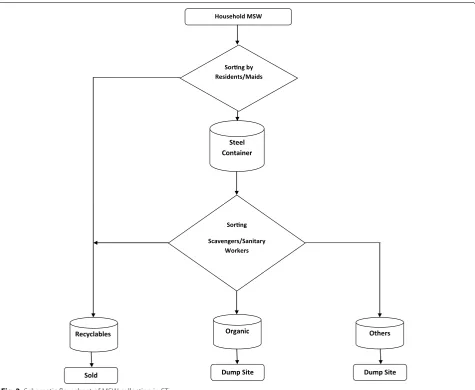
In poor countries like Pakistan, picking of waste is a source of income for poor people living in the third world countries [21, 22]. Therefore, the existing MSW collec-tion system in ST can be abridged through a schematic flow sheet as presented in Figs. 1 and 2.
Number of samples and sample size
A total of 84 samples were collected from all three socio-economic levels for all seasons. The total sample size was 8,400 kg.
Segregation of collected samples
Municipal solid waste was originally classified into 48 possible fractions. As the authors are using EASEWASTE Life Cycle Assessment (LCA) computer based software model for future MSW management and planning. The 48 default material fractions are named according to the dataset on Danish household waste 2003 [23]. During the sampling phase many of the MSW fractions were found in smidgens and hence were not weighable. Finally, the 48 fractions were reduced to 13 reported fractions.
Quantifying the waste fractions
After the sorting process, waste fractions were weighed on a calibrated digital scale. The same process was fol-lowed for the next 6 days and same method was applied in all three socio-economic groups for four seasons dur-ing the whole year.
Elemental and proximate analysis
Carbon (C), hydrogen (H), nitrogen (N) and sulphur (S) contents and oxygen (O) is determined by the difference using elemental analyser Elementar from Perkin-Elmer for elemental analysis. Gases resulting from combustion of sample in pure oxygen are measured by the instrument to find the content of the elements as per cent. Bomb calorimeter is used to determine the heating values [24]. Proximate analysis is performed according to the stand-ard methods [25] which involve the determination of ash [26], fixed carbon, moisture [27] and volatile matter [28]. Upon drying the sample in an oven for 3–4 h at a temper-ature 103 ± 1°C, the moisture is determined by weight difference. Percentage of volatile matter is determines by the loss in weight of sample, when ignited in preheated muffle furnace at 950 ± 20°C. Finally, the fixed carbon is determined by adding the percentage values of ash,
moisture and volatile matter and the sum is subtracted from 100.
Statistical analysis
To check the efficacy of data, statistical software IBM® SPSS-16.0® used. Correlation between income groups and generated MSW was determined. Analysis of vari-ance was carried out for MSW fractions and seasons of year.
Results and discussions
The average values of the MSW were calculated where data for the months of July, August and September rep-resent the mean weighted values of wet or monsoon sea-son when the rainy seasea-son increases the moisture with temperature of 25–35°C. Similarly, data for the months of November, December and January represent the mean
Household MSW
Steel Container
Sorng
Scavengers/Sanitary Workers
Organic
Recyclables Others
Dump Site
Sold Dump Site
Sorng by Residents/Maids
weighted values of winter season when the temperature 3–20°C is lower. The months of February, March and April represent the mean weighted values of spring sea-son when the temperature 12–25°C increases slightly. The months of May, June and October represent the mean weighted values of summer season when tempera-ture 30–45°C increases and the weather is hotter. Table 2, shows the percentage of weekly generated waste for all seasons in three socio-economic levels of ST Lahore.
Chemical analysis
ASTM standard methods were performed to elemental and proximate analysis of food waste and average values both of analyses are presented in Table 3. Calorific val-ues are not correspondent to that of fuel for combustion whereas, moisture values are very high. Having such high values of moisture and low heating value 5,642 J per g, introducing the modern waste management technologies like incineration and sanitary landfilling are not viable options.
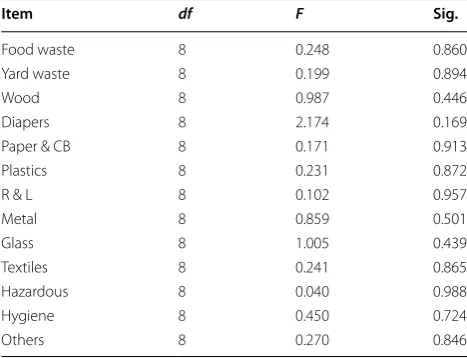
Statistical analysis (correlation and analysis of variance) Statistical analysis (ANOVA) shows significant differ-ence between seasons for food waste, diapers, paper and plastic (p < 0.01) as shown in Table 4. A regular trend of decrease in average MSW generation rate from the higher income group to the lowest was observed. Data presented in Table 2, shows that showed that the MSW generation rate increases from spring sea-son to wet seasea-son with highest values, then a steady decline have been observed from wet to winter season.
The increased financial status of households is likely to increase the overall MSW as the total amount of MSW and income groups was found to be significantly corre-lated, r = 0.810, p = 0.001. Sturdy correlation between economic categories and waste fractions has been found in food waste, paper, plastic, glass (p < 0.001) and yard waste and diapers (p < 0.01) respectively, as large amounts of these fractions are found in high-income group. Whereas, the fractions like stones, gravel, leather, rubber, textile, dust and straw, etc. present a negative correlation. The use of diapers increases in all income groups during the winter season because of the lower temperature, precluding frequent washing the infants. During monsoon season, the use of milk packed in tet-rahedron packs (Tetra PAK) increases in all income levels because of humid weather. The data show no sig-nificant changes in batteries, glass, leather, and rubber during the whole year. Metals being high value recycla-ble are segregated at source. Textiles, including sewn clothes, are generally donated to the maids working at homes in high-income group, probably explaining why textile waste from this sector is generated in low bers. In the middle and low-income groups, these num-bers decrease further as old clothes and tailoring waste are used to make cushions. Therefore, it is revealed from the study that most of the collected generated waste in all income groups of ST is organic in nature. The results show that the collected hazardous waste is less in terms of quantity. As there is no transfer station facility in ST, the collected hazardous waste is dumped unscientifically at the dump site.
Table 2 Percentage of weekly waste generated for all seasons in three socio-economic levels of ST Lahore
CB cardboard, R & L rubber and leather, tr trace.
Waste fractions Wet (July/Aug/Sep) Winter (Nov/Dec/Jan) Spring (Feb/Mar/Apr) Summer (May/June/Oct)
High Middle Low High Middle Low High Middle Low High Middle Low
Food waste 52 78.1 80.1 42.4 69.7 70.6 55.8 74.6 74.8 53.2 75.2 82.3
Yard waste 11.2 5.2 0.001 5.6 2.7 0.004 15.2 3.7 0.005 13.1 3.8 0.01
Wood 0.6 0.2 tr 0.7 1.2 0.01 0.3 tr tr 0.7 0.03 tr
Diapers 10.2 3.4 2.7 15.2 11.9 9.6 11.8 5.3 8.3 10.6 4.8 2.5
Paper & CB 8.5 3.7 1.1 10.6 5.8 2.4 7 4.7 0.97 9.7 3.9 1.2
Plastics 7.2 5.6 4.9 10.3 3.6 3.2 5.7 4.2 3.8 7.3 5.4 4.7
R & L 0.4 0.03 0.02 0.9 0.02 0.01 0.7 0.08 tr 0.6 0.2 tr
Metal 0.9 tr tr 0.22 tr tr tr tr tr tr tr tr
Glass 5.1 1.4 1.1 2.3 2.9 1.6 1.2 2.1 0.5 1.8 1.1 0.02
Textiles 0.8 0.5 0.2 2.7 0.5 0.4 0.2 2.7 0.6 0.13 2.7 0.5
Hazardous 0.09 0.09 0.6 0.7 0.03 0.3 0.04 0.3 0.5 0.06 0.13 0.7
Hygiene 0.03 0.01 tr 0.07 0.01 tr 0.01 tr tr tr 0.11 tr
Others 3.12 1.81 9.4 8.4 1.92 11.9 2.4 2.44 10.6 3.16 2.64 8.2
Socio‑economic effect on waste generation
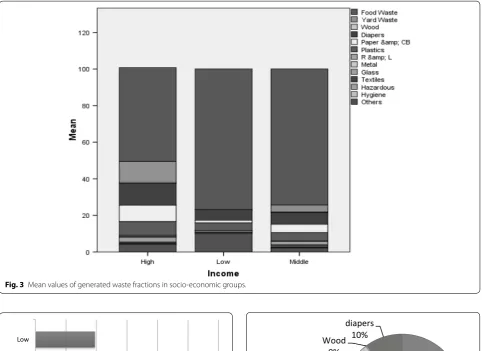
The trend of high waste generation in economically active areas is also experienced in high-income group of ST as it has been in Lahore [16, 29, 30], Abu Dhabi [31] and Morelia [32]. The food waste had the largest values in all the income groups. Figure 3 shows the mean values of different waste fractions generated in different socio-economic levels for the entire studied period.
The study further explains that the low-income group generates the least amount of MSW as compared to the other income groups. In ST, high-income group gen-erates 43% of the entire waste generated while the con-tribution of middle and low-income groups is 31.4 and 25.8%, respectively.
In high-income group, the percentage of organic waste remains once again at the highest with 75% followed by
paper and cardboard with 9% and plastics with 8%. Slight variations are found among the other different fractions of waste like glass, textiles and others for all socio-eco-nomic levels for all seasons. Similarly in middle and low-income groups, organic waste remains at the highest with 85 and 83% respectively.
The results also show that total amount of MSW col-lected is estimated to be 927 tons per day and the aver-age collection rate in ST is 0.69 kg per capita per day. The collection rates of high, middle and low-income groups are 1.1 kg per capita per day, 0.56 kg per capita day and 0.39 kg per capita day respectively as shown in Fig. 4.
The study shows that MSW generated during win-ter season is significantly low as compared to the other seasons. It is because of the fact that low temperatures during the month of December and January reduce the consumption of fresh foods and drinks.
In Fig. 5 among the different fractions of collected organic waste, food waste is the most prominent with 84% followed by diapers and yard waste with 10 and 6% respectively.
Conclusions and recommendations
• Results show that carbon 48.72%, nitrogen 2.41%, hydrogen 6.37%, sulphur 0.29, oxygen 40.15%, and C and N ratio of 28.64 were the chemical composition of food waste fraction. Ash content in percentage is determined by the difference in weight by placing this moisture free sample in a muffle furnace at 580– 600°C for 2 h.
• Physical survey conducted before the actual sam-pling, explicitly reconnoitered MSW collection sys-tem in ST Lahore. Samples of MSW were collected from steel containers placed in three different socio-economic levels in the town for four different sea-sons. Results show that average household collected waste is 0.69 kg per capita day and 81% of the col-lected waste is organic in nature.
• Food waste was 84% of total MSW with 72.21% mois-ture content and had a low heating value of 5,642 J/g. Seasonal variations in MSW are only significant for food waste, other organic and plastic.
• The results also show that there is positive correla-tion between the economic status and MSW genera-tion (p < 0.04).
• Detailed composition of MSW was analysed ini-tially using 48 fractions but sample collection was reduce to 13 fractions as most of the recyclables are separated by residents and maids/servants at source. The trend of high waste generation in economically active areas is also seen in the study area where high-income group generates 43% of entire waste gener-ated in the town.
Table 3 Elemental and proximate analyses
Range Average
Elemental analysis
C (%) 46.20–49.16 48.72
N (%) 1.11–4.46 2.41
H (%) 5.68–6.62 6.37
S (%) 0.12–0.42 0.29
O (%) 36.43–41.87 40.15
C:N 10.35–43.20 28.64
Proximate analysis
Ash (%) 0.76–2.38 1.34
Calorific value (J/g) 3,970–8,599 5,642
Fixed carbon (%) 3.42–8.09 5.41
Moisture content (%) 54.32–78.30 72.21
Volatile matter (%) 16.56–35.64 23.14
Table 4 ANOVA results for seasonal effects on waste gen-eration
Item df F Sig.
Food waste 8 0.248 0.860
Yard waste 8 0.199 0.894
Wood 8 0.987 0.446
Diapers 8 2.174 0.169
Paper & CB 8 0.171 0.913
Plastics 8 0.231 0.872
R & L 8 0.102 0.957
Metal 8 0.859 0.501
Glass 8 1.005 0.439
Textiles 8 0.241 0.865
Hazardous 8 0.040 0.988
Hygiene 8 0.450 0.724
• Comparison of collected waste by composition and seasonal variation shows that in all three socio-eco-nomic levels slight variations are found among differ-ent fractions of organic waste like the use of diapers increases in winter season. For all studied seasons and economic levels, minimum waste is generated in the winter season as compared to the spring, summer and wet/rainy seasons.
• The upshot of this study suggested a methodology of waste composition survey, the summary of
quantifi-cation and characterization of collected waste based on compostable and recyclable materials and the classification category list.
• Concerning MSW collection, transportation and dumping, the authors strongly suggest for a transfer station facility so that collected waste could be seg-regated on purely scientific grounds before the final dumping.
• The results and methodology are expected to be use-ful for authorities, planner and decision-makers of boroughs to develop an economically suitable and Fig. 3 Mean values of generated waste fractions in socio-economic groups.
0 0.2 0.4 0.6 0.8 1 1.2 High
Middle Low
Fig. 4 Collection rates of high, middle, and low-income groups for all seasons.
Food waste 84% Yard waste
6%
Wood 0%
diapers 10%
environmentally sustainable waste management sys-tem.
• Concerning further monitoring on MSW charac-terization and quantification for better results, the authors suggest that household survey and household sampling should also be conducted for different sea-sons. Moreover, household selection and sampling points must be prudently selected with different fac-tors such as population density, household income, and level of urbanization.
Authors’ contributions
All authors have read the manuscript thoroughly before submitting as a PhD student, 90% of the research is carried out the first/corresponding author AK and the co-authors have been guiding and supporting the corresponding author at every step of research as well as drafting and proof reading the manuscript. All authors read and approved the final manuscript.
Author details
1 College of Earth and Environmental Sciences, University of the Punjab,
Lahore, Pakistan. 2 Department of Space Science, University of the Punjab,
Lahore, Pakistan.
Acknowledgements
We thank College of Earth and Environmental Sciences, University of the Punjab, Lahore, and the Higher Education Commission (HEC), Pakistan, for pro-viding us the necessary facilities and financial support to conduct this study.
Compliance with ethical guidelines
Competing interests
The authors declare that they have no competing interests.
Received: 31 March 2015 Accepted: 24 July 2015
References
1. Kinnaman TC (2009) The economics of municipal solid waste manage-ment. Waste Manag 29(10):2615–2617
2. Consonni S, Giugliano M, Massarutto A, Ragazzi M, Saccani C (2011) Material and energy recovery in integrated waste management systems: project overview and main results. Waste Manag 31(9):2057–2065 3. Da Cruz NF, Simões P, Marques RC (2012) Economic cost recovery in the
recycling of packaging waste: the case of Portugal. J Clean Prod 37:8–18 4. Al-Khatib IA, Monou M, Zahra ASFA, Shaheen HQ, Kassinos D (2010) Solid
waste characterization, quantification and management practices in developing countries. A case study: Nablus district–Palestine. J Environ Manag 91(5):1131–1138
5. Batool SA, Chaudhry N, Majeed K (2008) Economic potential of recycling business in Lahore, Pakistan. Waste Manag 28(2):294–298
6. Burnley SJ (2007) A review of municipal solid waste composition in the United Kingdom. Waste Manag 27(10):1274–1285
7. World Resources Institute (1996) United Nations Environmental Program, United Nations Development Program. The World Bank, World Resources 1996–1997. The Urban Environment. Oxford University Press, Oxford. http://pdf.wri.org/worldresources1996-97_bw.pdf
8. McDougall FR, White PR, Franke M, Hindle P (2008) Integrated solid waste management: a life cycle inventory. Wiley-Blackwell, Oxford
9. Zeng Y, Trauth KM, Peyton RL, Banerji SK (2005) Characterization of solid waste disposed at Columbia Sanitary Landfill in Missouri. Waste Manag Res 23(1):62–71
10. Buenrostro O, Bocco G (2003) Solid waste management in municipalities in Mexico: goals and perspectives. Resour Conserv Recycl 39(3):251–263 11. Ashley R, Blackwood D, Souter N, Hendry S, Moir J, Dunkerley J et al
(2005) Sustainable disposal of domestic sanitary waste. J Environ Eng 131(2):206–215
12. Sandulescu E (2004) The contribution of waste management to the reduction of greenhouse gas emissions with applications in the city of Bucharest. Waste Manag Res 22(6):413–426
13. Matthews E, Amann C, Bringezu S, Fischer-Kowalski M, Hüttler W, Kleijn R et al. (2000) The weight of nations. Material Outflows from Industrial Economies. World Resources Institute, Washington
14. Meyers GD, Mcleod G, Anbarci MA (2006) An international waste conven-tion: measures for achieving sustainable development. Waste Manag Res 24(6):505–513
15. Louis GE (2004) A historical context of municipal solid waste manage-ment in the United States. Waste Manag Res 22(4):306–322 16. Batool SA, Chuadhry MN (2009) The impact of municipal solid waste
treatment methods on greenhouse gas emissions in Lahore, Pakistan. Waste Manag 29(1):63–69
17. Gómez G, Meneses M, Ballinas L, Castells F (2008) Characterization of urban solid waste in Chihuahua, Mexico. Waste Manag 28(12):2465–2471 18. Kumar S, Bhattacharyya JK, Vaidya AN, Chakrabarti T, Devotta S, Akolkar
AB (2009) Assessment of the status of municipal solid waste manage-ment in metro cities, state capitals, class I cities, and class II towns in India: an insight. Waste Manag 29(2):883–895
19. Pokhrel D, Viraraghavan T (2005) Municipal solid waste management in Nepal: practices and challenges. Waste Manag 25(5):555–562 20. Chen X, Geng Y, Fujita T (2010) An overview of municipal solid waste
management in China. Waste Manag 30(4):716–724
21. Asim M, Batool SA, Chaudhry MN (2012) Scavengers and their role in the recycling of waste in Southwestern Lahore. Resour Conserv Recycl 58:152–162
22. Kamran A, Chaudhry MN, Batool SA (2015) Role of the informal sector in recycling waste in Eastern Lahore. Pol J Environ Stud 24(2):537–543 23. Riber C, Petersen C, Christensen TH (2009) Chemical
composi-tion of material fraccomposi-tions in Danish household waste. Waste Manag 29(4):1251–1257
24. ASTM STANDARD D5468-02 (2007) Standard test method for gross calorific and ash value of waste materials. ASTM International, West Conshohocken
25. ASTM Standard E870-82 (1998) Standard test method for analysis of wood fuels. ASTM International, West Conshohocken
26. ASTM Standard D1102-84 (2013) Standard test method for ash in wood. ASTM International, West Conshohocken
27. ASTM Standard E871-82 (2013) Standard test method for moisture analy-sis of particulate wood fuels. ASTM International, West Conshohocken 28. ASTM Standard E872-82 (2013) Standard test method for volatile
matter in analysis of particulate wood fuels. ASTM International, West Conshohocken
29. Jadoon A, Batool SA, Chaudhry MN (2014) Assessment of factors affecting household solid waste generation and its composition in Gulberg Town, Lahore, Pakistan. J Mater Cycles Waste Manag 16:73–81
30. Hussain F, Chaudhry MN, Batool SA (2014) Assessment of key parameters in municipal solid waste management: a prerequisite for sustainability. Int J Sustain Dev World Ecol 21(6):519–525
31. Abu Qdais HA (2007) Techno-economic assessment of municipal solid waste management in Jordan. Waste Manag 27(11):1666–1672 32. Buenrostro O, Bocco G, Bernache G (2001) Urban solid waste generation