R E S E A R C H
Open Access
Method development for simultaneous detection
of ferulic acid and vanillin using high-performance
thin layer chromatography
Swarali S Hingse, Shraddha B Digole and Uday S Annapure
*Abstract
Background:A simple, accurate, and reliable high-performance thin-layer chromatography (HPTLC) method was developed for separation and detection of ferulic acid and vanillin.
Methods:Separation of ferulic acid and vanillin was carried out on 20 × 10 cm thin layer chromatography (TLC) plates using mobile phase containing toluene/1, 4-dioxan/acetic acid in the ratio 9:2.5:0.4 (v/v). The FA and vanillin were scanned at 320 and 312 nm, respectively. Method was validated for linearity, accuracy, precision, robustness, limit of detection, limit of quantification, and specificity.
Results:Retention factor (Rf) obtained for ferulic acid and vanillin was 0.48 and 0.56, respectively. The correlation coefficients, 0.9975 and 0.9991 with an average recovery of 98.77% and 98.45% obtained for ferulic acid and vanillin respectively by this method were satisfactory.
Conclusion:The optimized method was found to be efficient, precise, accurate, specific, and economic. Therefore, the method would be useful for both qualitative and quantitative routine analysis in pharmaceutical, food industry, and research laboratories.
Keywords:Ferulic acid; Vanillin; High-performance thin layer chromatography (HPTLC); Simultaneous detection
Background
Aromatic compounds are present in natural sources with substantial combinations which are directly respon-sible for its odor and sensitivity. They can be categorized as volatile organic compounds like aldehydes, alcohols, ketones, esters, lactones, and terpenes (Raisi et al. 2008). They are known to be precursors for the production of numerous products employed in the food, pharmaceutical, and chemical industries and are present at very low concen-trations in natural sources. According to US and European legislations, synthetic flavor production is not considered as natural. Alternatively, biotechnology offers microorganisms as production hosts for different types of aromatic com-pounds in industrial fermentative processes (Lomascolo et al. 1999). The most intensively studied biotransformation using microorganisms is the bio conversion of ferulic acid (FA) to produce natural vanillin (Priefert et al. 2001).
FA is an important precursor of vanillin that is available in abundance in plant cell walls linked to polysaccharide by an ester or ether bonds (Xu et al. 2005). FA is a potent antioxidant because it effectively scavenges free radicals and even possesses antimicrobial properties by preventing the lipid peroxidation caused by microbes (Graf 1992). Moreover, it is used in cosmetics for the photo protec-tion of skin and in protecprotec-tion against various inflam-matory diseases.
Vanillin is widely used in food industry as a flavoring agent but also has applications in some fragrances and pharmaceuticals (Priefert et al. 2001). It is also known to possess anti-metastatic, anticancer (Ho et al. 2009) and anti-inflammatory (Wu et al. 2009) activities. It exhibits antimicrobial properties due to its phenolic nature and hence used to develop antimicrobial films used in pack-aging of bakery products (Rakchoy et al. 2009).
FA and vanillin are generally determined by various chromatographic methods. Different approaches such as UV spectrophotometry (Mabry et al. 1970; Macheix et al. 1990) * Correspondence:[email protected]
Food Engineering and Technology Department, Institute of Chemical Technology, Nathalal Parekh Marg, Matunga, Mumbai - 400019, India
gas chromatography (GC), capillary electrophoresis (CE), high-pressure liquid chromatography (HPLC), thin layer chromatography (TLC), and high-performance thin layer chromatography (HPTLC) are some of the frequently used methods for the detection, qualitative analysis, and quantification (Sharma et al. 2007).
Spectrophotometric methods are used for identification of phenolic acids and are generally carried between a range of 220 to 320 nm (Mabry et al. 1970; Macheix et al. 1990); however, methods such as the Folin Ciocalteu spectro-photometric method results in nonspecific detection of the phenolic compounds and the interference of components such as ascorbic acid in food samples, that behave as redu-cing agents. Absorption of phenolic compounds is affected by pH, solvents used in the method and the interference of proteins and amino acids (Constantine et al. 2007).
Volatile compounds are directly analyzed by gas chroma-tography, a technique of unsurpassed separation capacity (Sostaric et al. 2000). GC is a major chromatographic technique employed for the analysis of essential phenolic acids in plants. It deals with high sensitivity and selectivity (Chiou et al. 2007) but requires derivatization step of hy-droxyl groups in phenolic compounds. They are modified by various reagents to make more volatile compounds by a process such as methylation, conversion into tri-methylsilyl (TMS) derivatives. However, problems such as poor separation and low stability after derivatization state are some of the shortcomings of this method. CE is too employed for analysis of phenolic compounds (Huck et al. 2005; Butehorn et al. 1996). Mostly, the method falls in the field of natural product research, including the analysis of plants, vegetables, herbs, and other plant- or fruit-derived products. It results in oxidation of phenolic compounds by dissolved oxygen and increase in migration time of flavonoids due to the increase in buffer concentrations (Constantine et al. 2007).
TLC methods have the ability to screen phenolic com-pounds easily (Tilay et al. 2008). The results obtained by TLC method are generally quantified using more multi-faceted techniques like HPTLC (Mabinya et al. 2006). However detection of vanillin by spraying with 2, 4-dinitrophenylhydrazine (2, 4-DNPH) is not significant as the peaks are not detected properly. Currently, the main qualita-tive and quantitaqualita-tive techniques for phenolic compound de-tection are HPLC (Rao et al. 1999; Zheng et al. 2007). The European pharmacopoeia suggests the development of such analytical method which demands the adequate amount of reagents, solvents, and material (European Pharmacopoeia 2008). HPTLC allows for the simultaneous analysis of large sample size using small quantities of solvents, thus reducing time and cost of the analysis. The sensitivity for phenolic compounds performed by HPTLC is more as compared to HPLC (Prinjaporn et al. 2013). Mobile phase having pH 8 and above can be employed. Sample with turbidity and
different combinations of solvent can be directly applied. It facilitates automated application and repeated scanning of the chromatogram with the same or different parameters (Bakshi et al. 2002). Therefore, this technique should be taken into consideration as an alternative to HPLC.
HPTLC is a sophisticated instrumental technique which allows a fast and inexpensive method for analysis. Special advantage of HPTLC includes high sample throughput and low cost per analysis. HPTLC offers a great variety of stationary phases with unique selectivity for mixture com-ponents and their separation simultaneously. Processing of standards and samples identically on the same plate directs to better accuracy and precision of method for assessment. HPTLC development is extensive as the mobile phases are fully evaporated before the detection step thus preventing solvent interference in analysis. It minimizes exposure risks and significantly discarding toxic organic effluent problems were reduced thereby reducing possibilities of environment pollution. In response to this, HPTLC-based methods could be considered as a good alternative as they are being explored as an important tool in routine analysis. The HPTLC-developed method is actively used in application of qualitative and quantitative analyses of a wide range of compounds, such as herbal and botanical dietary supplements and nutraceuticals. It helps in identifying compounds present in a given substance; to check starting raw materials (plant extracts, extracts of animal origin, fermentation mixtures) identification of drugs and their metabolites in biological media such as urine, plasma, or gastric fluid (pharmacological, toxi-cological, pharmacokinetic) (Renger 1993; 1998).
The aim of the present study is to develop rapid, economic, selective HPTLC method for analysis and simultaneous de-termination of FA and vanillin with proper peak separation and hence can be used for routine high-throughput detec-tion and determinadetec-tion of phenolic compounds. It is a
one-step biotransformation process using culture Pycnoporus
cinnabarinus which undergoes propenoic acid chain
degradation of FA to vanillin (Tilay et al. 2008).
Methods
Chemicals/Reagents
Standard FA and vanillin (99% purity), maltose, diammo-nium tartarate, yeast extract, malt extract, potassium dihydrogen orthophosphate, magnesium sulfate, calcium chloride, thiamine hydrochloride, sodium hydroxide, and agar powder were procured from Hi-Media Laboratory (Mumbai, India). HPLC grade toluene, 1, 4-dioxan, acetic acid, ethyl acetate, and methanol were procured from Hi-Media (Mumbai, India).
Instrumentation
CAMAG TLC system consist of a CAMAG Linomat V (Muttenz, Switzerland) sample applicator and CAMAG
Hingseet al. Journal of Analytical Science and Technology2014,5:21 Page 2 of 9
TLC Scanner 3 controlled by WinCats software (1.4.3.6336);
CAMAG glass twin-trough chambers (20 × 10 × 4 cm3);
100-μl Hamilton syringe; Silica gel plates (G60F254, 20 ×
10 cm) were procured from E-Merck Pvt. Ltd., Mumbai, India. For extraction of vanillin, Buchi evaporator system was used consisting of Buchi evaporator R-124, Buchi water bath B-480, and Buchi vacuum controller B-721.
Preparation of stock solution
Standard stock solutions were prepared by dissolving 25 mg of vanillin and 25 mg of FA in 25 ml of methanol. Working standard solution was diluted (1:200) from stock solution of FA and vanillin to attain concentration of 5μg/ml.
Microorganism
Pycnoporus cinnabarinus NCIM 1181 was procured from
National Centre for Industrial Microorganism (NCIM), National Chemical Laboratory (NCL), Pune, India. Culture was maintained on potato dextrose agar slants at 4°C.
Media for vanillin production
A production media consisting of maltose 20 g/l, diammo-nium tartarate 1.8415 g/l, KH2PO4 0.2 g/l, CaCl22H2O
0.0132 g/l, MgSO4·7H2O 0.5 g/l, yeast extract 0.5 g/l, and
thiamine hydrochloride 2.5 mg/l was adjusted to pH 7 and
inoculated using mycelium fragments of P. cinnabarinus
(Gross et al. 1993). This was further incubated on an incu-bator shaker (150 rpm) at 37°C for 6 days. After 3 days of growth, sterile solution of FA (0.03 g/100 ml) was added to the media prepared by dissolving FA in 0.1 N NaOH in the form of sodium ferulate.
Extraction of FA and vanillin from the culture media
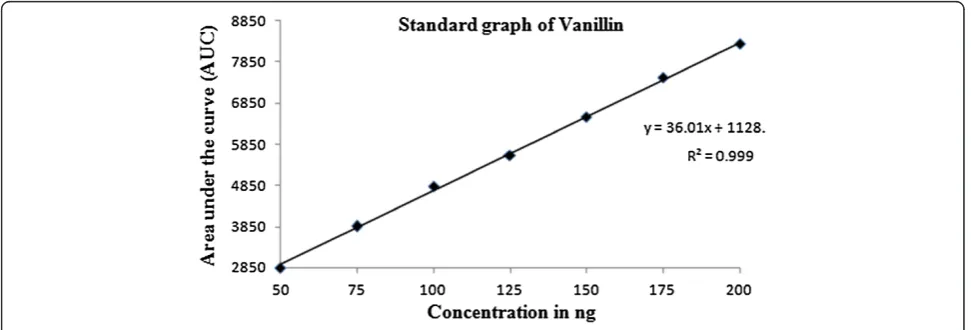
The broth obtained after fermentation was filtered and the filtrate was acidified to obtain a pH of 1 to 2.80 ml of the above acidified solution was extracted thrice with equal volume of ethyl acetate. The extracts and the residue were redissolved in 50% (v/v), respectively. The organic phase containing FA and vanillin was con-centrated (up to 2 to 3 ml) using a rotary vacuum Figure 1Standard graph of FA by HPTLC method.
evaporator with conditions (55°C, 150 rpm, <80 mbar) followed by reconstitution in 2 ml of methanol 50% (v/v) (Tilay et al. 2010). This solution was used for quantification of FA and vanillin by HPTLC.
Instrumentation and chromatographic parameters
HPTLC was executed using silica gel 60F254 plates. A
10 μl of standard working solutions of FA and vanillin
were applied to the plates of size 20 × 10 cm with a 5-mm band length. Ascending chromatography silica gel plate de-velopment traveled to a distance of 85 mm at temperature of 25°C with toluene/1, 4-dioxan/acetic acid (9:2.5:0.4;v/v) as mobile phase. After development, the plates were dried and chromatograms were recorded at 320 and 312 nm, respectively using CAMAG TLC Scanner 3. Quantitative evaluation was performed with WinCats software using deuterium lamp having slit width of 5 × 0.45 mm and an application rate of 150 nL/s.
Validation of method
Validation was performed in terms of linearity, specifi-city, precision, limit of detection (LOD), limit of quan-tification (LOQ), robustness, and system suitability by ICH guidelines (CPMP/ICH/381/95).
Linearity
Standard solution of FA (50 to 250 ng/band) and vanillin (50 to 200 ng/band) with varying volumes were applied on TLC plates. A plot of peak area against concentrations and its respective standard deviation (SD) and coefficient of correlation was calculated for both the compounds.
Precision
Precision specifies random errors. Results were expressed in percent relative standard deviation (%RSD < 2). Standard solution of FA (100, 150, and 200 ng/band) and of vanillin (100, 150, and 200 ng/band) were applied. Intra-day preci-sion was evaluated by applying each concentration five times on the same day. Inter-day precision was evaluated by applying each concentration five times on three different days with an interval of 24 h.
Recovery
The recovery was used to determine the accuracy of the method. Recovery of FA and vanillin with three different
concentration namely, 50, 100, and 150 ng (n= 3) was
performed. Samples after extraction were spiked with standard concentration and applied. Peak areas of stand-ard added to samples were calculated and average percent recovery was estimated. Further average percent recovery was calculated.
Specificity
Specificity was performed to compare the standard FA and vanillin and extract. It was calculated by comparing the Rf of the peak, peak start, peak apex, and peak end of the standard and extract. The spectral scan of both the standard and extract was compared. Spectrum scan acceler-ated at 100 nm/s with split dimensions 5 × 0.45 mm, micro. Spectral detection for optimum wavelength was calculated in the range 200 to 700 nm.
Robustness
Modifications in mobile phase concentration, mobile phase volume, mobile phase saturation time, and te-mperature were examined to check the robustness. Standard solutions of FA (150 ng/band) and vanillin (150 ng/band) were applied thrice and %RSD of each compound was calculated.
Limit of detection and limit of quantification
LOD is the lowest amount of compound that can be detected with signal-to-noise ratio of 3:1 and LOQ is the lowest amount of compound which can be quantified by signal-to-noise ratio 10:1 with adequate precision and
Table 1 Intra- and inter-day precision (n= 5)
Compound Std amount (ng/band)
Intra-day precision Inter-day precision
SDa %RSDb SDa %RSDb
Ferulic acid 100 4.52 0.021 1.64 0.053
150 2.93 0.015 4.66 0.091
200 4.51 0.001 4.57 0.050
Vanillin 100 2.09 0.044 2.21 0.040
150 2.97 0.048 2.77 0.042
200 1.93 0.022 2.02 0.023
SD, standard deviation (n= 5); RSD, percent relative standard deviation (n= 5).
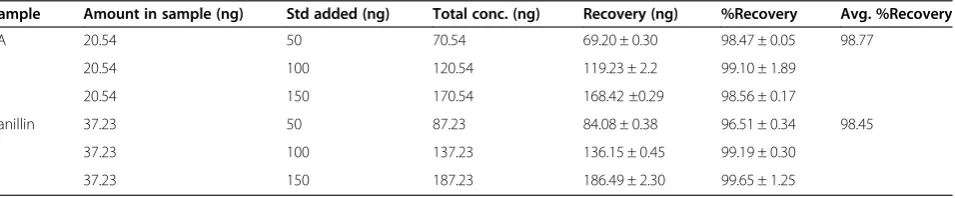
Table 2 Recovery of FA and vanillin
Sample Amount in sample (ng) Std added (ng) Total conc. (ng) Recovery (ng) %Recovery Avg. %Recovery
FA 20.54 50 70.54 69.20 ± 0.30 98.47 ± 0.05 98.77
20.54 100 120.54 119.23 ± 2.2 99.10 ± 1.89
20.54 150 170.54 168.42 ±0.29 98.56 ± 0.17
Vanillin 37.23 50 87.23 84.08 ± 0.38 96.51 ± 0.34 98.45
37.23 100 137.23 136.15 ± 0.45 99.19 ± 0.30
37.23 150 187.23 186.49 ± 2.30 99.65 ± 1.25
Mean ± standard deviation (n= 3).
Hingseet al. Journal of Analytical Science and Technology2014,5:21 Page 4 of 9
specificity. LOD and LOQ of FA and vanillin were calculated.
System suitability
System suitability was executed to check the reprodu-cibility and resolution of the method. Standard solu-tion of both the standards of 150 ng concentrasolu-tion
(n= 5) was analyzed on the same chromatographic
plates. After development, plates were scanned and the peak area of each concentration and their Rf values were calculated.
Results and discussion
A GC method for detection of phenolic compounds is complicated and unsuitable for rapidly analyzing profuse
samples and with derivatization step. HPLC-ECD, a new method was developed for the analysis of phenolic com-pound. However, use of HPLC with ECD is not feasible as a routine analytical method (Takahashi et al. 2013). Even with the HPLC UV detector system, the analysis is time consuming and the quantity of the solvents is the main concern. In the present study, two compounds FA and its bio-transformed product vanillin were quantified using HPTLC. Various mobile phases were screened for proper separation of both the compounds. Well-defined peaks with Rf values 0.48 for FA and 0.56 for vanillin were obtained using toluene/1, 4-dioxan/acetic acid (9:2.5:0.4;v/v) (Olsson et al. 1974). Experimental conditions should be selected when the compounds to be analyzed moves towards or near to the center of the layer (Rf = 0.5) Figure 3HPTLC chromatogram of standard FA.
(Srivastava 2011). Krishna veni et al. (2013) used methanol/ water/glacial acetic acid (20:5:2; v/v) as the mobile phase and resulted with Rf 0.84 for vanillin. For better peak detection and Rf, the polarity can be reduced. Other mobile phases were compared which resulted in tailing of peaks (Sharma et al. 2007) using methanol/ water/isopropanol/acetic acid (30:65:2:3; v/v) and inappro-priate separation of both the compounds with toluene/ethyl acetate/formaldehyde (6:3:1;v/v) (Srivastava et al. 2008), no identification of vanillin peak using hexane/ethyl acetate (5:2; v/v) (Hennig et al. 2011) and 1-butanol/ acetic acid/water (66:17:17; v/v) (Males et al. 2001).
Chloroform/methanol/formic acid (85:15:1; v/v) with
spraying reagent 2, 4-dinitrophenylhydrazine was used for vanillin detection but resulted in poor peak visualization and separation of vanillin (Mabinya et al. 2006). Sharp peaks were obtained with a presaturation of mobile phase for 20 min. FA and vanillin was quantified using UV detector and scanning at 320 and 312 nm. The peaks corresponding to FA and vanillin in samples had the same retention time when compared to their re-spective standards.
Linearity
Linearity was achieved with concentrations ranging from 50 to 250 ng/band for FA and 50 to 200 ng/band for vanillin (Figures 1 and 2). The regression equation and correlation coefficient of FA was found to be y= 37.94 ×X+ 621.04, R2
= 0.9975 with SD = 1.95% and for vanillin y= 36.016 × X+ 1128.3,R2= 0.9991 with SD = 1.60%.
Precision
To get accurate chromatographic results, the precision of the chromatographic method must be analyzed and confirmed whether it is fit for purpose which is adequate
to the analytical requirements and it is evaluated in terms of intra- and inter-day precision. The standard deviation and percent relative standard deviation will evaluate the variation limit of the analysis. The value lower than 2% indicate the method is more precise to variation which assumes that the chromatograph does not malfunction after the system precision testing has been performed (Indrayanto 2011). Peak areas meas-urement of 100, 150, and 200 ng concentration of FA and vanillin showed %RSD less than 2 as shown in Table 1. Both intra- and inter-day results suggested an excellent method of precision which ensures the objective of the method development phase to be reproducible.
Recovery
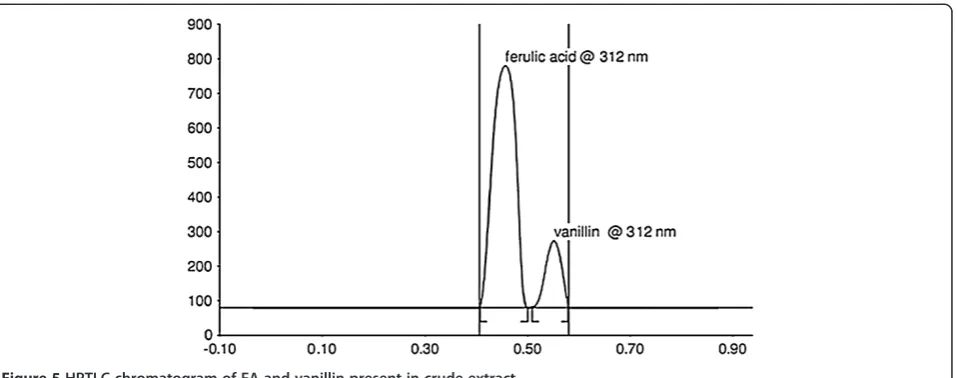
Recovery is an important parameter as it offers informa-tion about the recovery of the analyte from the sample preparation and the effect of matrix. If the recovery is close to 100% then it implies that the proposed analyt-ical method is free from constant and proportional systematic error (Srivastava 2011). Recovery of FA at three different levels obtained was 98.47%, 99.1%, and 98.75% with 98.77% average recovery and of vanillin was 96.51%, 99.19%, and 99.65% with 98.45% average Figure 5HPTLC chromatogram of FA and vanillin present in crude extract.
Table 3 Specificity of FA and vanillin
Retention factor (Rf) Peak start Peak apex Peak end
FAa 0.43 0.48 0.51
Vanillina 0.49 0.56 0.62
FAb 0.41 0.47 0.50
Vanillinb 0.51 0.56 0.60
a
Standard ferulic acid and vanillin;bcrude extracts.
Hingseet al. Journal of Analytical Science and Technology2014,5:21 Page 6 of 9
recovery. The results are shown in Table 2. The per-centage recovery was close to 100% which indicated no interference of any other compound and representing the accuracy of the method. This indicates the suitabil-ity of the method for the routine analysis.
Specificity
Specificity is a method which provides a response for only a single analyte. This study is performed to check how accurately and specifically the analyte of interest is estimated in the presence of other components with system interference during detection and quantifica-tion of analyte (Indrayanto and Yuwono 2010; Kakde et al. 2008). Retention factor values of standard FA and vanillin were compared with sample extract. There was no interference of other peaks as shown in Figures 3, 4, and 5. The standard and sample was compared with
respect to peak start, peak apex, and peak end of the bands which showed the specificity between extracts and standard compound and purity of the peaks (Table 3). Overlay of the standard and sample com-pound using spectral scan was compared to confirm the specificity (Figures 6 and 7). Spectral scan of both the compounds showed maximum absorption at 320 nm for ferulic acid and 312 nm for vanillin. Thus, results obtained from comparison of peak and spectral scan showed the method is specific for detection of FA and vanillin.
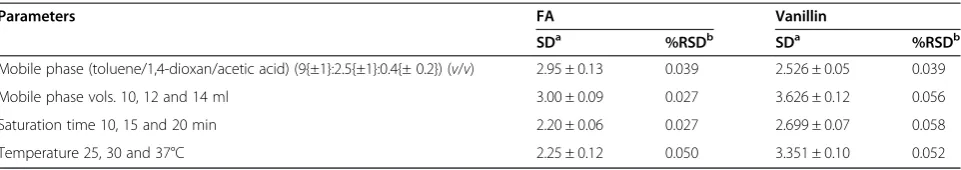
Robustness
Robustness can be described as the ability to reproduce the analytical method under different circumstances and provides an indication of its reliability during nor-mal phase. It was introduced to avoid problems in Figure 6Overlay of UV absorption spectra of standard FA with crude extract.
inter-laboratory studies and to discover the potentially repairable factors (Van der Hyden et al. 2001). Accord-ing to the ICH guidelines, the evaluation of robustness should be considered during the development phase and depends on the type of procedure under study. For robustness evaluation by chromatographic method, the acceptance criteria are that, the Rf values of all stan-dards should lie within the acceptance criteria of the precision method by performing variations in consid-ered parameters. Calculations of standard or relative error are common ways to look at the data and departures from deviations in the data will directly affect robustness. Variations made in mobile phase composition, mobile phase volume, saturation time, and temperature showed less %RSD and SD for FA and vanillin by spotting 150 ng/
spot (n= 3) (Table 4). No significant change in Rf or
response to FA and vanillin was observed which indicated robustness of the method. Robustness study has provided valuable information about the quality and reliability of the method and no further development or optimization is necessary.
Limit of detection and limit of quantification
LOD is based on the analyte response sensitivity (re-sponse per amount or concentration per time, using either peak height or area), and LOQ is the lowest amount of analyte that can be quantitatively determined in sample with defined precision and accuracy under standard conditions. LOQ is usually a multiple of LOD (Kakde et al. 2008). Standard deviation and slope used in the equations are used to determine LOD and LOQ which is equivalent to instrument sensitivity for the spe-cific analyte, reinforcing that the LOD/LOQ details, are expressed in units of analyte concentration (Apostol et al. 2012). It is important to determine sensitivity using ana-lyte amounts near to their detection limits. LOD and LOQ with signal-to-noise ratio of FA were found to be 13.63 and 45.42 ng/band, respectively. LOD and LOQ of vanillin were found to be 10.59 and 35.30 ng/band, respectively. Sensitivity of the method is evaluated with regard to LOD and LOQ (Kakde et al. 2008). These re-sults indicate the sensitivity of the method which can be used for quantification of the compound.
System suitability
System suitability test (SST) is an integral part of many analytical procedures. The test is based on the conception that, the equipment, electronics, analytical operations, and samples to be analyzed represent an integral system that can be evaluated. System suit-ability test parameters to be established for a par-ticular procedure depend upon the type of procedure being validated. It is the ability of the analytical method to detect analyte quantitatively in the pres-ence of other components which are expected to be present in the sample and they should be chromato-graphed along with the analyte to check the system suitability and retention factor of the required ana-lyte (Dolan 2004). On the basis of repeatability rela-tive standard deviations of peak response, SST was analyzed. Retention factor of FA and vanillin were 0.48 and 0.56, respectively. Standard deviation of FA was 2.95 ± 0.13 with 0.039% RSD and standard deviation of vanillin was 3.62 ± 0.12 with 0.056% RSD. The low %RSD indicates the reproducibility and the system suit-ability of the method.
Conclusion
The simultaneous detection of FA and vanillin by the HPTLC method can be performed as there is noteworthy difference in their retention factor values. The proposed method was developed and validated by ICH guidelines which is simple, rapid, accurate, precise, sensitive, and eco-friendly. The mobile phase selected was toluene/1, 4-dioxan/acetic acid 9:2.5:0.4 (v/v) which resulted in proper peak separation as compared to different mobile phase which were not able to separate the compounds prop-erly. Other chromatographic methods like HPLC, GC, and spectrophotometric mentioned may not be ap-plied for routine check because of the various short-comings as compared to HPTLC. The total optimized method is therefore useful in both qualitative and quantitative analysis for routine assays in pharmaceut-ical and food industry within acceptable limits.
Competing interests
The authors declare that they have no competing interests.
Table 4 Robustness of FA & Vanillin
Parameters FA Vanillin
SDa %RSDb SDa %RSDb
Mobile phase (toluene/1,4-dioxan/acetic acid) (9{±1}:2.5{±1}:0.4{± 0.2}) (v/v) 2.95 ± 0.13 0.039 2.526 ± 0.05 0.039
Mobile phase vols. 10, 12 and 14 ml 3.00 ± 0.09 0.027 3.626 ± 0.12 0.056
Saturation time 10, 15 and 20 min 2.20 ± 0.06 0.027 2.699 ± 0.07 0.058
Temperature 25, 30 and 37°C 2.25 ± 0.12 0.050 3.351 ± 0.10 0.052
a
SD, standard deviation of peak area (n= 3);b
RSD, percent relative standard deviation (n= 3).
Hingseet al. Journal of Analytical Science and Technology2014,5:21 Page 8 of 9
Authors’contributions
SH and SD has performed all the experimental and analytical work and drafted the manuscript. The guidelines for all the mentioned part was provided by UA. All authors read and approved the final manuscript.
Received: 27 October 2013 Accepted: 5 February 2014
References
Apostol I, Krull I, Kelner D (2012) Analytical Method Validation for Biopharmaceuticals. Analytical Chemistry. doi:10.5772/52561
Bakshi M, Singh SJ (2002) Development of validated stability-indicating assay methods-critical review. J Pharm Biomed Anal 28:1011–1040
Butehorn U, Pyell U (1996) Micellar electrokinetic chromatography as a screening method for the analysis of vanilla flavorings and vanilla extracts.
J Chromatogr A 736:321–332
Chiou A, Karathanos VT, Mylona A, Salta FN, Preventi F, Andrikopoulos NK (2007) Currants (Vitisvinifera L.) content of simple phenolic and antioxidant activity. Food Chem 102:516–522
Constantine DS (2007) Extraction, separation, and detection methods for phenolic acids and flavonoids. J Sep Sci 30:3268–3295
Dolan JW (2004) System suitability. LC troubleshooting, BASi Northwest Laboratory, McMinnville, Oregon, USA 17(6):328–332
European Pharmacopoeia (EDQM) (2008) 6th edn. Strasbourg, Council of Europe Graf E (1992) Antioxidant potential of ferulic acid. Free Radical Biol Med
13:435–448
Gross B, Asther M, Corrieu G, Brunerie P (1993) Production of vanillin by bioconversion of benzenoid precursors byPycnoporus. U.S. Patent 5262315 B Hennig L, Garcia GM, Giannis A, Bussmann RW (2011) New constituents of
Baccharis genistelloides(Lam.). Pers. Arkivoc 6:74–81
Ho K, Yazana LS, Ismail N, Ismail M (2009) Apoptosis and cell cycle arrest of human colorectal cancer cell line HT-29 induced by vanillin. Cancer Epidem 33:155–160
Huck CW, Stecher G, Scherz H, Bonn G (2005) Analysis of drugs, natural and bioactive compounds containing phenolic groups by capillary
electrophoresis coupled to mass spectrometry. Electrophoresis 26:1319–1333 Indrayanto G (2011) Analytical Aspects of High Performance Thin Layer
Chromatography. MM. Srivastava edn, High-Performance Thin-Layer Chromatography (HPTLC), Springer-Verlag Berlin Heidelberg Indrayanto G, Yuwono MS (2010) TLC: Validation of Analyses. In. Cazes J
Encyclopedia of Chromatography, 3rd edn, Taylor & Francis Group, London Kakde RB, Kotak VH, Kale DL (2008) Estimation of bisoprolol fumarate in
pharmaceutical preparations by HPTLC. Asian J Res Chem 1(2):70–73 Krishna Veni N, Meyyanathan SN, Reddy AA, Sompura SA, Elango K (2013)
Analysis of Vanillin In Food Products By High Performance Thin Layer Chromatography. J Adv Sci Res 4(1):48–51
Lomascolo A, Stentelaire C, Asther M, Lesage-Meessen L (1999) Basidiomycetes as new biotechnological tools to generate natural aromatic flavours for the food industry. Trends Biotechnol 17:282–289
Mabinya LV, Mafunga T, Brand JM (2006) Determination of ferulic acid and related compounds by thin layer chromatography. Afr J Biotechnol 5:1271–1273
Mabry TJ, Markham KR, Thomas MB (1970) The Systematic Identification of Flavonoids, 1st edition. Springer, New York, NY, USA
Macheix JJ, Fleuriet A, Billot J (1990) Fruit Phenolics. CRC Press, Bota Raton, FL Males Z, Medic-Saric M (2001) Optimization of TLC analysis of flavonoids and
Phenolic acids of Helleborus atrorubens Waldst. et Kit. J Pharm Biomed Anal 24(3):353–9
Olsson L, Samuelson O (1974) Chromatography of aromatic acids and aldehydes and phenols on cross-linked polyvinylpyrrolidone. J Chromatogr 93:189–199 Priefert H, Rabenhorst J, Steinbuchel A (2001) Biotechnological production of
vanillin. Appl Microbiol Biotechnol 56:296–314
Prinjaporn TN, Namthip N, Poomrat R, Weena S, Orawon C (2013) Simple and Rapid Determination of Ferulic Acid Levels in Food and Cosmetic Samples Using Paper-Based Platforms. Sensors 13:13039–13053
Raisi A, Aroujaliana A, Kaghazchia T (2008) Multicomponent pervaporation process for volatile aroma compounds recovery from pomegranate juice. J Membr Sci 322:339–348
Rakchoy S, Suppakul P, Jinkarn T (2009) Antimicrobial effects of vanillin coated solution for coatingpaperboard intended for packaging bakery products. As J Food Ag-Ind 2:138–147
Rao SR, Ravishankar GA (1999) Biotransformation of isoeugenol to vanilla flavour metabolites and capsaicin in suspended and immobilized cell cultures of Capsicum frutescens: study of the influence ofβ-cyclodextrin and fungal elicitor. Process Biochem 35:341–348
Renger B (1993) Quantitative planar chromatography as a tool in pharmaceutical analysis. J AOAC Int 76:7–13
Renger B (1998) Contemporary thin layer chromatography in pharmaceutical analysis. J AOAC Int 81:333–339
Sharma UK, Sharma N, Gupta AP, Kumar V, Sinha AK (2007) RP-HPTLC densitometric determination and validation of vanillin and related Phenolic compounds in accelerated solvent extract ofVanilla planifolia. J Sep Sci 30:3174–3180
Sostaric T, Boyce MC, Spickett EE (2000) Analysis of volatile components in vanilla extract and flavorings by solid-phase microextraction and gas
chromatography. J Agric Food Chem 48:5802–5807
Srivastava MM (2011) An Overview of HPTLC. In: A Modern Analytical Technique with Excellent Potential for Automation, Optimization, Hyphenation, and Multidimensional Applications. High-Performance Thin-Layer Chromatograpy (HPTLC), Springer-Verlag Berlin Heidelberg
Srivastava SK, Singh AP, Rawat AKS (2008) Pharmacognostical and phytochemical evaluation ofLycopodium clavatumstem. J Sci Ind Res 67:228–232 Takahashi M, Sakamaki S, Fujita A (2013) Simultaneous analysis of Guaiacol and
vanillin in a vanilla extract by using High Performance Liquid
Chromatography with Electrochemical detection. Biosci. Biotechnol. Biochem 77(3):595–600
Tilay A, Bule M, Kishenkumar J, Annapure U (2008) Preparation of ferulic acid from agricultural wastes: its improved extraction and purification. J Agric Food Chem 56:7644–8
Tilay A, Bule M, Annapure U (2010) Production of Biovanillin by One-Step Biotransformation Using FungusPycnoporous cinnabarinus. J Agric Food Chem 58:4401–4405
Van der Hyden Y, Nijhuis A, Smayers-Verbeke J, Vandeginste BMG, Massart DL (2001) Guidance for robustness/ruggedness test in method validation. J Pharm Biomed Anal 24:723–753
Wu SL, Chen JC, Li CC, Lo HY, Ho TY, Hsiang CY (2009) Vanillin Improves and Prevents Trinitrobenzene Sulfonic Acid-Induced Colitis in Mice. J Pharmacol Exp Ther 330:370–376
Xu F, Sun RC, Sun JX, Liu CF, Heb BH, Fan JS (2005) Determination of cell wall ferulic and p-coumaric acids in sugarcane bagasse. Anal Chim Acta 552:207–217
Zheng L, Zheng P, Sun Z, Bai Y, Wang J, Guo X (2007) Production of vanillin from waste residue of rice bran oil byAspergillus nigerandPycnoporus
cinnabarinus. Bioresour Technol 98:1115–1119
doi:10.1186/s40543-014-0021-6
Cite this article as:Hingseet al.:Method development for simultaneous detection of ferulic acid and vanillin using high-performance thin layer chromatography.Journal of Analytical Science and Technology20145:21.
Submit your manuscript to a
journal and benefi t from:
7Convenient online submission
7Rigorous peer review
7Immediate publication on acceptance
7Open access: articles freely available online 7High visibility within the fi eld
7Retaining the copyright to your article