Experimental Evaluation of Speci
fi
c Storage in Mudstone Considering Error
Using the Flow Pump Method
Minoru Sato
1,+, Masaji Kato
2and Manabu Takahashi
31Graduate School of Life and Environmental Science, University of Tsukuba, Tsukuba 305-8577, Japan 2Faculty of Engineering, Hokkaido University, Sapporo 060-8628, Japan
3Research Institute of Earthquake and Volcano Geology, National Institute of Advanced Industrial Science and Technology (AIST),
Tsukuba 305-8567, Japan
The evaluation of hydraulic constants is generally one of the main components of reservoir engineering projects such as the development of radioactive waste disposal sites or the construction of underground CO2storage. In the example presented here,flow pump experiments were
conducted for the Horonobe mudstone to evaluate specific storage and hydraulic conductivity. Theflow pump experiments were conducted with an effective confining pressure that gradually increased from 2 to 10 or 12 MPa, followed by a subsequent reduction to the initial value. The hydraulic conductivity in all cases was observed to decrease with increasing effective confining pressure in the specimens, and it did not recover to its initial value after unloading. In contrast, specific storage was observed to decrease in some specimens with increasing effective confining pressure; although this tendency was not significant in comparison to the trend observed concerning hydraulic conductivity. We therefore used theoretical analysis to calculate hydraulic constants and evaluate error ranges based on the nonlinear least-squares method. The error range value of specific storage is proposed to reduce with largerflow rates under the same confining pressures. The experimental results showed an almost linear pressure distribution from the upstream to downstream surfaces, and also showed a gradual increase in differential pressure with time in theflow pump method. Taking error ranges into account, theflow pump method is probably an easy approach for evaluating the specific storage of mudstone compared with other means of investigation that are currently available. [doi:10.2320/matertrans.M-M2015840]
(Received September 4, 2015; Accepted November 30, 2015; Published January 18, 2016)
Keywords: hydraulic conductivity, specific storage, error estimation,flow pump method, laboratory experiment, mudstone
1. Introduction
The evaluation of hydraulic constants is generally one of the main components of reservoir engineering projects such as the development of a radioactive waste disposal site,1)
or construction of underground CO2 storage.2) Adding the
necessity to take long-term variations of a geological environment into consideration, the careful evaluation of hydraulic constants is considered to be crucial for fully addressing relevant hydro-geological impacts in relation to environmental concerns. In the case of estimating ground water flow, two hydraulic constants are often evaluated: hydraulic conductivity and specific storage. Since there was limited reliable data available for the specific storage in the field area, measurements had to be made to introduce suitable values for specific storage before introducing them into the model for long-term ground water flow in the geological environment.
Several experimental methods have been proposed and used to obtain hydraulic constants. These methods include the transient pulse method,35)the flow pump method,69) flow
pumping under a constant downstream reservoir volume,10)
and the poroelastic method in which strain and pore fluid pressure are measured in the specimen.1113)For granite, with low hydraulic conductivity (lower than 10¹10m/s), Kato
et al.5)summarized data analyses including sensitivities based on the nonlinear least-squares method and by the aid of the transient pulse method. Songet al.10)obtained the hydraulic conductivity and specific storage of specimens by following a new flow pump measurement method under relatively constant downstream reservoir volume conditions. However, a constantflow rate from the upstream reservoir was observed
to causefluid to permeate into the specimen and the apparatus, leading to pore pressure increasing during measurements. Accordingly, the method of flow pump measurement under the constant downstream reservoir volume condition is not suitable for measurements under low effective confining pressures. Esakiet al.7)proposed an analytical solution for the
conventionalflow pump experiments that included the effects of the storage capacity of theflow pump apparatus. Tokunaga and Kameya8) also used an analytical solution for theflow pump method and conducted a theoretical analysis to evaluate errors associated with estimates of the specific storage of the specimen. Their results suggested that the ratio of the storage capacity of the apparatus to that of the specimen (¤A) should be less than 0.3 for theoretical analyses and less than 0.7 for experimental results to obtain specific storage in the specimen with sufficient accuracy. Because the Wakkanai Formation mudstone in the Horonobe area is porous (porosity of about 3040%), it is reasonable to assume that the value of¤Acan be kept low using theflow pump method.
In the present study, ground water flow for a site in the Horonobe area was modelled. Because the hydraulic conductivity of the Horonobe mudstone within the Wakkanai Formation spans a wide range (10¹14 to 10¹6m/s),14) the
flow pump method was chosen for the current study. The flow pump measurements combined with an analytical method were employed to evaluate the possibility of obtaining accurate estimates of the specific storage of the mudstone in the Wakkanai Formation by comparing error ranges. Calculations for error ranges were conducted using an analytical solution based on a nonlinear least-squares method5)to obtain the relative error. Theflow pump method
can handle wider ranges of values compared with the transient pulse method15) and therefore facilitates our
comparisons by providing the measurements.
2. Theoretical Analysis
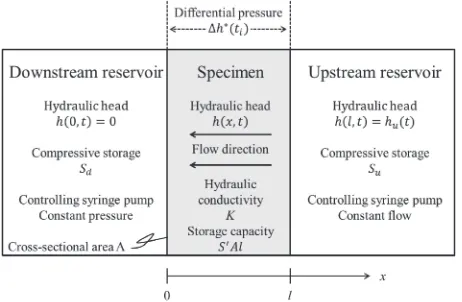
Flow pump experiments were performed by injecting distilled de-aired water at a constant rate from an upstream reservoir into the specimen using an ISCO syringe pump (100DM), and measuring the differential pressure between the top and bottom surfaces of the specimen (Fig. 1). The governing equation for one-dimensionalfluidflow through a porous medium can be written as
@h
@t
¬
S0 @2h
@x2 ¼0 ð1Þ
in whichtis time,his the hydraulic head,xis the coordinate with the origin 0 at the downstream end surface, SA is the specific storage of the specimen, and¬ represents hydraulic conductivity.xandtare independent variables in eq. (1) for which the initial condition is:
hðx;0Þ ¼0; 0xl ð2Þ
and in which lis the length of the specimen. The upstream boundary conditions are
hðl; tÞ ¼huðtÞ; t0; ð3Þ
and
Su
¬A
dhu
dt þ
@h
@x x¼l¼
Q
¬A; t >0 ð4Þ
huð0Þ ¼0 ð5Þ
where Su and hu are the compressive storage and the
hydraulic head of the upstream reservoir, respectively; Qis the constant pumping rate, andAis the cross-sectional area of the specimen. The downstream boundary condition is shown as follows:
hð0; tÞ ¼0; t0: ð6Þ
Finally, the analytical solution of eq. (1) is:7)
hðx; tÞ
H ¼²2
X1
m¼0
expð¡º2
mÞsinðºm²Þ
ºm
1þ¢þº
2 m ¢
ð7Þ
where¡, and ¢are
¡¼ ¬t
l2S0; ð8Þ
and
¢¼S0Al
Su ð9Þ
as non-dimensional parameters. The upstream (Su) and downstream (Sd) compressive storage are:
Su¼CewVu; ð10Þ
and
Sd¼CewVd ð11Þ
in which Cew is the compressibility of the apparatus as
indicated byfluidflow lines. Theºare roots to the following nonlinear equation:
tanº¼º¢: ð12Þ
In the present work, we used the analytical solution developed by Esaki et al. (1996)7) to obtain the hydraulic
conductivity and specific storage of the specimens. In the calculations for error ranges, we used the analytical solutions based on the nonlinear least-squares method.5)The hydraulic constants were determined by minimizing the residual sum of squares Sas:
S¼X
n
i¼1
hðtiÞ
H
hðtiÞ H
2
: ð13Þ
The relative errors of hydraulic constants were obtained using eq. (13) for discussing the accuracy of obtained data. Finally, the error evaluation was apparent in the value of absolute errors calculated from relative errors.
3. Experimental Procedure
3.1 Experimental equipment
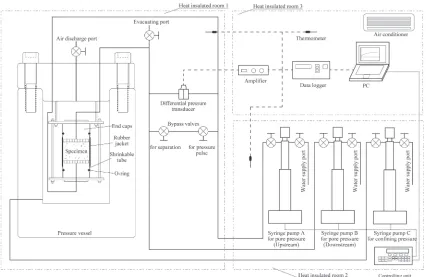
The flow pump experiments were conducted using a triaxial vessel at the National Institute of Advanced Industrial Science and Technology of Japan (Fig. 2). The mechanism of this apparatus is basically the same as that of Kato et al.5)
Three syringe pumps (ISCO, 100DM: maximum pressure of 69 MPa, controlling pressure resolution of 1 kPa, and flow range of 10¹5to 30 mL/min) were used to control porefluid
and confining pressure. This apparatus mainly consists of four systems to control pore fluid, confining pressure, and temperature along with a recording system. The control unit for confining pressure is composed of the pressure vessel (maximum pressure of 50 MPa) and syringe pump C (Fig. 2). The porefluid system comprises syringe pumps A and B, a valve for separating upstream and downstream reservoirs, andfluidflowing lines. The recording system includes a data logger, a differential pressure transducer, and sensors to measure temperature. The temperature change in the heat insulated room 1 (Fig. 2) was kept within«0.1 degree during each experiment.
The cylindrical specimen (50 mm in diameter) was geared in endpieces that were equipped with a water distribution board and O-ring. After jacketing the specimen in a heat shrinkable tube, the specimen was placed on a disk-shaped piece of metal that bolts on to the pressure vessel. The lid and specimen were then turned upside down to be set into the
Fig. 1 Schematic diagram and the boundary conditions associated with the flow pump method.
[image:2.595.55.286.71.222.2]pressure vessel. Once the above was assembled, the fluid could be supplied for the pore pressure and confining pressure tests.
Hydraulic constants were measured under isotropic stress conditions. The initial pressure for confinement was set as 4 MPa and pore pressure was kept constant at 2 MPa. Subsequently, confining pressure was incrementally increas-ed from its initial value to 10 or 12 MPa, then later returnincreas-ed again at decreased step-sizes to the initial value. Because the limit for measuring differential pressure in the transducer was 140 kPa, flow pump experiments were conducted at differ-ential pressures of less than 100 kPa to secure soundness of the equipment. Note that hydraulic constants were measured at each stage of the experiment.
3.2 Evaluation of the storage capacity of the apparatus
Because theflow pump experiments depend on the storage capacity of both the apparatus (Su) and the specimen, it is
necessary to discriminate between each type of storage to obtain an accurate estimate of the specific storage. Thus, it is better that the storage capacity of the apparatus is as small as possible.79) A calibration test was conducted using an
impermeable brass specimen to determine the storage capacity of the apparatus before doing hydraulic conductivity measure-ments. To do this, the storage capacity of the apparatus was obtained by measuring differential pressure changes with time under constantflow conditions, which is shown by:
SuþSd ¼ Q
h
t
ð14Þ
Both of the syringe pumps had volume of 10 mL. It should be emphasized that the same systems were used for the
upstream and downstream reservoirs and for adjusting the length of fluid flow lines; furthermore, it was assumed that Su=Sd. Considering the aforementioned condition, a
value of 2.34©10¹10m2was ultimately found for S uin this
study.
3.3 Specimen description
As briefly described earlier, core samples of mudstone from the Wakkanai Formation in the Horonobe area located in northern Hokkaido, Japan, were extracted for the experi-ments. The cores were obtained from borehole HDB4, previously drilled in the area by Japan Atomic Energy Agency.16)Afterward, cylindrical specimens from the blocks were prepared in the laboratory using a diamond coring machine. The specimens had lengths ranging from 2025 mm and a diameter of 50 mm, and were given the names HDB4-H223, V291, H291, H374 and H466. HDB stands for Horonobe Deep Borehole, and the numeral suffix (4 in this case) represents the site number. H and V stand for horizontal and vertical to the bedding plane, respectively, and the accompanying number refers to the depth of sampling (m). However, we used the intact specimen H374 as it was the only one with visible fractures (Fig. 3). The previously mentioned mudstone was chosen as a control measure as there are numerous reports available on the hydraulic conductivity of such rock, thus enabling an assessment of the reliability of measurements by comparing them with the previous work.
In subsequent stages, the porosity and pore size distribu-tions of the specimen were obtained using mercury intrusion porosimetry (Fig. 4). Thefigure depicts pore volume per unit volume of the specimen in the vertical axis versus the logarithm of pore radii. All of the specimens had similar
[image:3.595.86.512.68.345.2]bimodal frequencies. The porosity of the specimen from 223 m is less than that of the specimen from 291 m. The porosity in other specimens tended to decrease with depth.
4. Experimental Results
4.1 Measurement accuracy
At larger flow rate values, the equilibrium pressure increases. This can result in better measurement accuracy, because the equilibrium pressure highly exceeds the assemblage resolution. We conducted hydraulic measure-ments of HDB4H291, and H374 under various flow rate conditions to investigate the differences in measurement accuracy resulting from differential flow rate conditions (Table 1). For the same pressure conditions, there was a proportional relationship between flow rate and equilibrium
pressure, as also could be shown with Darcy’s Law. Because the limit for measuring differential pressure in the transducer was 140 kPa, theflow pump experiments were conducted at differential pressures of <100 kPa to ensure that the equip-ment would not fail. For instance, because thefirst measure-ment was conducted under conditions in which effective confining pressure was 6 MPa and Q=0.5 µL/min, the equilibrium pressure was 41.4 kPa. The second and third measurements were conducted based on Q=10 and 11 µL/min, for which the equilibrium pressures were 78.5 and 90.7 kPa, respectively. Comparison of the equilibrium pressure under each pressure condition revealed that the error range value for the specific storage decreased as the flow rate increased. Then, the error range values of hydraulic conductivity were less than 1/10 of obtained hydraulic conductivity of the specimen.
Fig. 3 Photograph of specimen H374. Visible fractures are seen in the specimen. Nevertheless it is considered independent. Labels 62.5 and 65 mean that this specimen was cored from 374.625374.650 m.
[image:4.595.320.535.70.255.2]Fig. 4 Total porosity and pore size distribution of mudstones with mercury intrusion porosimetry.
Table 1 Experimental results of HDB4-H374 under a differentflow rate conditions.
effective confining pressure
(MPa)
flow rate Q(µl/min)
equilibrium pressure
(kPa)
hydraulic conductivity
K(m/s)
error range ofK (m/s)
Specific storage SA(1/m)
error range ofSA (1/m)
ratio of the storage capacity
¤A
2 50 26.0 3.89©10¹9 1.70©10¹10 2.94©10¹5 2.63©10¹5 0.32
2 100 52.8 3.82©10¹9 1.20©10¹10 2.17©10¹5 2.02©10¹5 0.44
2 150 82.4 3.68©10¹9 1.06©10¹10 1.62©10¹5 1.98©10¹5 0.59
4 10 24.8 8.13©10¹10 4.48©10¹11 2.38©10¹5 1.41©10¹5 0.40
4 20 50.2 8.05©10¹10 2.84©10¹11 2.55©10¹5 1.05©10¹5 0.37
4 30 76.4 7.93©10¹10 1.97©10¹11 2.41©10¹5 8.79©10¹6 0.38
6 5 41.4 2.44©10¹10 1.52©10¹11 2.46©10¹5 1.06©10¹5 0.39
6 10 78.5 2.57©10¹10 1.14©10¹11 2.96©10¹5 9.24©10¹6 0.32
6 11 90.7 2.45©10¹10 6.33©10¹12 2.54©10¹5 5.18©10¹6 0.40
8 2 56.1 7.20©10¹11 2.95©10¹12 2.61©10¹5 7.78©10¹6 0.36
8 3 87.2 6.95©10¹11 1.86©10¹12 2.74©10¹5 6.84©10¹6 0.35
6 2 53.2 7.58©10¹11 4.53©10¹12 3.10©10¹5 1.13©10¹5 0.31
6 3 79.9 7.58©10¹11 2.31©10¹12 3.32©10¹5 9.17©10¹6 0.29
4 1 26.5 7.61©10¹11 8.36©10¹12 3.23©10¹5 1.99©10¹5 0.29
4 2 50.5 8.00©10¹11 3.48©10¹12 2.56©10¹5 1.03©10¹5 0.37
4 3 77.1 7.86©10¹11 1.89©10¹12 2.66©10¹5 6.88©10¹6 0.36
[image:4.595.90.248.90.228.2] [image:4.595.45.551.312.564.2]4.2 Hydraulic conductivity
The initial permeability values for different specimens at the effective confining pressure of 2 MPa ranged from 10¹8
to 10¹12m/s. The results of hydraulic conductivity versus effective confining pressure and error range bars are shown in Fig. 5. This figure was constructed using the most accurate measurements of differential flow rate conditions shown in Table 1, i.e., the results with the smallest error ranges. The error bars for hydraulic conductivity are small enough to be hidden within the points plotted on the figure. Hydraulic conductivity was observed in all specimens to decrease with increasing effective pressure. After unloading, hydraulic conductivity did not recover to its initial value even at the lowest effective confining pressure. As stated above, H374 had a visible fracture, and its hydraulic conductivity was higher than those of other specimens.
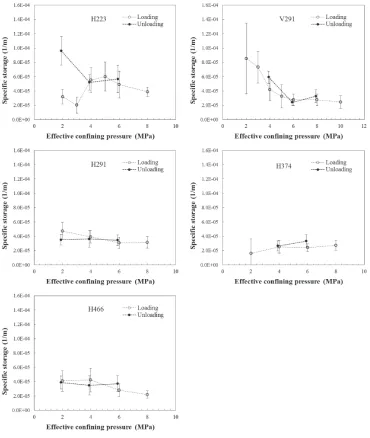
4.3 Specific storage
Figure 6 shows the specific storage of the specimen plotted under effective confining pressure conditions. Just like for the hydraulic conductivity results, for the differential flow rate condition measurements shown in Table 1, the results with the smallest error range (i.e., the most accurate) were used in the figure. For the case of low effective confining pressures, the specific storage error range had relatively large values. For example, with 8 MPa of effective confining pressure, all error ranges for specific storage were below «1©10¹5m¹1. The specific storage in V291, H291
and H466 was observed to decrease with increasing effective confining pressure, although this tendency was not significant in comparison to the trends in hydraulic conductivity. Accordingly, no meaningful relationship could be drawn between the specific storage of specimens and the porosity measured by mercury intrusion porosimetry. After unloading, the specific storages of H223 and V291 increased about 4©10¹5m¹1; however, there were seldomfluctuations in the values regarding other specimens. Hydraulic conductivity values for H374, with its visible fracture, decreased with increasing effective confining pressure, while the specific storage was almost constant at all of the effective confining pressure conditions.
5.1 Error evaluation of the hydraulic constants
The stress dependency of hydraulic constants for mudstone has been extensively reported.13,14,17,18) Due to changes in hydraulic constants with effective confining pressure, which can be orders of magnitude in size, measurements of such changes at different pressures are of specific importance. In recent years, more attention has been given to the hysteresis observed in hydraulic constants and effective confining pressure of mudstones. Hydraulic conductivity decreases as pressure increases. Then, during the unloading process, there is almost no recovery in the mudstone permeability. Because the volumetric change with pressure in mudstone is related to consolidation history, hydraulic conductivity will not return to its initial value during unloading if the effective confining pressure is higher than that experienced during the rock’s consolidation history. In the present study, we obtained these trends for hydraulic conductivity with accurate data and a small error range (Fig. 5). However, as the sensitivity of specific storage is less than that of hydraulic conductivity, the accuracy of the specific storage determination is generally poorer than that of hydraulic conductivity.5,8)The values of specific storage taken fromin-situexperimental data are not useful for numerical simulation due to their low accuracy. In the laboratory experiment, Tokunaga and Kameya8) suggested that the ratio of the storage capacity of the apparatus to that of the specimen (¤A) should be<0.3 based on theoretical analysis and <0.7 based on experimental results to obtain the specific storage in the specimen with sufficient accuracy. Storage capacity of the apparatus used in this study was 2.34©10¹10m2, and¤Awas found to be 0.3 for
the specific storage for a specimen at 3.0©10¹5m¹1with a
length of 25 mm and a diameter of 50 mm. When the value of specific storage of the specimen is <3.0©10¹5m¹1, ¤A is
>0.3. All of the values obtained for¤Awere smaller than 0.7 (Table 1), satisfying the required accuracy from the exper-imental results. Because the storage capacity of a mudstone with about 30%porosity is comparatively large, it was come to light that specific storage can be calculated accurately by theflow pump method.
There are two ways to minimize the error range in determinations of specific storage for theflow pump method. The first is using a bigger specimen to increase the specific capacity of specimen. However, it is difficult to make bigger specimens due to limitations regarding the pressure vessel volume, sampling core size and disturbance. The second is to increase the flow rate to raise the equilibrium pressure. Increasing the equilibrium pressure means the differential pressure is higher than pressure resolution of the assemblage and increasing measurement time in reaching a steady state in applying differential pressure. Comparing each pressure condition in the equilibrium state, note that the error range of the specific storage was reduced as theflow rate increased. There is one problem with increasing theflow rate®a larger differential pressure between the upstream end face of the specimen and its downstream end surface. The hydraulic head distribution of time-dependent change during theflow pump experiment, which was calculated using eq. (7), is shown in Fig. 7. We divided a specimen into five equal sections that
[image:5.595.61.277.64.241.2]formed downstream end surfaces at 0.0 L, 0.2 L, 0.4 L, 0.6 L, 0.8 L, and 1.0 L in elevation (upstream end surface) where L is the length of each specimen. Figure 7 also shows the pressure propagating from upstream to downstream end surfaces almost equally. When the equilibrium pressure was 100 kPa at a 25 mm specimen length, the differential pressure was suppressed at 4 kPa per 1 mm. This issue can possibly be attributed to the fact that the transient pressure damages specimens by deformation and/or clogging offluidflow lines with clay particles, as these are common problems when using the transient pulse method. However, the differential pressure caused by theflow pump method gradually increased as time advanced. Theflow rate was increased using the conventional flow pump method to improve the accuracy of specimen’s specific storage determination. Hence there is no need to measure strain in the specimens, thereby leading to fewer time demanding procedures.
5.2 Specific storage of the Horonobe mudstone from the Wakkanai Formation
In an experiment that used the same mudstone that is
examined in the current study, the transient pulse method determined that the specific storage ranged from 1.1©10¹5
to 4.3©10¹5m¹1 for effective confining pressures of 1 to Fig. 7 The hydraulic head distribution of time-dependent change during theflow pump experiment. The specimen was analytically divided into five equal sections which are determined to from downstream end surface 0.0 L to 0.2 L, 0.4 L, 0.6 L, 0.8 L, 1.0 L (upstream end surface) where L is the length of each specimen.
Fig. 6 Specific storage for specimens versus effective confining pressure.
[image:6.595.114.484.68.506.2] [image:6.595.312.542.537.675.2]the measured values in our study fell to between 2.0©10¹5
and 6.0©10¹5m¹1, in agreement with previous work. Hence
it was concluded that the specific storage of the specimen was related to the porosity, as increasing the effective confining pressure generally causes a reduction in porosity and specific storage. Previous studies based on calculations related to porosity changes with pressure in mudstone suggest that the specific storage of a sample decreases as the effective confining pressure increases.13) Our specific storage results
for samples V291, H291 and H466 also showed slight decreases with increasing effective confining pressure (Fig. 6). The trend of decreasing specific storage with increasing effective confining pressure conforms to the theory of poroelasticity. The specific storage of a porous medium can be determined to be12)
S0¼μfg¡
KB ; ð15Þ
in which μf is the density of the pore fluid, g is the
gravitational acceleration,¡is the BiotWillis parameter,Kis the bulk modulus at the drained states andBis Skempton’sB
coefficient. The values ofKand effective confining pressure
have a positive correlation. It is generally true that decreasing specific storage corresponds to increasing effective confining pressure. In the cases of samples H223 and H374, however, the values of specific storage at low effective confining pressures (23 MPa) are lower than that at high effective confining pressures (48 MPa). It is likely that these problems resulted from the stiffness of the heat shrinkable jacketing tube as opposed to the elasticity of mudstones and/or small temperature fluctuation during the experiment. One way to improve the measurement of hydraulic constants is by using a soft jacket such as silicone lubber, thereby preventing seepage between the specimen and heat shrinkable tube. In addition, this error range can be minimized by considering the value of theflow rate.
6. Conclusions
The purpose of this study was to evaluate the specific storage of mudstone including error using the flow pump method, a technique that is generally thought to be able to handle wider ranges than the transient pulse method. First, background information was considered that set the stage for the theoretical analysis for calculating hydraulic constants and evaluating error ranges based on the nonlinear least-squares method. Following that, flow pump experiments for the Horonobe mudstone were conducted with the effective confining pressure gradually increasing from 2 to 10 or 12 MPa, with subsequent unloading to the initial value. The hydraulic conductivity was observed in all cases to decrease with increasing effective pressure in the specimens, and after unloading, the hydraulic conductivity did not recover to its initial value. Generally, specific storage decreased with increasing effective confining pressure, although this ten-dency was not significant when compared to the similar trend for hydraulic conductivity. The error range in specific storage determinations was observed to be reduced at higher flow rates considering the similar condition for pressure. The
equally from the upstream to downstream end surfaces and that the differential pressure developed by the flow pump method gradually increases as time advances. The ratio of the storage capacity of the apparatus to that of the specimen (¤A) should be <0.3 for theoretical analysis and <0.7 for experimental results to obtain a sufficiently accurate specific storage in the specimen. All of ¤A values that we obtained were <0.7, which showed sufficient accuracy in the experimental results. Because the storage capacity of a mudstone with about 30% porosity is comparatively large, it was determined the specific storage can be calculated accurately by the flow pump method. At an effective confining pressure of 8 MPa, the error ranges for the specific storage were all below «1©10¹5m¹1, which supports the
higher reliability of theflow pump method for assessments of specific storage in mudstone.
Acknowledgements
Thefirst author would like to express deepest appreciation to his supervisor, Ryo Anma for outstanding guidance, considerable encouragement and invaluable discussions during his research work at Tsukuba University. Kamran Panaghi significantly improved the English manuscript; his interactions as a visiting scholar at Nihon University are very much appreciated.
REFERENCES
1) A. W. Miller and Y. Wang:J. Environ. Sci. Technol.46(2012) 1981 1994.
2) J. Song and D. Zhang:Environ. Sci. Technol.45(2013) 922.
3) C. E. Neuzil, C. Cooley, S. E. Siliman, J. D. Bredehoeft and P. A. Hshieh:Int. J. Rock. Mech. Min. Sci. Geomech. Abstr.18(1981) 253 258.
4) M. Zhang, M. Takahashi, R. H. Morin and T. Esaki:Geotech. Test. J. 23(2000) 9199.
5) M. Kato, M. Takahashi and K. Kaneko:J. MMIJ129(2013) 472478.
6) R. H. Morin and H. W. Olsen:Water Resour. Res.23(1987) 1461 1470.
7) T. Esaki, M. Zhang, A. Takeshita and Y. Mitani:Geotech. Test. J.19 (1996) 241264.
8) T. Tokunaga and H. Kameya:Int. J. Rock. Mech. Min Sci.40(2003) 739745.
9) H. Kameya and T. Tokunaga:J. MMIJ119(2003) 508513.
10) I. Song, S. C. Elphic, I. G. Main, B. T. Ngwenya, N. W. Odling and N. F. Smyth:J. Geophys. Res.109(2004) B05207.
11) D. J. Hart and H. F. Wang:Int. J. Rock. Mech. Min. Sci.38(2001) 577583.
12) T. Tokunaga, R. Aoyagi, K. Mogi, H. Kameya and H. Tosaka:J. Japan Soc. Eng. Geol.42(2001) 208213.
13) W. Tanikawa, T. Shimamoto, S.-K. Wey, C.-W. Lin and W.-C. Lai:
J. Geophys. Res.113(2008) B12403.
14) S. Uehara, T. Shimamoto, K. Okazaki, H. Funaki, H. Kurikami, T. Niizato and Y. Ohnishi:Int. J. Rock. Mech. Min. Sci.56(2012) 114.
15) W. Lin, M. Takahashi, T. Hirono and T. Sasaki:J. MMIJ119(2003) 519522.
16) Japan Atomic Energy Agency: Report, (2003) TJ5420 2004-004, pp. 1-11-10.
17) T. Kawamura, M. Kato, M. Takahashi and K. Kaneko: Proc. MMIJ Annual Meeting, Vol. I (2004) pp. 8990.