Cell Attribute-Based Algorithm for Crack Visualization
Ruslan Pacevič, Arnas Kačeniauskas
Laboratory of Parallel Computing, Vilnius Gediminas Technical University Saulėtekio Ave. 11, Vilnius, LT-10223, Lithuania
e-mail: [email protected]
Remigijus Kutas
Department of Information Systems, Vilnius Gediminas Technical University, Saulėtekio Ave. 11, Vilnius, LT-10223, Lithuania
e-mail: [email protected]
Darius Markauskas
Institute of Mechanics, Vilnius Gediminas Technical University Saulėtekio Ave. 11, Vilnius, LT-10223, Lithuania
Lukas Radvilavi
čius
Laboratory of Security of Information Technologies, Vilnius Gediminas Technical University Saulėtekio Ave. 11, Vilnius, LT-10223, Lithuania
http://dx.doi.org/10.5755/j01.itc.42.3.2575
Abstract. The paper presents the development of the visualization algorithm for propagating cracks. The novel algorithm is based on the cell attribute obtained from the damaged lattice connections employed for discrete element computations of mono-dispersed particulate media. Generation of the cells is efficiently performed by using the positions of particles and the lattice connections. The developed visualization algorithm is implemented in the distributed visualization software VisPartDEM. The efficiency of the software is tested visualizing the datasets resulting from computations of the lattice-based discrete element method. The performance of the developed algorithm is compared with that of the visualization algorithms based on the Voronoi diagrams and the inscribed spheres.
Keywords: visualization; cracks; cell atribute; distributed software vispartdem; discrete element method.
1. Introduction
The discrete element method (DEM) was proposed by Cundall in the context of rock mechanics [1] and has been implemented in many other fields, such as geo-materials, granular materials and concrete [21]. It is a fast emerging computational method designed to solve problems with discontinuous materials and geometrical behaviour. Several different particle- and lattice-based approaches have been developed in the frame of DEM. Particle-based approach [11][20] assumes the particle elements are rigid spheres or discs, which can overlap or detach. The contact forces
Discrete element computations are based on the positions of particles, forces acting between them, and Newton’s laws. Particle systems have no permanent connections or usual grid that can be applied for spatial discretization or visualization purposes [5]. The defects are identified between the pairs of the neighbouring particles on the lattice connections or bonds [9][16]. The one-dimensional connections are not well suited for the reliable interpolation and common visualization techniques in 2D or 3D. Moreover, there is no direct technique how to visualize the crack geometry according to the individual defects. Thus, the main visualization task is to identify the fractured regions and to define the cracks from the broken lattice connections and the geometry of the neighbouring particles.
The novel cell attribute-based algorithm is proposed for visualization of cracks in mono-dispersed particulate media. The proposed cell generation algorithm employs the one-dimensional lattice connections as the edges of the newly generated cells. The visualization algorithm maps broken lattice connections to generated cells. In this case, spatial crack representation is visualized as the scalar cell attribute. The paper is organised as follows. In Section 2, the related work is discussed. Section 3 presents the developed algorithm for visualization of cracks. In Section 4, the main features of employed visualization software are described. In Section 5, visualization issues and performance of the software are discussed, while the concluding remarks are given in Section 6.
2. Related work
The surface reconstruction from a set of sample points is motivated by numerous applications and has always been a popular field of research. Most surface reconstruction methods roughly fall into two categories: implicit surface methods [17] and Delaunay-based methods [3]. Widely accepted are the results given by Delaunay tetrahedrization, whose implementation is also included into the various numerical libraries [3]. An approach, which directly extracts smooth surfaces from unstructured point-based volume data without prior resampling or mesh generation, is proposed by Rosenthal and Linsen [17]. However, the common surface extraction algorithms cannot be directly applied because of the absence of suitable field data and the complex nature of crack surfaces including the holes.
In the lattice-based DEM methods, cracks and the related phenomena are often visualized in the most straightforward way. The geometry of large cracks can be simply visualized by positions of coloured particles [7][16], but this technique is unsuitable for the initial stages of crack formation. The coloured lattice connections [10] can be treated as the main alternative to the rendered particles. However, the coloured lattice connections do not provide any valuable information on the geometry of the crack surfaces. The proposed
visualization technique is based on the space tessellation. Traditional Delaunay [19] or advancing front [12] mesh generation algorithms cannot be applied, because the mesh geometry is already available from particle positions, while the mesh topology should be consistent with the lattice connections. Thus, there were no attempts to visualize the crack surfaces by using the cell attributes.
3. Visualization algorithm
The simple cell attribute-based algorithm is designed for visualization of propagating cracks that can be treated as the dynamically changing indirectly defined surfaces. The developed visualization algorithm generates 2D or 3D meshes from the provided 1D connections. It also maps the defects identified by the broken lattice connections to the cell attributes of the generated mesh cells.
The general scheme of the algorithm is presented in Figure 1. Initially, the dataset is read by using a nearly standard reader. The cell attribute-based algorithm consists of two main blocks that can be implemented in software as one or several filters. The first block generates the mesh topology from 1D connections of the lattice employed in DEM computations. It is the most time consuming procedure, which is performed only once. Usually, cells are generated before visualizing the results of the first time step. Sometimes the mesh topology can be imported from the non-standard DEM computations employing the mesh for the specific computational purposes [9]. The second block calculates the cell attributes from the broken lattice connections. The algorithm simply calculates how many 1D connections of the particular cell are broken and assigns this value to the cell attribute. Finally, the calculated cell attributes are mapped to the predefined colours and rendered on screen by using the available mapper and the renderer, respectively.
Generation of the cells, covering the whole domain of interest, is the most time consuming procedure. The common mesh generation algorithms cannot be applied, because of very different input data. The mesh points are already available from the particle positions. Moreover, the one-dimensional lattice connections should be employed as the edges of the newly generated cells. The initial algorithm for generating the topology was based on loops that check all neighbouring nodes and all possible variants. Its performance was found to be satisfactory visualizing the two-dimensional datasets. In the case of the 3D datasets, its execution time was very long. Thus, an improved algorithm based on the point sets was designed.
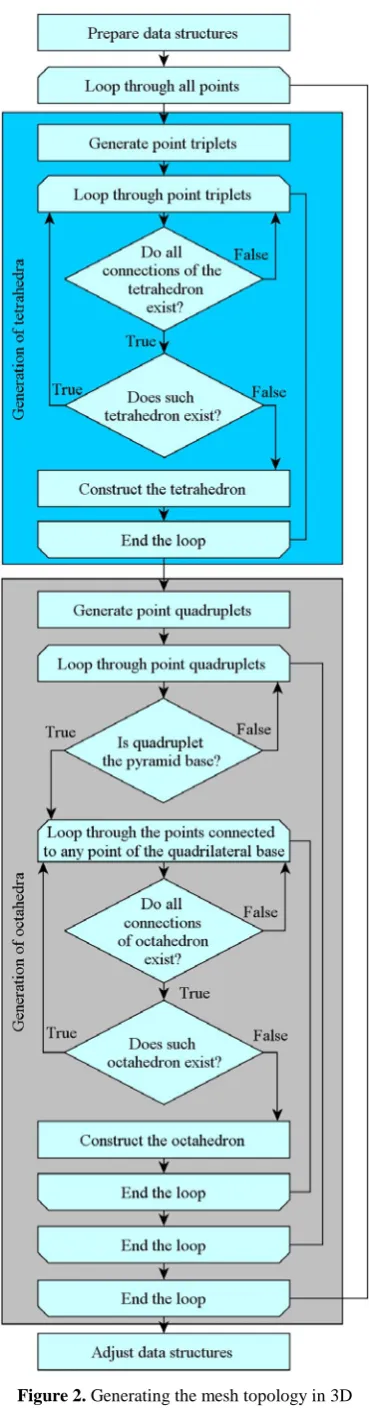
Figure 2 presents the improved algorithm designed for generating the three-dimensional mesh topology. During the preparation of data structures the lists of the connected neighbours are assembled for all lattice points (particles). Then a loop, running through all points, is started. In 3D, two types of cells are considered to cover wider range of computational lattices. Thus, the generated 3D topology consists from pyramids with triangular or quadrilateral bases, which are generated in separate blocks of the algorithm. In order to speed up computations, the point triplets and the point quadruplets are generated for identifying all possible triangular or quadrilateral bases, respectively. The following loop runs through the generated point triplets or point quadruplets connected to the processed point. The important condition checks the existence of the connection between points of the triplet forming the base of the pyramid. In the case of a pyramid with a quadrilateral base, this condition is more complex, because it is necessary to check the absence of the diagonals of the quadrilateral base. Moreover, this case is significantly more sophisticated, because resulting octahedron with eight faces can be divided to two pyramids in different ways. Thus, the additional loop, running through the points connected to any point of quadrilateral base, is performed to find the whole octahedron. The following condition checks the existence of the necessary octahedron connections. Finally, in both cases, the main block creates the new cells if such tetrahedron or octahedron has not been created yet. The octahedron is immediately divided into two pyramids with the quadrilateral base, because they can be efficiently processed by any visualization software.
Let N= {q1, q2, q3,…, qn} be a finite set of points, represented by centres of particles, in a sub-domain Ω of the space R3. The algorithm generatesa partition of the sub-domain Ω into the non-overlapping regions Ωi, such that
Ωi=
Ω (1)
where each Ωi is the 4 node tetrahedron or the pyramid defined by 5 nodes of N. Initially, the gene-rated tetrahedra satisfy the Delaunay conditions. Four
tetrahedron D if and only if there exists a location
x∈Ω, which is equally close to qi, qj, qk and ql and closer to qi, qj, qk , ql than to any other pm∈N. The location x is the centre of the sphere which passes through the points qi, qj, qk , ql and which contains no other points pm∈N. However, after some period of time the particles move, the lattice deforms and tetrahedra do not satisfy the Delaunay conditions in the highly fractured regions.
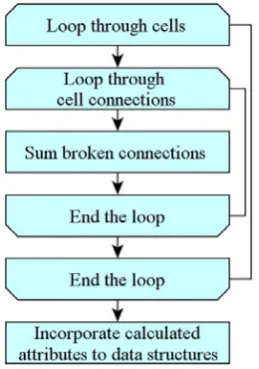
The calculation of the cell attributes from the broken lattice connections is illustrated in Figure 3. The input array (S(i), i=1, …, M) indicates if the lattice connection between two neighbouring particles
Figure 3. Computing the cell attributes
is broken. M is the total number of the lattice connections. The unity value of the array element means that the connection is broken. The algorithm calculates how many 1D connections of the particular cell e are broken by using a simple formula:
∑
==
kj e
S
I
j
a
1
))
(
(
(2)where ae is the attribute of a cell Ωefrom formula (1).
k is the number of cell connections. I is the array of global connection indices of the cell e. In Figure 3, the outer loop runs through all cells of the newly generated mesh, while the inner loop runs through all connections (edges) of the considered cell. The following block implements the trivial sum of the formula (2). The calculated value is assigned to the array of the cell attributes. Finally, the array of the calculated attributes is incorporated in data structures. At the end of the visualization pipeline (Figure 1) the calculated cell attributes are mapped to colours by using the predefined lookup table.
4. Visualization software
The developed algorithm was implemented in the distributed software VisPartDEM developed for
visualization of discrete particle systems at the Laboratory of Parallel Computing of Vilnius Gediminas Technical University. Initially, the distributed architecture of VisPartDEM was designed for grid infrastructures built by gLite middleware [4]. Client software including a GUI and a Remote Viewer was downloaded by using Java Web Start technology. VisPartDEM client, implemented as Java application, connects to any user interface computer by means of JSCH library [6]. Traditional gLite commands for user authentication and authorization, job submission and monitoring were enwrapped by Java programming language. Parallel visualization engine of VisPartDEM based on VTK [18] was run on working nodes of any computing element while the compressed video stream was transferred from the zero MPI node to the client by the Remote Viewer [8]. This architecture was extended to support the other infrastructures, such as Rocks clusters and graphics workstations.
Figure 4. Interactivity of the Remote Viewer
The Remote Viewer (Figure 4) of VisPartDEM employed GVid software [13] as video streaming module to provide users with the high interactivity level. As a result, the video stream was transferred through the network from the working node and displayed on the client. Thus, remote user had interactivity provided by the Remote Viewer based on GVid software and VTK widgets.
5. The performance of the algorithm
The developed cell attribute-based algorithm is applied to visualize crack propagation in mono-dispersed particle media. The employed lattice-based discrete element model [16] is able to describe the elastic solid problem exhibiting non-uniform distribution of fracture force values. The uniaxial tension problem was investigated to validate the relevance and accuracy of the employed model and visualization algorithm.
assumed to be clamped by connecting it to rigid walls, while other boundaries are free. External excitation is kinematic and it is implemented via the motion of the clamped boundaries defined by the constant velocity (u = 0.05 m/s) to simulate tension in the specimen with the dimensions of 0.376 x 0.107 m. The simulated system consists of 4679 particles, while the lattice is formed from 13722 springs that are treated as the 1D connections visualizing the obtained results. The initial defect, specified by 3 broken connections, is marked by using a red colour (Figure 5).
Figure 5. Geometry and lattice of the 2D benchmark
To validate the proposed algorithms for the 3D problem, the crack propagation in 3D specimen (0.211 x 0.1 x 0.1 m) was visualized. As in the 2D problem, the tension was applied via the prescribed velocity (u = 0.025 m/s) of the clamped boundaries. The particulate specimen consists of 46875 particles, while the lattice is formed from 267674 springs. The initial defect is placed at the middle of one specimen side. The benchmark tests were performed on an HP xw4600 workstation (C1) and the ordinary personal computer (C2) to validate the computational performance of the cell attribute-based algorithm. Hardware characteristics of the first computer (HP xw4600 named C1) are listed below: Intel® Core2Quad Q9450 2.66 GHz CPU (12 MB L2 cache and bus frequency equal 1333 MHz), 8 GB DDR2 800 MHz RAM, 2x250 GB HDD (SATA II Extensions and 16 MB cache), Nvidia GeForce GTX560 Ti (384 CUDA cores, 1645 MHz processor clock, 822 MHz graphics clock, 1024 MB GDDR-5, 4008 Gbps memory clock, 128 GB/sec memory bandwidth) GPU. Hardware characteristics of the second computer (the personal computer named C2) are listed below: Intel® Core2Quad Q6600 2.40 GHz CPU (2 x 4 MB L2 cache and bus frequency equal 1066 MHz), 320 GB HDD (SATA II Extensions and 16 MB cache), 4 GB DDR2 800 RAM and Nvidia GeForce 9800GTX+ (128 CUDA cores, 1688 MHz processor clock, 738 MHz graphics clock, 512 MB GDDR-2, 1100 Gbps memory clock, 47.2 GB/sec memory bandwidth) GPU.
Figure 6 presents visualization of cracks performed by the cell attribute-based algorithm in 2D. The lattice connections represented by coloured tubes are plotted for illustrative purposes. A red tube indicates that the corresponding lattice connection is already broken and the force coupling neighbouring particles is equal to zero. Cracks are visualized by colour mapping of the calculated cell attributes on the generated triangles (1). The predefined colour table is employed for relevant visualization of the investigated phenomenon. The cells coloured in blue do not
contain cracks, which indicates zero values of the cell attribute calculated by the formula (2). The triangles including only one broken connection are coloured in cyan. The cells that have two broken connections are coloured in yellow. It means that crack cuts the cell. The triangles coloured in red contain the branching crack, because all edges of the cell are broken and the investigated region is highly fractured.
Figure 6. Visualization of the lattice and cracks in 2D
Figure 7 shows crack propagation in 3D. In this case, the colour mapping is more sophisticated, because the generated topology contains two types of cells, i.e. pyramids with triangular or quadrilateral bases. The 3D cells that do not contain the broken connections are extracted by the filter vtkExtractCells. Pyramids containing small defects, i.e. one or two broken connections, are coloured in cyan. The yellow colour represents the cells containing 3 or 4 broken connections, which illustrates the cells cut by the crack surface. The red pyramids, containing more than 4 broken connections, indicate the highly fractured regions of material. The crack propagating upwards from the specimen bottom, damaged by the initial defect, can be clearly observed in Figure 7.
Figure 7. Visualization of cracks in 3D
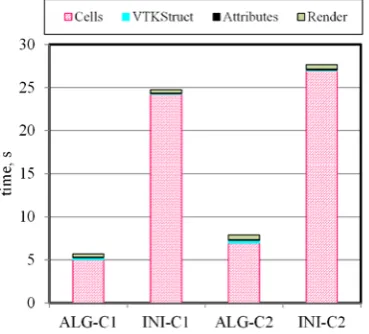
quantitative comparison of the 3D benchmark time obtained by using two different modifications of the cell generation algorithm. The columns INI represent the results of the initial algorithm while the columns ALG represent that of the improved algorithm based on the point sets. The improved algorithm for generating the 3D topology was 4.85 and 3.89 times faster than the initial algorithm on C1 and C2, respectively. The HP workstation generated the cells up to 27.9% faster. It can be explained by larger CPU clock speed and larger memory cash. The time consumed by attribute calculation, VTK data structures and rendering is small and hardly observable in Figure 8. However, these visualization procedures consumed up to 12.4% of the benchmark time in the case of the improved algorithm for generating the 3D topology.
Figure 8. Contribution of different visualization procedures to the total benchmark time
The performance of the developed visualization algorithm is quantitatively compared with that of the visualization techniques based on the inscribed spheres and the Voronoi diagrams, which are implemented in the Voro++ library [15]. Alternatively, the space can be partitioned into Voronoi cells to plot cracks on the Voronoi faces. The space partition can be obtained inscribing the spheres in the cells and joining their centres. The resulting partitions can be employed for crack visualization as well as treated as the alternatives to the cell attribute-based algorithm. Figure 9 shows the accumulated time consumed by the visualization filters based on different space partition methods visualizing the six time steps of the 3D benchmark. The curves INI-C1 and INI-C2 represent the performance of the initial algorithm, which checks all neighbouring nodes, measured on the HP workstation C1 and on the personal computer C2, respectively. The curves ALG-C1 and ALG-C2 illustrate the performance of the improved algorithm for generating the cells obtained on the C1 and on the C2, respectively. The curves VOR-C1 and VOR-C2 show the performance of the algorithm for generating the Voronoi diagrams, while the curves INS-C1 and
INS-C2 represent the performance of the algorithm for generating the space partition, based on the inscribed spheres, measured on the C1 and the C2, respectively.
Figure 9. Increase of the total execution time consumed by the different visualization techniques
Despite the fact that the Voronoi diagrams-based algorithm generates new vertices together with the desired topology, its performance is very close to that of the improved algorithm for generating the cells for the first time step. However, the positions of particles change in time as well as the vertices of the Voronoi diagrams that should be generated for each time step. In the contrary, the lattice topology is constant in time as well as the cells generated for cell attribute-based visualization. Thus, employing the cell attribute-based algorithm for crack visualization the cells should be generated only once. The attribute mapping takes negligible time as can be seen from the nearly constant curves in Figure9 and the columns of Figure8. The space partitioning method, based on the inscribed spheres, also generates the mesh topology only once, but it needs to update the coordinates of all vertices at the each time step. Thus, the accumulative time of the filters, represented by the curves INS-C1 and INS-C2, slightly increases. It is evident that the generation of the cells impressively outperforms the generation of the Voronoi diagrams after several time steps. The measured difference between the execution time of the cell attribute-based algorithm and that of the inscribed spheres-based algorithm also increases in time. In the most of DEM computations, hundreds of thousands and millions of time steps should be performed, therefore, the cell attribute-based algorithm has the superior performance.
6. Conclusions
generation of cells took up to 87.6% of the total benchmark time. The quantitative comparison of the computational performance revealed that the generation of the cells significantly outperformed the generation of the Voronoi diagrams and the space partition based on the inscribed spheres for the time-dependent crack propagation. The main advantage of the cell attribute-based visualization technique is very simple and fast computation of the required attribute. The distributed software VisPartDEM, employing the implemented cell-based algorithm, was able efficiently to visualize the cracks propagating in mono-dispersed particulate media.
Acknowledgement
The research is supported by the Ministry of Education and Science of the Republic of Lithuania through the project “Research and development of technologies for virtualization, visualization and security e-services” (VP1-3.1-ŠMM-08-K-01-012).
References
[1] P. A. Cundall, O. D. L. Strack. A discrete numerical model for granular assemblies. Geotechnique, 1979, Vol. 29, No.1, 47–65.
[2] G. Cusatis, Z. P. Bazant, L. Cedolin. Confinement-shear lattice CSL model for fracture propagation in concrete. Computer Methods in Applied Mechanics
and Engineering, 2006, Vol. 195, No.52, 7154-7171.
[3] K. T. Dey, S. Goswami. Tight cocone: a water-tight surface reconstructor. Proc. of the eighth ACM
symposium on Solid modeling and applications, 2003,
pp.127–134.
[4] gLite. <http://glite.cern.ch/>.
[5] C. D. Hansen, C. R. Johnson. The Visualization
Handbook. Elsevier, 2005.
[6] JSCH. <www.jcraft.com/jsch/>.
[7] A. Kaceniauskas, R. Pacevic, A. Bugajev, T. Katkevicius. Efficient visualization by using ParaView software on BalticGrid. Information
Technology and Control, 2010, Vol. 39, No.2,
108-115.
[8] A. Kaceniauskas, R. Pacevic. VizLitG: grid visualiza-tion e-service enabling partial dataset transfer from storage elements of glite-based grid infrastructure.
Journal of Grid Computing, 2011, Vol. 9, No.4,
573-589.
[9] R. Kacianauskas, V. Vadluga. Lattice-based six-spring discrete element model for discretisation problems of 2D isotropic and anisotropic solids.
Mechanika, 2009, Vol. 76, No.2, 11–19.
[10] G. Lilliu, J. G. M. Van Mier. 3D lattice type fracture model for concrete. Engineering Fracture Mechanics, 2003, Vol.70, No.7–8, 927–941.
[11] D. Markauskas, A. Kaceniauskas, A. Maknickas. Dynamic domain decomposition applied to hopper discharge simulation by discrete element method.
Information Technology and Control, 2011, Vol. 40,
No.4, 286–292.
[12] P. Möller, P. Hansbo. On advancing front mesh generation in three dimensions. International Journal
for Numerical Methods in Engineering, 1995, Vol. 38,
No.21, 3551–3569.
[13] M. Polak, D. Kranzlmüller. Interactive videostrea-ming visualization on grids. Future Generation
Computer Systems, 2008, Vol. 24, No.1, 39–45.
[14] D. O. Potyondy, P. A. Cundall. A bonded-particle model for rock. International Journal of Rock
Mechanics and Mining Sciences, 2004, Vol.41, No.8,
1329–1364.
[15] C. H. Rycroft. Voro++: A three-dimensional Voronoi cell library in C++. Chaos: An Interdisciplinary
Journal of Nonlinear Science, 2009, Vol. 19, No.4,
041111.
[16] J. Rojek, E. Onate, C. Labra, H. Kargl. Discrete element simulation of rock cutting. International
Journal of Rock Mechanics and Mining Sciences,
2011, Vol.48, No.6, 996–1010.
[17] P. Rosenthal, L. Linsenm. Smooth surface extraction from unstructured point-based volume data using PDEs. IEEE Transactions on Visualization and
Computer Graphics, 2008, Vol.14, No.6, 1531-1546.
[18] W. Schroeder, K. Martin, B. Lorensen.Visualization Toolkit: An Object-Oriented Approach to 3D
Graphics, 4th Edition. Kitware. Inc., 2006.
[19] J. R. Shewchuk. Delaunay refinement algorithms for triangular mesh generation. Computational Geometry, 2002, Vol. 22, No.1–3, 21–74.
[20] J. H. Walther, I. F. Sbalzarini. Large-scale parallel discrete element simulations of granular flow.
Engineering Computations, 2009, Vol. 26, No.6,
688-697.
[21] H. P. Zhu, Z. Y. Zhou, R. Y. Yang, A. B. Yu. Discrete particle simulation of particulate systems: A review of major applications and findings. Chemical
Engineering Science, 2008, Vol. 63, No.23,
5728-5770.