© 2016 Surendra Tripathy et al. This is an open access article distributed under the terms of the Creative Commons Attribution License -NonCommercial-ShareAlikeUnported License (http://creativecommons.org/licenses/by-nc-sa/3.0/).
Journal of Applied Pharmaceutical Science Vol. 6 (09), pp. 041-047, September, 2016 Available online at http://www.japsonline.com
DOI: 10.7324/JAPS.2016.60906 ISSN 2231-3354
Hydrophilic Matrix Based Oral Controlled Release Tablets of Melt
Sonocrystallized Simvastatin
Surendra Tripathy
*, Brijesh Kumar Singh, Dilip Kumar Patel, Narahari Narayan Palei
Varanasi College of Pharmacy, Babatpur, Varanasi-221006, India.Department of Pharmaceutical Sciences, SHIATS, Allahabad, India. Sree Vidyanikethan College of Pharmacy, Tirupati-517102, India.
ARTICLE INFO ABSTRACT
Article history: Received on: 21/05/2016 Revised on: 15/07/2016 Accepted on: 14/08/2016 Available online: 26/09/2016
The major drawback of Simvastatin to formulate a dosage form is its poor aqueous solubility. In this study a solvent and carrier less technique called Melt sonocrystallization was utilized to form tiny crystals of Simvastatin with enhanced solubility in distilled water and Phosphate buffer pH 7.4, with an insignificant (p > 0.05) change in partition behaviour. The Melt sonocrystallized Simvastatin (MSCSIM) was characterized by FT-IR, DSC and SEM. The flow property was characterized and compared with pure Simvastatin. The MSCSIM was incorporated in directly compressed matrix tablets formed with varying proportion of HPMC K100 LV and starch. The formed tablets were evaluated for pharmacotechnical parameters along with drug release study. After melt sonocrystallization the chemical integrity of drug was unchanged and showed a sound flow property. The pharmacotechnical features of the tablets were noted to be within pharmacopoeial limit. The formulation F5 displayed a comparatively more controlled release of drug (96.45%) over 12 hours. The major release mechanism was found to be anomalous diffusion, with n value of 0.58 from the Korsmeyer-Peppas model, suggesting the drug release driven by swelling of matrix and diffusion. This technique may prove to be beneficial for poorly water soluble drugs and the melt sonocrystallized drugs can lend themselves for developing controlled release formulations.
Key words:
Simvastatin,
Meltsonocrystallization, Solubility, Matrix, Controlled release.
INTRODUCTION
Drugs having a fair solubility profile are supposed to be absorbed readily from the biological membrane. The drug which are not soluble in aqueous phases always show bioavailability problem. The drug Simvastatin (SIM), which is a poorly soluble drug, is thus selected for solubility enhancement, which is a 3-hydroxy-3-methylglutary coenzyme A (HMG CoA) reductase inhibitor, the enzyme that catalyzes the conversion of HMG-CoA to mevalonate, the rate-limiting step in the biosynthesis of cholesterol. It is reported to be well absorbed from the GIT, so
improvement of its solubility may prove to be an important
.
.
* Corresponding Author
Email:[email protected]
aspect to enhance its GI absorption and thereby, the bioavailability (Murtaza, 2012).
Several techniques have been developed by researchers to increase the solubility profile of SIM, which includes Inclusion
complex formation technique (Varshosaz et al., 2011, Shiralasetti
et al., 2010), Solid dispersion technique (Zhang et al., 2011),
Solubilisation by surfactant (Margulis-Goshen et al., 2009, Meng
et al., 2007), Milling technique (Zimper et al., 2010),
Nanoprecipitation (Patil et al., 2011) etc. Few of these techniques
require an additional carrier or solvent which is undesirable. So, a solvent and carrier free technique was selected for improving solubility of SIM i.e. the Melt sonocrystallization.
This technique has been reported by different researchers to improve solubility, micromeritic properties and rheological
properties of drugs like Piroxicam (Gupta et al., 2013), Curcumin
Attempts have been made by researchers to control the
release of SIM by forming Hydrogels (Park et al., 2013), porous
Polymer scaffolds (Gentile et al., 2016) and by formation of
matrix tablets by using gums (Mantry et al., 2013).
For developing a controlled release tablet formulation of SIM, it was necessary to improve its solubility to some extent. In this present research, a humble attempt has been made to formulate the melt sonocrystals of SIM as matrix tablets by using Hydroxy propyl methylcellulose (HPMC) and starch as matrix forming polymer by direct compression method.
MATERIALS AND METHODS
Simvastatin (SIM) was kindly provided as a gift sample from Hetero Pharmaceuticals, Baddi, India. HPMC, Starch, Lactose, Magnesium stearate and PVP were obtained from S.D Fine Chemicals, Mumbai, India. Talc was purchased from CDH Pvt. Ltd., New Delhi, India.
Preparation of Melt sonocrystallized Simvastatin (MSCSIM)
The drug (2g) was melted in a vessel on a paraffin oil bath maintained at 190 °C. Molten mass was poured in a vessel
containing 200 ml of deionised water maintained at 80°C using
thermostatic water bath and sonicated for 7 minutes using probe ultrasonicator (iksonic U 200 control) at amplitude of 80% and cycle of 0.8 per sec. The product obtained after solidification of dispersed droplet was separated by filtration by Whatmann filter paper and dried at room temperature. Yield was calculated after
complete drying of the crystals (Gupta et al., 2015).
Characterization of MSCSIM
Fourier-Transformed Infrared Spectroscopy
FTIR spectra were obtained by using an FTIR spectrometer-430 (JASCO, Japan). The samples previously ground and mixed thoroughly with Potassium bromide (KBr), an infrared-transparent matrix, at 1:5 (sample to KBr) ratio. The KBr discs were prepared by compressing the powders at a pressure of 5 tons for 5 min in a hydraulic press. Forty scans were obtained at a
resolution of 4 cm-1, from 4,000 to 300 cm-1 (Paradkar et al., 2006,
Deshmukh et al., 2013).
Differential Scanning Calorimetry (DSC)
The DSC measurements were performed on a DSC-6100 (Seiko Instruments, Japan) instrument with a thermal analyzer. All accurately weighed samples (SIM and MSCSIM) were placed in sealed Aluminum pans and DSC was run at a scanning rate of 10°C/min from 25°C to 200°C under Nitrogen flow (20 ml/min)
(Deshmukh et al., 2013).
Scanning Electron Microscopy (SEM)
SEM (LEO 435 VP, UK) was used to determine the morphology of pure SIM and MSCSIM. Samples were fixed on support with carbon glue and coated with gold using gold sputter
model in a high vacuum evaporator. Samples were then subjected for viewing the surface with scanning electron microscopy (Gupta
et al., 2013).
Comparative Saturation Solubility study of SIM and MSCSIM
An excess amount of SIM and MSCSIM were added separately to different solvent systems like water and phosphate buffer 7.4 and the samples were shaken continuously in a
mechanical shaker for 48 hours at 37 oC until equilibrium was
achieved. After 48 hours the solution was filtered through nylon filter paper. The filtrate was diluted suitably with the respective
solvent system and the amount was quantified
spectrophotometrically (Chaudhary and Uttekar, 2009).
Comparative partition coefficient study of SIM and MSCSIM
The partition coefficient of SIM and MSCSIM were measured between distilled water and n-Octanol system and phosphate buffer pH 7.4 and n-Octanol system (each medium
10ml) at an ambient temperature of 37oC in different separating
funnels. The funnels with both the phases were shaken for 4 hours gently and then kept for 24 h for achieving mutual separation. After achieving the equilibrium between the aqueous and organic phase, the phases were separated from each other and SIM and MSCSIM were added to the aqueous phase of respective funnels. Both the phases were again mixed and shaken gently for 4 hours and kept for 48 hours to attain the equilibrium. 1 ml of the aqueous phase drug solution was taken separately from each funnel, diluted
suitably and quantified spectrophotometrically. Partition
coefficient was measured by using the formula (Tripathy and Das,
2013, Gupta et al, 2013);
P = (Ca- Cb)/ Cb
Where, P= Partition coefficient, Ca= Initial concentration of drug
in aqueous phase (µg/ml) and Cb= Final concentration of drug in
aqueous phase after equilibrium (µg/ml)
Flow property study
SIM and MSCSIM forms were characterized for bulk density, tapped density, Carr’s compressibility index, angle of repose and Hausner’s ratio. Dynamic angle of repose of SIM and
MSCSIM was determined by method reported by Gupta et al.,
where by placing 1 g of drug powder in a lab fabricated rotating cylinder apparatus and allowed to rotate at 25 rpm for 5 min. The angle made by the bulk of the drug powder against the horizontal tangent was recorded and dynamic angle of repose for each sample was calculated. The bulk density was obtained by dividing the
weight of sample by the final volume in cm3 of the sample in the
cylinder. Hausner’s ratio was determined by dividing the tapped
density by bulk density (Dhumal et al., 2009, El- Kamel et al.,
2008). The percent compressibility index was calculated by using the equation:
Preparation of Matrix based Tablets of MSCSIM
Composition containing 40mg MSCSIM were prepared by direct compression technique using single punch tablet machine (10 mm die diameter). HPMC (K100 LV) was selected for the formulation as it has been reported to form good matrix. Starch acts as a release rate controller, as well as the moisture content of starch helps in binding the tablet. Polyvinylpyrrolidone (PVP) was used to improve cohesiveness of the powders by providing binding action. Nine formulations F1 –F9 has been prepared by varying the
ratio of HPMC and Starch (Gawali et al, 2012, Cao et al., 2005,
Fuhrer, 1999). The formulation F9 (not tabulated) contains the same ingredients except that starch was absent in it. The composition of formulations is given in Table 1.
Table 1: Composition of Tablet formulations.
Ingredients F1 F2 F3 F4 F5 F6 F7 F8
MSCSIM 40 40 40 40 40 40 40 40
HPMC : Starch 1:9 1:5 1:4 1:3 1:1 1:2 1:4 1:8
PVP (%) 2 2 2 2 2 2 2 2
MgStearate(%) 2 2 2 2 2 2 2 2
Talc (%) 2 2 2 2 2 2 2 2
Pharmacotechnical Characterization of Tablets
The prepared matrix tablets were evaluated for tablet thickness, hardness, friability, disintegration time, % weight
variation, % Drug content and in vitro release. A Vernier calliper
(least count = 0.01) was used to determine thickness of 10 randomly selected tablets. The result was expressed as mean values ± SD. The hardness of the tablets was determined using Monsanto hardness tester (HICON, Grover Enterprises, New Delhi, India), as expressed in kg/cm. Three tablets were randomly picked from each formulation. Friability of prepared tablets was determined by using Roche friabilator (HICON friability test apparatus). Ten tablets from each batch were selected randomly followed by accurate weighing. Tablets were then placed in plastic chamber that rotates at 25 rpm, dropping tablets from a distance of six inches with each revolution. The friabilator was operated for 100 revolutions and the tablets were made dust free and reweighed
(Mantry et al., 2013, Bhise et al., 2014). Friability was calculated
using following equation:
% Friability = [(Initial weight − Final weight)/Initial weight] × 100
For weight variation test, twenty tablets of each batch were selected randomly and weighed. The average weight was calculated. The tablets were passed the test if the individual weight of not more than 2 tablets deviated from the average weight by more than the percentage as per pharmacopoeial limits and none deviated more than twice the percentage.
In Vitro Drug Release
The prepared tablets incorporated with MSCSIM were
evaluated for drug release study. To study In vitro dissolution of
formulations, USP dissolution apparatus: Type‐I was used with
Phosphate buffer with pH 7.4 as the Dissolution medium at a temperature of 37 ± 0.5 °C with a basket Rpm of 50. Sample of 5 ml, was withdrawn at regular intervals. The volume withdrawn was replaced by fresh volume of dissolution medium to maintain constant volume and sink condition of dissolution medium. The samples were filtered through whatman filter paper and analyzed spectro-photometrically at 238.90nm. The amount of drug released was determined using calibration curves. Dissolution studies for
each formulation were performed in triplicates (Kavanagh et al.,
2014).
Statistical Analysis
The data obtained in this study have been expressed as Mean ± S.D (Standard Deviation). The data were subjected to statistical analysis and assessed by one way Analysis of Variance (ANOVA) following Dunnett’s t – test. p value of less than 0.05 was considered as evidence of a significant difference.
RESULTS AND DISCUSSION
Melt sonocrystallized Simvastatin (MSCSIM) particles were generated from the pure powder form of Simvastatin (SIM). MSCSIM preparation involved a two step process which involves preparation of molten magma and application of ultrasonic energy to the magma after pouring it to the aqueous phase. The above two steps leads to formation of solidified particles with strong bonds which again helps the particles to resist the shear produced during the sonication. Upon the addition of molten SIM, it slowly reached the bottom due to its viscous nature and started solidifying loosely itself. Applying the ultrasonic energy to the loosely solidified melt, it resulted in its fragmentation and formation of tiny crystalline particles which was throughout the aqueous phase. The sonication energy was probably sufficient to fragment the loose solid and induce kinetic movement of the fragments. Due to this movement of the tiny fragments all over the aqueous medium, all fragments got rapidly crystallized into fine particles and
dispersed (Khan et al., 2015, Gupta et al., 2013). The optimized
temperature and sonication time were 80° C and 7 minutes respectively. This condition was enough for the formation of filterable particles. Sonication for a longer time was avoided as it may induce further aggregation of particles to form large particles. The yield was calculated to be 92.2%.
Characterization of MSCSIM
Fourier-Transform Infrared Spectroscopy
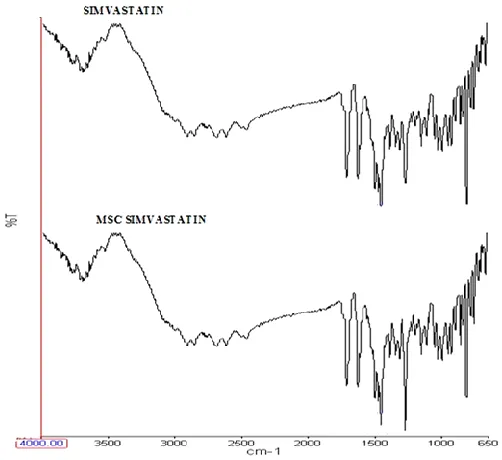
The FT-IR study was performed to detect any chemical change aroused during the melt sonocrystallization. The spectra (Fig.1) of both the sample i.e., the SIM and MSCSIM were found superimposable to each other. The peaks of major characteristic functional groups were retained. The major peaks identified were
at 1704.2 cm-1 (C=O stretching), 1624.05 and 1446.6 cm-1
(Aromatic C=C stretching), 3650 cm-1 (Free O-H stretching,
This suggested that no chemical change has occurred after the crystallization from a molten mass by using ultrasonic energy.
Fig. 1: FT-IR Spectra of SIM and MSCSIM.
Differential Scanning Calorimetry
Though, the FT-IR had already revealed that there was no chemical alteration during the crystallization, the DSC study was performed to consolidate the fact that no such chemical change has occurred in the drug after melt sonocrystallization.
The thermogram of SIM (Fig.2a) showed a single endothermic peak at 139.41°C, with a normalized energy of 65.09 J/g. On the other hand the thermogram of the MSCSIM (Fig.2b) didn’t show any significant pattern. However, the peak was found at 140.06°C, with a normalized energy of 67.01 J/g, indicating that both the samples behaved identically to the thermal procedure. No peak broadening or asymmetry were detected, which may be due
to uniform crystal structures (Deshmukh et al., 2013). Further, no
sign of any change in the drug was observed comparing both the thermograms.
Scanning Electron Microscopy
The photomicrographs were studied to generate some idea on the morphological behaviour of the SIM and MSCSIM, from which the change in crystal behaviour can be observed. The micrograph of SIM (Fig.3 A) revealed that the original SIM exhibited some agglomeration with planar surface and close view to a particular crystal shows itself as a little elongated shaped, which is characteristic to the conventional crystals.
The micrograph of MSCSIM (Fig.3 B) has got finer and visually distinguished elongated shape. The short term cavity formed in the crystallization medium due to the ultrasonic wave causes zones of different pressure and temperature, inducing the
formation of nuclei and further crystal growth (Gupta et al., 2013,
Paradkar et al., 2006).
Fig. 2(a): Thermogram of pure SIM.
Fig. 2(b): Thermograms of MSCSIM
Fig. 3: Photomicrographs of SIM (A) and MSCSIM (B).
Comparative Saturation Solubility study of SIM and MSCSIM
After melt sonocrystallization SIM was found to have increased solubility in both water as well as phosphate buffer pH
7.4 (Table 2). The enhancement of solubility value in distilled
water was 2.16 fold and that in Phosphate buffer pH 7.4 was 2.85 fold. This enhancement in solubility can be attributed to the
formation more regular small sized crystal upon
area for solubilization. Simvastatin is weakly acidic drug and showed enhanced solubility in alkaline medium. The MSCSIM showed more improvement in solubility in alkaline media (Jagtap
et al., 2014).
Table 2: Comparative solubility study of Pure Simvastatin and MSC Simvastatin.
Solvent Pure Simvastatin MSC Simvastatin
Distilled Water 1.613 µg/ml 3.485µg/ml Phosphate buffer pH 7.4 24.045 µg/ml 68.561 µg/ml
Comparative partition coefficient study of SIM and MSCSIM
Simvastatin is BCS class-II drug. Enhancement in aqueous solubility of the drug after melt sonocrystallization should not affect the partition behaviour of the drug. The comparative partition coefficient study revealed that the drug showed an insignificant change in the partition property, which indicated that the drug can be incorporated in any formulation and the drug
permeation will not be affected (Gupta et al., 2013) (Table 3).
Table 3: Comparative partition coefficient study of Pure Simvastatin and MSC Simvastatin.
Drug
Distilled Water: n-Octanol (10:10)
KO/W
Phosphate buffer pH 7.4:n-octanol (10:10)
KO/W
Pure Simvastatin 4.31 4.16
MSC Simvastatin 4.08 4.01
Comparative Flow Property study
The data obtained from the rheological study of both SIM and MSCSIM, it was clear that the MSCSIM possessed better
flow property than the SIM (Table 4). The particle friction and
interparticular contact may reduce the flow ability of any powder. The reduction in size and formation of more uniform crystals with smooth surface might have imparted the fine flow property to MSCSIM. Also, a few fines were produced during crystallization which took the void space and increased the density. However, the parameters considered for flow property indicated a better flow of MSCSIM. An increase in 26.08% and 16.94% in Bulk density and Tapped density has been observed respectively. The Carr’s index value of MSCSIM was calculated to be 15.94, which is considered to be good flow, as compared to the pure SIM. Both the dynamic and static angle of repose value for the MSCSIM also suggested a good flow property. The MSCSIM can be referred as a noncohesive bulk material having a sound flow property
(El-Kamal et al., 2008).
Evaluation of Matrix Tablets
The sound flow behaviour of the MSCSIM encouraged
the formation of tablets by direct compression methods (Table 5).
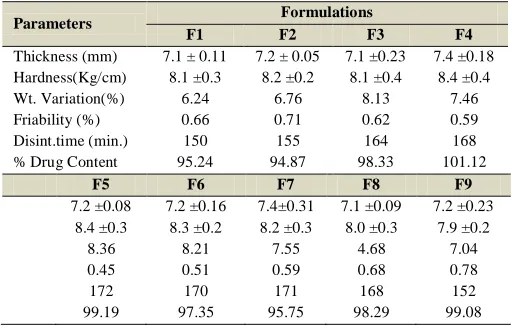
The thickness values of tablets were found to be in precision. The hardness range of tablets was 7.9-8.4 Kg/cm, which can withstand the jerks during shipment or handling. Mechanical stability of the
tablets was confirmed from the friability values, which was below 1%. The tablet weight variation was within the pharmacopoeial limit. The % Drug content range was 94.87- 101.12, which was also within the Pharmacopoeial limit according to I.P., 1996.
Table 4: Comparative study of parameters for characterization of flow property.
Parameters SIM
(Value ± S.D)
MSCSIM (Value ± S.D)
Bulk density (g/cm3) 0.46 ± 0.07 0.58 ± 0.18 Tapped density (g/cm3) 0.59 ± 0.12 0.69 ± 0.17
Carr’s Index 22.03 15.94
Hausner Ratio 1.28 1.18
Dynamic angle of repose 47.72 ± 1.27 33.18 ± 1.84 Static angle of repose 47.86 ± 1.33 33.07 ± 1.07 S.D = Standard Deviation.
Table 5: Comparative evaluation of Pharmacotechnical parameters of prepared batches.
Parameters Formulations
F1 F2 F3 F4
Thickness (mm) 7.1 ± 0.11 7.2 ± 0.05 7.1 ±0.23 7.4 ±0.18 Hardness(Kg/cm) 8.1 ±0.3 8.2 ±0.2 8.1 ±0.4 8.4 ±0.4
Wt. Variation(%) 6.24 6.76 8.13 7.46
Friability (%) 0.66 0.71 0.62 0.59
Disint.time (min.) 150 155 164 168
% Drug Content 95.24 94.87 98.33 101.12
F5 F6 F7 F8 F9
7.2 ±0.08 7.2 ±0.16 7.4±0.31 7.1 ±0.09 7.2 ±0.23 8.4 ±0.3 8.3 ±0.2 8.2 ±0.3 8.0 ±0.3 7.9 ±0.2
8.36 8.21 7.55 4.68 7.04
0.45 0.51 0.59 0.68 0.78
172 170 171 168 152
99.19 97.35 95.75 98.29 99.08
(Values ± Standard Deviation).
Evaluation of drug release kinetics
In vitro dissolution studies were conducted on tablets of
each of the formulations (F1-F9 ). The % cumulative drug release
of Simvastatin released at different time intervals were plotted. It was observed that the formulations F3, F4, F5 and F6 followed zero order, Higuchi model and Korsmeyer-Peppas model release kinetics by considering the linear portion of the graph from origin. Formulations F1, F2, F7, F8 could not manage to control the release for 12 hours and released around 40% of drug in the first hour, which was not the motto of the work and undesirable
(Gawali et al., 2012).
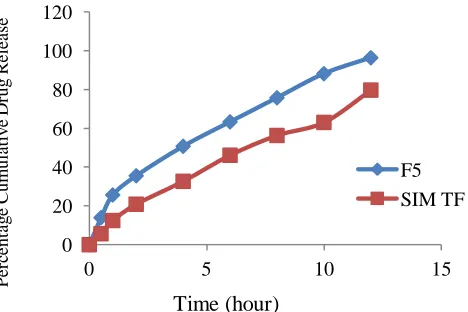
The higher percentage of HPMC (K 100 LV) and low content of starch in these formulations may have eroded quickly due to less viscosity of HPMC. The 1:1 ratio of HPMC and Starch (F5) was found to have better control over the drug release and showed a higher percentage (96.45%) cumulative drug release after 12 hours among the rest formulations (Fig. 4a, 4b). The drug release kinetic modelling of F5 revealed that the formulation best fit the Higuchi model, followed by Korsmeyer-Peppas model
Table 6: Drug release kinetics modelling of F5.
Formulation Zero order R2 First Order R2
F5 Y=7.832X+10.588 0.977 Y=0.062X+1.338 0.844
Higuchi model R2 Korsmeyer-Peppas Model R2 n
Y=28.27-3.508 0.995 Y=0.582X-0.625 0.992 0.58
This suggested that the major drug diffusion mechanism
was by polymer swelling and erosion of polymer (Henrist et al.,
1999). The n value obtained from the Korsmeyer-Peppas model was found to be 0.58, which corresponds to anamolous or Non-Fickian diffusion drug release mechanism, in which the process is driven by both swelling of matrix and diffusion of drug
(Kavanagh et al., 2004, Sriamornsak et al., 2007, Carbinatto et al.,
2014, Akhgari et al., 2011). The composition of formulation F5
was used to prepare another batch of formulation containing pure SIM and named as Simvastatin test formulation (SIM TF), to compare the % Cumulative drug release behaviour, which was found inferior to the F5 in terms of cumulative drug release, where
after 8 hours a steep increase was felt which might have
.
corresponded to the rapid erosion of remaining polymer in the formulation and insufficient starch left to control the release (Spiepmann and Peppas, 2001) (Fig. 4c).
CONCLUSION
Simvastatin, a BCS Class-II drug was successfully formulated as a matrix tablet, with the help of HPMC and Starch. The poor solubility profile of the drug was seen to have improved after the melt sonocrystallization process, without significant interference with the partition behaviour. This particular technique also improved the flow property of the simvastatin by reducing the cohesiveness. One of the most advantageous features of this technique is that, it does not involve any harmful solvents for designing the particles. Such class of drug, which frequently fails to lend itself for development of novel dosage forms due to solubility issues can be tested for melt sonocrystallization, which hopefully create a new area of formulation development by using this particle engineering technique.
Fig. 4a: Zero order drug release plots of formulation F1-F5. Fig. 4b: Zero order drug release plots of formulation F6-F9.
Fig. 4c: Zero order drug release plots of formulation F5 and SIM TF. 0
20 40 60 80 100 120
0 5 10 15
F1
F2
F3
F4
F5
P
er
ce
nt
ag
e
C
m
ul
at
iv
e
D
rug
R
el
ea
se
Time (hour)
0 20 40 60 80 100 120
0 5 10 15
F5 SIM TF
Time (hour)
P
er
ce
nt
ag
e
C
um
ul
at
iv
e
D
rug
R
el
ea
ACKNOWLEDGEMENT
The authors are highly thankful to the College authority for providing the research atmosphere as well as supplying the necessary materials for conducting this work.
Financial support and sponsorship: Nil.
Conflicts of interest: There are no conflicts of interest.
REFERENCES
Akhgari A, Abbaspour MR, Rezaee S, Kuchak A. Evaluation of the swelling, Erosion and drug release from polysaccharide matrix tablets based on pectin and Inulin. Jundishpur J Nat Pharm Prod, 2011; 6(1): 51-58.
Bhise MR, Mohod SP, Narkhede MB, Sapkal SB. HPMC based Extended release Matrix tablet of Gabapentin by Direct compression Method. Turk J Pharm Sci, 2014; 11(1): 45-54.
Cao Y, Huang L, Chen J, Liang J, Long S, Lu Y. Development of a controlled release formulation based on a starch matrix system. Int J Pharm, 2005; 298(1): 108-16.
Carbinatto FM, Castro AD, Evangelista RC, Cury BSF. Insights into the swelling process and drug release mechanisms from cross-linked pectin/high amylase starch matrices. Asian J Pharm Sci, 2014; 9: 27-34.
Chaudhary PD, Uttekar PS. Meltsonocrystallization: a novel particle engineering technique for solubility enhancement. Int J Pharm Tech Res, 2009; 1(1): 111-20.
Deshmukh V, Deshmukh T, Deshmukh M, Jadhav P. Design and development of melt sonocrystallization technique for carbamazepine. Ind J Pharm Edu Res, 2013; 47: 199–205.
Dhumal RS, Biradar SV, Paradkar AR, York P. Particle engineering using sonocrystallization: salbutamol sulphate for pulmonary delivery. Int J Pharm 2009; 368: 129-37.
El-Kamel AH. Improvement of physicochemical and biopharmaceutical properties of flurbiprofen using melt sonocrystallization technique. Drug Dev Res, 2008; 69:34-41.
Fuhrer C. 1996. Inter-particulate attraction mechanisms. In: Aldernborn G, Nystro MC, ed. Pharmaceutical powder compaction technology. New York: Marcel Dekker 1-15.
Gawali P, Gupta A, Kachare S, Kshirsagar S. Formulation and evaluation of Matrix based sustained release tablets of Quetapine fumarate and influence of excipients on drug release. J Chem Pharm Res., 2012; 4(6): 3073-3081.
Gentile P, Nandagiri VK, Daly J, Chiono V, Mattu C, Tonda-Turo C, Ciardelli G, Ramtoola Z. Localised controlled release of Simvastatin from porous Chitosan-gelatin Scaffolds engrafted with Simvastatin loaded PLGA-Microparticles for bone tissue engineering application. Mat Sci Eng, 2016; 59:249-257.
Gupta PS, Sharma V, Pathak K. Melt sonocrystallized piroxicam for oral delivery: particle characterization, solid state analysis and pharmacokinetics. Expert Opin Drug Deliv, 2013; 10:17-32.
Henrist D, Lefebvre RA, Remon JP. Bioavailability of starch based hot stage extrusion formulations. Int J Pharm, 1999; 187(2): 185-91.
Jagtap VA, Vidyasagar G, Dvivedi SC. Solubility enhancement of rosiglitazone by using melt sonocrystallization techniques. J Ultrasound, 2014; 17: 27–32.
Kavanagh N, Corrigan OI. Swelling and erosion properties of Hydroxyproprylmethylcellulose (Hypromellose) matrices-influence of agitation rate and dissolution medium composition. Int J Pharm, 2004; 279 (1-2):141-152.
Khan MA, Akhtar N, Sharma V, Pathak K. Product development studies on melt sonocrystallized curcumin for the treatment of Gastric cancer. Pharmaceutics, 2015; 7: 43-63.
Maheshwari A, Harshal J, Paradkar A. Melt sonocrystallization of ibuprofen: effect on crystal properties. Eur J Pharm Sci, 2005; 25:41-8.
Mantry S, Reddy KVN, Sriram N, Sahoo CS. Formulaion development and characterization of Sustained release matrix tablet of Simvastatin using Natural polymers. Indo-American J Pharm Res, 2013, 3(5): 4031-4041.
Margulis-Goshen K, Magdassi S. Formation of Simvastatin nanoparticles from microemulsion. Nanomed, 2009; 5(3): 274-281.
Meng J, Zheng L. Application of mixture experimental design to simvastatin apparent solubility prediction in the microemulsion formed by self-microemulsifying. Drug Dev Ind Pharm, 2007; 33(9): 927-931.
Murtaza G. Solubility enhancement of Simvastatin: A Review. Acta Pol Pharm Drug Res, 2012; 69(4): 581-590.
Paradkar A, Maheshwari M, Kamble R, Grimsey I, York P. Design and evaluation of celecoxib porous particles using melt sonocrystallization. Pharm Res, 2006; 23(6):1395-1400.
Park YS, Davis AE, Park KM, Lin Cy, Than KD, Lee K, Park JB, Jo I, Park KD, Yang VC. Controlled release of Simvastasin from In Situ forming hydrogel triggers bone formation in MC3T3-E1 Cells. APPS J, 2013; 15(2): 367-76.
Patil MS, Bavaskar KR, Girnar GA, Jain AS, Tekade AR. Preparation and optimization of simvastatin nanoparticles for solubility enhancement and in vivo study. Int J Pharma Res Dev, 2011; 2(12): 219-226.
Shiralashetti S, Patil A, Patil J. Influence of method of preparation on solubility, physicochemical properties and in vitro release profile of Simvastatin-Cyclodextrin inclusion complexes: A comparative study. Int J Chem Tech Res, 2010; 2(1): 562-571.
Spiepmann J, Peppas NA. Modelling of Drug Release from Delivery Systems Based on Hydroxypropyl Methylcellulose (HPMC). Adv Drug Deliv Rev, 2001; 48: 139-157.
Sriamornsak P, Thirawong N, Korkerd K. Swelling, erosion and release behaviour of alginate-based matrix tablets. Eur J Pharm Biopharm, 2007; 66(3): 435-450.
Tripathi R, Biradar SV, Mishra B, Paradkar AR. Study of polymorphs of progesterone by novel melt sonocrystallization technique: a technical note. AAPS Pharm Sci Tech 2010; 11:1493-1498.
Tripathy S, Das MK. Curcumin-Phospholipid Supramolecular complex for transdermal application. Der Pharm Lett, 2013; 5(5):224-233.
Varshosaz J, Tavakoli N, Salamat FA. Enhanced dissolution rate of Simvastatin using spherical crystallization technique. Pharm Dev Technol, 2011; 16 (5): 529-535.
Zhang Y, Zhang J, Jiang T, Wang S. Inclusion of the poorly water soluble drug simvastatin in mesocellular foam nanoparticles: drug loading and release properties. Int J Pharm, 2011; 410 (1-2): 118-124.
Zimper U, Aaltonen J, Krauel-Goellner K, Gordon KC, Strachan CJ, Rades T. The influence of milling on the dissolution performance of Simvastatin. Pharmaceutics, 2010; 2(4): 419-431.
How to cite this article: