Semi distributed model application for
evaluating the impact of climate change on water
resource in Quang Nam - Da Nang area
Ngoc Duong VO
1,2, Quang Binh NGUYEN
1, Philippe GOURBESVILLE
21 Faculty of Water Resource Engineering,
University of Science and Technology, the University of Da Nang, Viet Nam. 2 Innovative City lab URE 005
Polytech’Nice Sophia, Nice Sophia Antipolis University, France. [email protected]; [email protected];
Abstract
The Climate change is judged to impact seriously to human society. Hence, assessing the variation of climatic factors in this process is indispensable to mitigate its negative impacts. Quang Nam Da Nang area covered 3 large river catchments (Vu Gia Thu Bon, Tam Ky, Cu De) is predicted to be affected violently by the change of climate, especially on water resources security, as well in hydrological disasters. With the aim of evaluating the consequences of climate change, the study utilizes a semi distributed hydrological model (SWAT model) to simulate the stream flow variation in Quang Nam Da Nang area. The model is constructed with specific catchment characteristics. It is calibrated and validated over a period of 38 years from 1979 to 2016 with the impressive coefficients (NASH reachs to 0.87, R reachs to 0.94). The data about climate change is supplied by Vietnamese Ministry of Natural Ressources and Environments.
Keywords: Climate change; SWAT; Semi distributed; Quang Nam Da Nang; Vietnamese Ministry of Natural Ressources and Environments.
1
Introduction
Natural disasters in Vietnam central coastal region are very complicated and serious. It has damaged significantly on many aspects of human society (Tien, 2009). Therefore, damages caused by natural disasters for this region are projected to increase rapidly in the next years under the impact of climate change. According to local research by Vietnam Institute of Meteorology, Hydrology and Climate Change (Minister of Natural Resources and Environment - MONRE), in the late 21st century, the mean temperature of this region would increase from 2°C to 3°C, the annual and seasonal rainfall would
Engineering
Volume 3, 2018, Pages 2216–2225
increase while the rainfall in dry seasons would decrease, the sea level rise of about 0.75m to 1m compared to the 1980-1999 period. The consequences of climate change would result in a loss of around 10% of GDP, furthermore around 10% to 12% of this regional population will be affected directly by this phenomena (Monre, 2012). These challenges urge local authority to have a suitable policies and measures in order to improve both of public awareness and capacity to respond to climate change.
Quang Nam - Da Nang locates in the heart of the region and becomes one of the driving forces of economic growth for Vietnam central. Similar to other provinces, Quang Nam - Da Nang annually incurs significant consequences of natural disasters, especially of flood and drought disasters. It affects much on the regional economic development. The effect is expected to become more serious in the future under the impact of climate change. As a result, the objective of this study is to provide a viewpoint of natural disasters at Vu Gia-Thu Bon and Tam Ky catchment-the area is 11216.8Km2. By using semi distributed model – SWAT, the study analyzes the difference of stream flow in future (2016-2035, 2046-2065 and 2080-2099) with two scenarios RCP 4.5 and RCP8.5.
Table 1: Statistic of disaster damages in Quang Nam, 1997 - 2009
Year Dead (persons) Lossed (persons) Injuried (persons) Property (billion VND)
1997 33 0 0 100,00
1998 54 1 36 390,00
1999 118 0 339 758,00
2000 13 0 0 139,30
2001 13 1 9 75,76
2002 0 0 0 2,25
2003 32 2 5 91,40
2004 19 23 13 155,99
2005 12 5 24 109,70
2006 176 1 562 1900,60
2007 47 0 339 2000,00
2008 33 3 155,00
2009 52 220 3700,00
Tổng cộng 589 33 1550 9436,45
(Source: Provincial Committee for Flood and Storm Control Quang Nam)
2
Methodology
The stream flow in different periods (2016-2035, 2046-2065 and 2080-2099) are simulated via the validated hydrological with two fundamental climate change scenarios from Vietnam Governement (RCP 4.5 và 8.5). The difference in 5 locations over the catchment between these scenarios is analyzed to find out the change tendency in the river flow in the next few years.
2.1
Study area
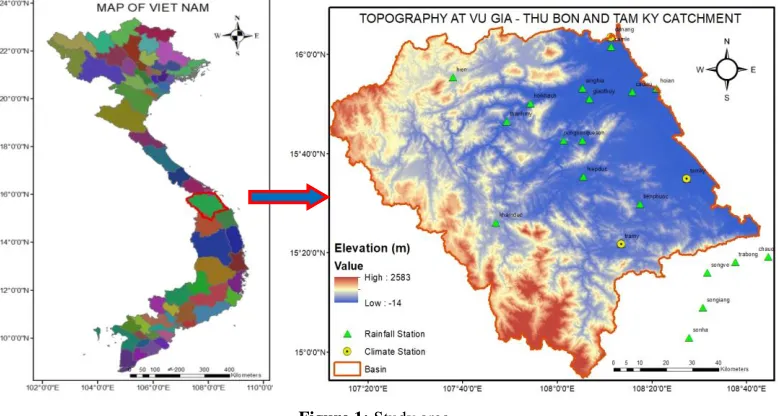
Vu Gia Thu Bon and Tam Ky river systems (Figure 1) are two main river systems of Quang Nam province and Da Nang city. With the catchment reaching to 11,216.8km2, these systems have an important role towards the social economic development of Viet Nam central. The Vu Gia - Thu Bon river system, which originates from the eastern side of the Truong Son mountain range and drains to the Vietnamese East Sea by Han outlet, Dai outlet and Lo outlet. With 205 km of length and 10,350 km2 of area, it is the biggest coastal river system in the central region of Vietnam. The Tam Ky is a small river which is neighbour of the Vu Gia Thu Bon. The Tam Ky rises from Tien Phuoc mountainuous region and finish at An Hoa mounth. The topography over two these catchments is complex with the relatively narrow mountainous area on the upstream and the flat coastal zone at the downstream. Located at a tropical monsoon climate region with influence of the ocean to the east, rain and storm in this region behave complicatedly. The average annual rainfall of this area is from 2000mm to 4000mm with 65% to 80% annual rainfall from September to December. This region is also attacked by two to four typhoons annually (RETA, 2011; TO, 2005).
Figure 1: Study area
2.2
SWAT model
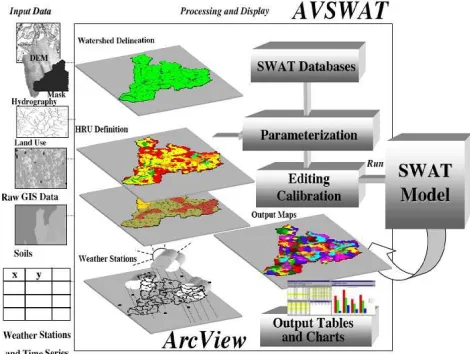
Figure 2: SWAT model scheme (https://geo.arc.nasa.gov/sge/casa/hydrologic/swat.html)
SWAT is integrated with several readily available databases and Geographic Information Systems (GIS) (Figure 2). SWAT has been successfully applied in many published studied. Panagopoulos et al., 2015 uses the SWAT model to assess the effects of climate change on hydrological regime, water quality and crop yield in the Ohio-Tennessee River basin (Panagopoulos et al., 2015). Guo et al., (2008) examine the annual and seasonal streamflow responses to climate and land-cover changes in the Poyang Lake basin, China (Guo, Hu, & Jiang, 2008). Xie and Cui, (2011) developed and tested the SWAT for modeling hydrological processes in irrigation districts with paddy rice (Xie & Cui, 2011).
2.3
Setup model
Information System (GIS) interface created for SWAT, called ArcSWAT (version 2.1.5), was used to develop inputs for the watershed models. Elevation, stream network, land cover, soil type, weather, point source discharges, impoundment (reservoir, lake, or pond) characteristics were included. The Digital Elevation Model (DEM) were obtained with resolution 90m×90m. Time series of rainfall monitoring and temperature are 36 years from 1980 to 2016. The daily precipitation data was collected from 21 stations. The necessary temperature for running the model were from 3 stations. Soil information and land use data were taken from LUCCI project (Figure 3).
Figure 3: River network Figure 4: Land used map Figure 5: Soil map
2.4
Calibration and validation process
from 1996 to 2010 and from 2011 to 2016. This process were conducted based on observed discharge data recorded at two station located at middle of two main channels, Nong Son and Thanh My. Three commonly used model efficiency criteria were used to evaluate the performance of the model including the root mean squared error (RMSE), the correlation coefficient (R), Nash-Sutcliffe coefficient (E) as equations 1, 2, 3 respectively.
2 obs,i model,i i=1 RMSE= n X X n
(1)
obs,i obs model,i model i=1
2 2
obs,i obs model,i model
i=1 i=1
.
.
n
n n
X X X X
R
X X X X
(2)
n 2 obs,i model,i i 1 2 obs,i obs i=1 X X 1- n E X X
(3)Where the Xobs is observed value and Xmodel is modelled value at time/ place i.
2.5
Climate scenario
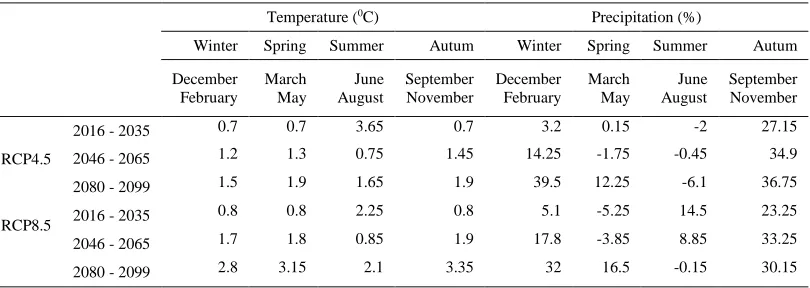
Two scenarios (RCP4.5 and RCP8.5 released in 2016) from Viet Nam Government is used in this study. The temperature and precipiation are two factors which are considered in SWAT to assess the impact of climate change on stream flow of Quang Nam Da Nang area over three periods 2016 - 2035, 2046 - 2065, 2080 – 2099. The variation of temperature and precipiation are shown in Table 2.
Table 2: Average Temperature and precipitation change at Quang Nam – Da Nang catchment according to scenario of Vietnam Governement releasing in 2016
3
Results and Discussion
3.1
Calibration and Validation
Due to the semi distributed characteristic of SWAT model, calibration is carried on three principal parameter groups which physically represent for overland flow, ground water flow and stream flow. The strategy of calibration fisrtly focuses on ground water flow by controlling two parameters: Groundwater delay (Gw_Delay), Baseflow alpha factor (Alpha_Bf). Afterward, SCS runoff curve number for moisture condition II (CN2), Manning’s N value for overland flow (OV-N), Manning’s n
Temperature (0C) Precipitation (%)
Winter Spring Summer Autum Winter Spring Summer Autum
December February March May June August September November December February March May June August September November RCP4.5
2016 - 2035 0.7 0.7 3.65 0.7 3.2 0.15 -2 27.15
2046 - 2065 1.2 1.3 0.75 1.45 14.25 -1.75 -0.45 34.9
2080 - 2099 1.5 1.9 1.65 1.9 39.5 12.25 -6.1 36.75
RCP8.5 2016 - 2035 0.8 0.8 2.25 0.8 5.1 -5.25 14.5 23.25 2046 - 2065 1.7 1.8 0.85 1.9 17.8 -3.85 8.85 33.25
value for main channel (CH_N1, CH_N2), Effective hydraulic conductivity in the tributary channel alluvium (CH_K1), Effective hydraulic conductivity in the main channel alluvium (CH_K2), Surface runoff lag coefficient (SURLAG) are successively adjusted to conduct the peak flow and hydrograph shape.
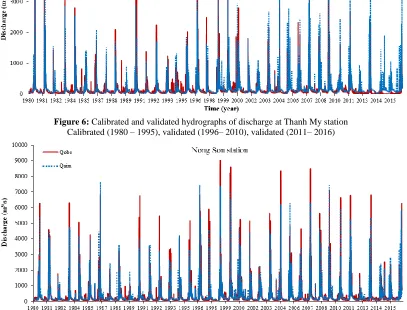
The simulated and observed stream flow plot for the calibration and validation performance is presented in Figure 6, 7. It can be seen that model predicted flows are in good agreement with observed data. Importantly, the model is able to capture the peaks of discharge and this is usefull to simulate flood events. Furthermore, 3 efficiency criteria presented in Table 3 make evidence for the model simulated quality. The R coefficients are quite hight in both periods when reaching to the value of 0.9 at Thanh My station and 0.94 at Nong Son station. Similarly, the E coefficinents could attain to 0.87 at Nong Son and 0.77 at Thanh My. Overall the validation results indicate that the present model is suitable for investigating the variation of stream flow under the effect of climate change.
Figure 6: Calibrated and validated hydrographs of discharge at Thanh My station Calibrated (1980 – 1995), validated (1996– 2010), validated (2011– 2016)
Table 3: Statistical indices
Station
Calibration (1980-1995) Validation (1996-2010) Validation (2011-2016)
RMSE
(m3/s) R E
RMSE
(m3/s) R E
RMSE
(m3/s) R E Thanh My 147.78 0.84 0.74 149.74 0.88 0.77 162.11 0.86 0.51
Nong Son 211.20 0.90 0.81 254.48 0.94 0.87 347.65 0.75 0.64
3.2
Climate change
As shown in Figure 1, the Quang Nam Da Nang catchment spreads over divergent topography. It therefore partly affect the rainfall spatial distribution in the catchment and causing difference of climate change effect level to river flow. In order to reflect this difference, the flow in five locations which represent for important sites over catchment are considered. At each sub catchment, the impact of climate change will be analized via the variation of peak flow, base flow as well as the hydrological shift.
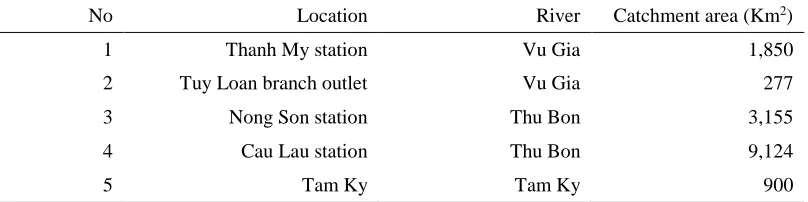
Table 4: Compared catchment area corresponding with Figure 3
No Location River Catchment area (Km2)
1 Thanh My station Vu Gia 1,850
2 Tuy Loan branch outlet Vu Gia 277
3 Nong Son station Thu Bon 3,155
4 Cau Lau station Thu Bon 9,124
5 Tam Ky Tam Ky 900
3.2.1
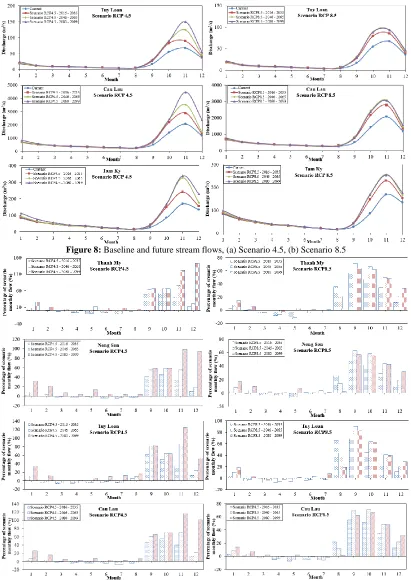
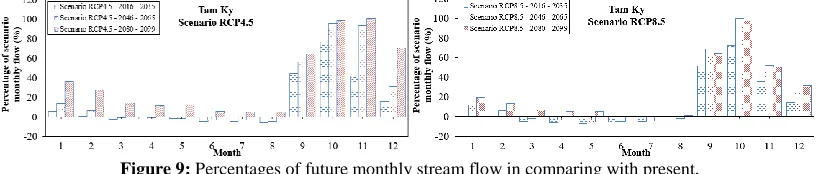
Change in flood flow
Figure 9: Percentages of future monthly stream flow in comparing with present, (a) Scenario 4.5, (b) Scenario 8.5
3.2.2
Change in drought flow
The temperature increase is considered as the main factor of evapotranspiration raising. It lead to the drought issue become more serious and catastrophic. The challenge might be one of main obstacles for socio economic development in future, especially towards the developping countries. As other poor regions, Quang Nam Da Nang catchment is jugded to face gravely with the water resource insufficient. The judgement is proved via the study result in Figure 9 The analysis demosntrates that most of scenarios excepting the period 2080-2099, the stream flow in dry season will decrease. The decrease is from 5.7% to 12.8 % at the main sites.
4
Conclusions
With the aims of providing an overview of Quang Nam Da Nang stream flow in future under the impact of climate change, a semi distributed model (SWAT) is developped. The model is set up with 18 parameters which are representative of three principal hydrological components: oveland flow, river flow and ground water flow. The calibration and validation process is carried out with twenty years observed data at Nong Son, Thanh My station. Calibrated and validated results show that the model performance is quite robust when statistical coefficients are very impressive (the Nash reachs to 0.87 and the R reachs to 0.94). It has been determined that SWAT can effectively be used to simulate surface water hydrology in this region. The variation trend of run off factors in Quang Nam Da Nang catchment under the impact of climate change is analysed using two scenarios (RCP 4.5 and RCP 8.5) which recently released by Vietnam government. The comparison is executed at seven sub cactments in three periods: 2016-2035, 2046-2065, and 2080-2099. This study show that the flow in Kon – Ha Thanh river will vary complicatedly and severely in future. This flow may increase roughly 142% in flood season and reduce around 12.8% in dry season. Further more the flood and dry seasons in the end of 21st century will come earlier and maintain longer than present.
References
Dinh, V. T. (2009). Department of Natural Resource and Environment. ACCCRN, Bangkok. Guo, H., Hu, Q., & Jiang, T. (2008). Annual and seasonal streamflow responses to climate and land-cover changes in the Poyang Lake basin, China. Journal of Hydrology, 355(1), 106–122.
Monre. (2012). Climate change, sea level rise scenarios for Viet Nam.
RETA, 6470. (2011). Investment, Managing water in Asia’s river basins: Charting progress and facilitating - The Vu Gia-Thu Bon Basin.
TO, T. N. (2005). Strategic plan for integrated water resources management of the Vu Gia Thu Bon Basin Organization.