VOLUME 39, ARTICLE 44, PAGES 1181
,
1226
PUBLISHED 11 DECEMBER 2018
https://www.demographic-research.org/Volumes/Vol39/44/ DOI: 10.4054/DemRes.2018.39.44
Research Article
Contemporary female migration in Ghana:
Analyses of the 2000 and 2010 Censuses
Samantha R. Lattof
Ernestina Coast
Tiziana Leone
Philomena Nyarko
© 2018 Lattof, Coast, Leone & Nyarko.
This open-access work is published under the terms of the Creative Commons Attribution 3.0 Germany (CC BY 3.0 DE), which permits use, reproduction, and distribution in any medium, provided the original author(s) and source are given credit.
1 Introduction 1182
2 Background 1183
2.1 Migration in Ghana 1183
2.2 Gender and migration 1185
2.3 Data sources for analysing migration in Ghana 1187
3 Data and methods 1188
3.1 Data 1188
3.2 Methods 1191
4 Results 1192
4.1 Identification of migrants 1192
4.2 Demographic structure of internal migrants 1196
4.3 Interregional female migration 1201
5 Discussion 1203
6 Acknowledgements 1206
References 1207
Contemporary female migration in Ghana:
Analyses of the 2000 and 2010 Censuses
Samantha R. Lattof1
Ernestina Coast2 Tiziana Leone3
Philomena Nyarko4
Abstract
BACKGROUND
Knowledge of female migration patterns is scant despite increased recognition and reporting of the feminization of migration. Recent data on female internal migration in Ghana challenges historical assumptions that underestimated female migration.
OBJECTIVE
This study presents the first detailed comparative analyses of female migration using microdata from Ghana’s censuses (2000 and 2010) and exploits this national data to understand the gendered dimensions of migration.
METHODS
Secondary analyses use direct and indirect methods to describe the scale, type, and demographic structure of contemporary female migration; assess the distribution of female migrants across age and geography; and estimate net internal female migration. RESULTS
Excluding international migrants, census microdata identified 31.1% of females as internal migrants in 2000 and 37.4% of females as internal migrants in 2010. Working-age migration was particularly pronounced in 2010, reinforcing economic opportunity as a likely driver of migration for both sexes. Female migrants were significantly more likely than female nonmigrants to reside in urban areas and work for pay, profit, or family gain. By 2010, married women were less likely to migrate than peers who had
1 London School of Economics and Political Science, London, UK. Email:[email protected]. 2 London School of Economics and Political Science, London, UK.
never married. Net out-migration exceeded net in-migration in eight of Ghana’s ten regions.
CONTRIBUTION
Our analyses expand the evidence base on contemporary female migration and refute the outdated stereotype that girls and women do not participate in migration. The prominence of the Greater Accra and Ashanti Regions as destinations for female migrants suggests that interventions are needed in Ghana’s more rural regions to reduce poverty and develop greater economic opportunities for girls and women.
1. Introduction
Due to population growth and urbanization, projections suggest that two-thirds of the world’s population will reside in urban areas by 2050, with most of this increase occurring in Asia and Africa (UNDESA 2014). Planning for and managing this changing population distribution will require better understanding of new migration patterns and the impacts of internal migration. This includes a better understanding of female migration, which has been historically underestimated, with analyses focused on male migrants or assumptions that migrants were male (Caldwell 1969; Zlotnik 1995).
Knowledge of female migration patterns is scant despite increased recognition and reporting of the feminization of internal migration (Hofmann and Buckley 2012; Beegle and Poulin 2013). Research from South Africa challenges the assumption that females represent the residentially stable population, finding women in rural areas to be highly mobile (Camlin, Snow, and Hosegood 2014). In Malawi, where young women now migrate more than young men, assumptions of traditional patterns of matrilocal residence following marriage no longer hold (Beegle and Poulin 2013). As evidence reveals changes in the sex composition of migrants, it also reveals changes in the reasons for migrating.
that may be polygamous (Anarfi and Agyei 2009).5 These factors influence both the
decision to migrate and the choice of destination.
Data from Ghana’s two most recent Population and Housing Censuses (2000 and 2010) indicates that there are more female than male internal migrants, particularly at younger ages (GSS 2013c). The growing number of younger migrants puts increasing pressure on social services and employment opportunities in urban areas. Some migrants move to Ghana’s urban areas independent of available resources or employment opportunities (Agyei and Ofosu-Mensah Ababio 2009).
This study analyses Ghana’s 2000 and 2010 Censuses using census microdata disaggregated by sex to provide a comprehensive picture of internal female migration at all ages. We use direct and indirect techniques to analyse the patterns, trends, and determinants of contemporary female migration. Our comparative analyses are the first to exploit national data from the 2000 and 2010 Censuses with a view to understanding the gendered dimensions of migration in Ghana.
2. Background
2.1 Migration in Ghana
Migration has historically been a way of life in West Africa and migration within Ghana is no exception. Ghana’s internal migration is primarily a north–south phenomenon established well before the census started officially recording migration data in 1960 (Agyei and Ofosu-Mensah Ababio 2009). Since 1960, each census has recorded large out-migration streams from Ghana’s northern regions and significant in-migration streams into the Greater Accra Region, with Ghana’s 2010 Census recording an intercensal in-migration rate of 40.72% for Greater Accra (GSS 2013c). Nearly one-third (32.2%) of the Greater Accra Region’s population is between the ages of 15 and 29 years, due to a high rate of age-selective in-migration and rapid natural increase (GSS 2013b). Migrants residing in Accra also tend to be long-term migrants, with only about one in ten having moved in the 12 months prior to the 2010 Census (GSS 2013b). As a result, Ghana’s urban centres (Figure 1) are facing growing challenges brought on by unemployment, inadequate sanitation, and the development of shanty towns. Of the 1.6 million migrants residing in the Greater Accra Region during the 2010 Census, about 10% originated from Ghana’s three northern regions (GSS 2013b).
migrate from Ghana’s rural areas to the country’s urban areas at greater rates than males (GSS 2013a). The same pattern exists among youth aged 25 years and younger, with girls and young women comprising 60.5% of migrant youth (Anarfi and Appiah 2009). Girls frequently migrate before completing their education. Depending on the estimates, between 50% and 80% of female migrants have no formal education (Agyei and Ofosu-Mensah Ababio 2009; Frempong-Ainguah, Badasu, and Codjoe 2009; Quartey and Yambilla 2009).
Figure 1: Map of Ghana by region with differentiated urbanization levels (2010)
Note: Map created by the authors.
opportunities, and lack of desire to participate in the agricultural industry (Frempong-Ainguah, Badasu, and Codjoe 2009). Urban-pull factors and rural-push factors also influence children’s migration decisions. Push factors for child migration include parental inability to cater for their children’s needs, ethnic conflicts, lack of privacy and money, lack of interest in schooling from parents and/or children, maltreatment by family members, desire to prevent being given away in marriage, and lack of independence (Frempong-Ainguah, Badasu, and Codjoe 2009). Pull factors for child migration include assisting a sibling with work, schooling, learning a trade, working for money, experiencing city life, and staying with a relative (Frempong-Ainguah, Badasu, and Codjoe 2009).
Child migrants experience a number of problems related to either their work or their young age: for instance, a decline in business, cheap prices for migrant services, harassment from city guards, financial problems, physically demanding work, work that is too difficult, no/insufficient work, no place to sleep, and high taxes (Kwankye and Addoquaye Tagoe 2009). Given these challenges, child migrants frequently return to their place of origin (Addoquaye Tagoe and Kwankye 2009). A survey conducted in northern Ghana among returned child migrants found that other reasons for children’s return included continuing their education, changed marital status, and being needed at home (Addoquaye Tagoe and Kwankye 2009). As children (and their families) appear to constantly weigh the costs and benefits of migrating to and from their place of origin, repeated migrations may occur (Anarfi and Kwankye 2009).
2.2 Gender and migration
Defining the roles of girls and women as daughters, wives, and mothers has failed to recognize women’s work beyond reproductive labour (e.g., caregiving, household labour, unpaid work). This narrow view of female roles is present in the literature on migration. Migrant girls and women may be classified as ‘dependent’ or ‘independent’ based on whether they migrate as daughters and wives or as members of the workforce (Llácer et al. 2007: ii4). Similarly, the migration literature has referred to girls and women who migrate with fathers and husbands as “passive” rather than “active” migrants (Findley 1989). These labels are absent from the literature on migrant boys and men. Male migrants are not classified according to their relationship to their mothers and wives.
migrant domestic work (Elias 2010). This invisibility stems from research in the 1960s and 1970s in which researchers often assumed migrants were male, focusing analyses on male migrants and historically underestimating female migration (Caldwell 1969; Zlotnik 1995). Sex-disaggregated census data increasingly shows growing mobility among girls and women, with migration rates frequently balanced between the sexes (Beegle and Poulin 2013; GSS 2013c; Camlin, Snow, and Hosegood 2014). While census data is limited to sex-disaggregated analyses, examining differences between the migration patterns of women and men is the first step in advancing our understanding of gender and migration.
Migration increasingly allows girls and women to challenge traditional social roles in rural societies (Guo, Chow, and Palinkas 2011). In Ghana, girls challenge these roles by independently deciding to migrate (70% of girls vs. 54% of boys) and by personally financing their migrations (57.6% of girls vs. 34.9% of boys) (Anarfi and Agyei 2009). Research from the Democratic Republic of Congo and Senegal finds that, in patriarchal settings, women’s access to and support from migrant networks is crucial in order for women to migrate (Toma and Vause 2014). Upon migrating, migrant women develop and strengthen community ties by strategically giving gifts, sharing food, caring for children, and participating in reciprocal labour (Tufuor et al. 2015).
Evidence suggests that gender-specific factors may influence girls’ and women’s choice of destination. Based on a survey of 450 child migrants residing in Accra and Kumasi in 2005, researchers found that migrant girls were occasionally pursued and recaptured by their families; this finding may illustrate one of the reasons why many females decide to move to Accra, the urban centre that is furthest from the northern regions (Anarfi and Agyei 2009). In addition to choice of destination, gender may influence where migrants work. In Accra, public spaces have historically been gendered: markets are associated with female entrepreneurship, whereas bus stations are associated with male entrepreneurship (Thiel and Stasik 2016).
2.3 Data sources for analysing migration in Ghana
Ghana’s internal migration data comes primarily from the decennial censuses and ad hoc population surveys, as Ghana has no population register or administrative data suitable for migration analyses. While census data provides limited depth of information on female migration, it provides the most comprehensive source of evidence on female migration at all ages that can be exploited using demographic techniques. Ad hoc subnational surveys and research on female migration in Ghana are localized and small-scale, precluding national-level analyses (Awumbila and Ardayfio-Schandorf 2008; Anarfi and Kwankye 2009). These studies address important aspects of migration, such as push- and pull-factors underlying independent child migration, childcare practices among young migrants, and migrants’ livelihood strategies. National migration data comes from the Ghana Migration Study (1991–1992), “Development on the Move” migration study (2008–2009), Ghana Demographic and Health Surveys (conducted in 1988, 1993, 1998, 2003, 2008, and 2014), Ghana Living Standards Survey (conducted in 1987, 1988, 1991–1992, 1998–1999, 2005–2006, and 2013), and post-independence censuses (1960, 1970, 1984, 2000 and 2010). Each of these data sources has strengths and limitations for national-level analyses of migration.
The 1991–1992 Ghana Migration Study (GMS), developed in response to inadequate migration data in prior censuses, provided a depth of migration data unparalleled by more recent surveys. It collected evidence on the processes, mechanisms, and effects of internal migration; however, this survey has not been repeated (Twum-Baah, Nabila, and Aryee 1995). Despite its relative depth of migration data, the 1991–1992 GMS has significant limitations: exclusion of child migrants younger than 15 years of age; documented implementation challenges, such as inaccessible enumeration areas (i.e., resulting from floods, ethnic conflicts, and broken transportation); and lack of technical assistance required to implement the survey (Twum-Baah, Nabila, and Aryee 1995).
To fill evidence gaps in migration’s developmental impacts and policy that were unaddressed in the GMS, the Regional Institute for Population Studies at the University of Ghana and the Global Development Network collaborated in 2008–2009 on a nationally representative survey entitled “Development on the Move: Measuring and Optimising Migration’s Economic and Social Impacts” (Yeboah et al. 2010). This study focused on international migration and its socioeconomic impacts on households and individuals remaining in Ghana.
2009). This question has several drawbacks for measuring migration. It precludes identification of types of migrants (e.g., internal, international) and calculation of subnational interregional migration flows. The 1993 GDHS included a five-question migration module that went beyond birthplace to include whether or not the respondent had lived elsewhere for at least six months, age at first migration, and reason for first migration (GSS, GHS, and ICF Macro 1994). Most recently, the 2014 GDHS asked respondents how many times in the last 12 months they had been away from home for one or more nights and whether they had been away from home for more than one month at a time (GSS, GHS, and DHS Program 2015). These questions have not been repeated, preventing comparative analyses across GDHS. Furthermore, GDHS sampling in Ghana excludes girls and women outside 15–49 years of age.
The Ghana Living Standards Survey (GLSS) assesses living conditions in Ghanaian households using a nationally representative sample. In the household roster, the 2012–2013 GLSS6 captures region/country of birth (question 11) and how many months during the past 12 months the person (aged six months and older) has been away from this household (question 22). The survey also contains a ten-question module on migration (Section 5A) that collects data such as timing of move/return, intentions to stay, occupation and industry of migrant labour, and reason for migrating. The GLSS6 is a valuable source of migration data since this migration data is linked to detailed individual- and household-level sociodemographic data; however, the ten-question module is asked only of household members aged seven years or older.
3. Data and methods
3.1 Data
Implementation was greatly improved for the 2010 Census post-enumeration survey, which sampled 250 out of 37,488 enumeration areas seven months after the census (GSS 2012). The post-enumeration survey found an omission rate of 3%, the erroneous inclusion of 1.3% of the population in the census, and a greater chance of males (3.3%) being omitted from the census than females (2.8%) (GSS 2012). Based on the low net coverage error of 1.8% at the national level, it was unnecessary to adjust the 2010 Census results for our analyses. However, some populations, such as migrant
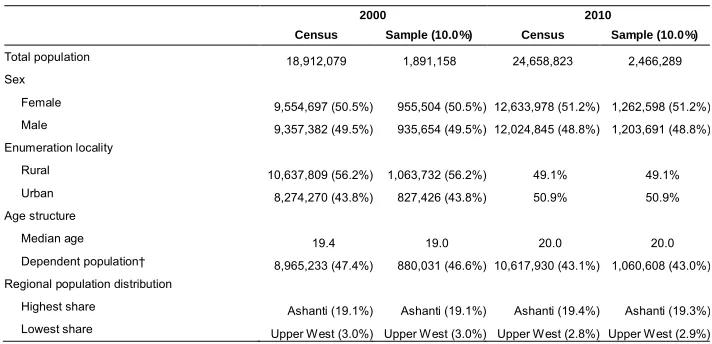
kayayei (female porters who carry loads on their heads at markets and transportation centres), proved challenging to enumerate in the 2010 Census since they are highly mobile and occasionally homeless; this population reportedly exceeded estimates and required additional time to enumerate in Accra (Daily Express 2010). Comparing key variables between the microdata and censuses reveals that the microdata sample from the 2010 Census more accurately reflects the complete census than the microdata sample from 2000, in which the age structure differs slightly (Table 1).
Table 1: Comparison of microdata samples to the 2000 and 2010 Censuses
2000 2010
Census Sample (10.0%) Census Sample (10.0%)
Total population 18,912,079 1,891,158 24,658,823 2,466,289
Sex
Female 9,554,697 (50.5%) 955,504 (50.5%) 12,633,978 (51.2%) 1,262,598 (51.2%)
Male 9,357,382 (49.5%) 935,654 (49.5%) 12,024,845 (48.8%) 1,203,691 (48.8%)
Enumeration locality
Rural 10,637,809 (56.2%) 1,063,732 (56.2%) 49.1% 49.1%
Urban 8,274,270 (43.8%) 827,426 (43.8%) 50.9% 50.9%
Age structure
Median age 19.4 19.0 20.0 20.0
Dependent population† 8,965,233 (47.4%) 880,031 (46.6%) 10,617,930 (43.1%) 1,060,608 (43.0%)
Regional population distribution
Highest share Ashanti (19.1%) Ashanti (19.1%) Ashanti (19.4%) Ashanti (19.3%)
Lowest share Upper West (3.0%) Upper West (3.0%) Upper West (2.8%) Upper West (2.9%)
Note: † Respondents aged <15 and >64 years.
and 2010 Censuses. Changes to response categories between censuses (e.g., additions, removals, or changes in definitions), and their analytic implications, are explored in the results.
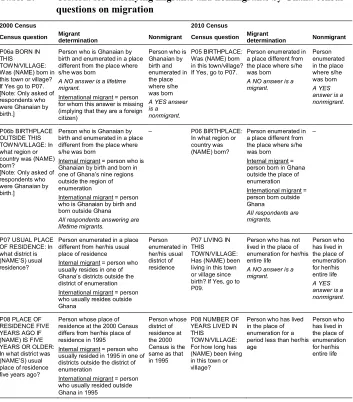
Table 2: Criteria for classifying migrants and nonmigrants by Ghana census questions on migration
2000 Census 2010 Census
Census question Migrant
determination Nonmigrant Census question
Migrant
determination Nonmigrant
P06a BORN IN THIS TOWN/VILLAGE: Was (NAME) born in this town or village? If Yes go to P07. [Note: Only asked of respondents who were Ghanaian by birth.]
Person who is Ghanaian by birth and enumerated in a place different from the place where s/he was born
A NO answer is a lifetime migrant.
International migrant = person for whom this answer is missing (implying that they are a foreign citizen)
Person who is Ghanaian by birth and enumerated in the place where s/he was born
A YES answer is a nonmigrant.
P05 BIRTHPLACE: Was (NAME) born in this town/village? If Yes, go to P07.
Person enumerated in a place different from the place where s/he was born
A NO answer is a migrant.
Person enumerated in the place where s/he was born
A YES answer is a nonmigrant.
P06b BIRTHPLACE OUTSIDE THIS TOWN/VILLAGE: In what region or country was (NAME) born?
[Note: Only asked of respondents who were Ghanaian by birth.]
Person who is Ghanaian by birth and enumerated in a place different from the place where s/he was born
Internal migrant = person who is Ghanaian by birth and born in one of Ghana’s nine regions outside the region of enumeration
International migrant = person who is Ghanaian by birth and born outside Ghana
All respondents answering are lifetime migrants.
– P06 BIRTHPLACE:
In what region or country was (NAME) born?
Person enumerated in a place different from the place where s/he was born Internal migrant = person born in Ghana outside the place of enumeration International migrant = person born outside Ghana
All respondents are migrants.
–
P07 USUAL PLACE OF RESIDENCE: In what district is (NAME’S) usual residence?
Person enumerated in a place different from her/his usual place of residence Internal migrant = person who usually resides in one of Ghana’s districts outside the district of enumeration International migrant = person who usually resides outside Ghana Person enumerated in her/his usual district of residence
P07 LIVING IN THIS TOWN/VILLAGE: Has (NAME) been living in this town or village since birth? If Yes, go to P09.
Person who has not lived in the place of enumeration for her/his entire life
A NO answer is a migrant.
Person who has lived in the place of enumeration for her/his entire life
A YES answer is a nonmigrant.
P08 PLACE OF RESIDENCE FIVE YEARS AGO IF (NAME) IS FIVE YEARS OR OLDER: In what district was (NAME’S) usual place of residence five years ago?
Person whose place of residence at the 2000 Census differs from her/his place of residence in 1995 Internal migrant = person who usually resided in 1995 in one of districts outside the district of enumeration
International migrant = person who usually resided outside Ghana in 1995
Person whose district of residence at the 2000 Census is the same as that in 1995
P08 NUMBER OF YEARS LIVED IN THIS TOWN/VILLAGE: For how long has (NAME) been living in this town or village?
Person who has lived in the place of enumeration for a period less than her/his age
Definitions in this paper are consistent with those used by the GSS. “Lifetime migrants” are people whose residence at the census differs from their birthplace (GSS 2013c), with “birthplace” defined as “the town or village (locality) of usual residence of the [infant’s] mother at the time of birth” (GSS 1999: 37). “District of usual residence” refers to the district in which the respondent usually resides and may be the place where s/he was enumerated; however, in cases where respondents maintain multiple residences (e.g., students, military personnel), “usual residence” refers to “where the person spends most of his/her days or time” (GSS 1999: 38). A respondent may also be considered a “usual resident” if s/he has “lived there for at least six months or has the intention of staying for the next six months” (GSS 1999: 38).
3.2 Methods
Secondary analyses of the 2000 and 2010 Census microdata were conducted using SPSS Statistics 22.0 and Microsoft Excel 2011 software. We used direct and indirect demographic techniques (UNDESA 1970; Moultrie et al. 2013) to describe the scale, type, and demographic structure (e.g., age, religion, marital status) of contemporary female migration in Ghana and to assess the distribution of female migrants across age and geography. We detail these methods and their assumptions in a technical appendix (Appendix 1).
cohort component method (Spoorenberg 2015), our estimates of net internal migration from place of birth data appear more robust (Appendix 1, Section A-1.4).
4. Results
After first identifying all migrants in the census data, we present analyses of the demographic structure of internal migrants. We then explore the demographic characteristics of female migrants, using regression analyses to explain internal migration status, with “internal migrant” as the dependent variable (yes/no). After examining who migrates, we analyse their migration destinations. The results conclude with analyses of interregional migration, including patterns and trends in the geographic distribution of internal migrants and estimates of interregional female migration between 2000 and 2010.
4.1 Identification of migrants
Migrants in the 2000 and 2010 Censuses were identified and classified according to the criteria in Table 2. The 2000 Census microdata identified a total of 359,960 female internal and international migrants (37.7% of the female population) and 371,577 male internal and international migrants (39.7% of the male population) (Appendix 2, Table A-7). In the 2010 microdata, the questions identified 487,376 female internal and international migrants (38.6% of the female population) and 447,485 male internal and international migrants (37.2% of the male population).
Of the female migrants identified in the 2010 microdata, international migrants comprised 3.1% of the sample (15,123). The 2000 Census permitted more refined identification of international migrants, since it collected data on place of usual residence at the time of the census and place of usual residence five years prior to the census. In the 2000 microdata, female migrants can be split into 62,929 international migrants (13.5%) and 402,146 internal migrants (86.5%). Between 2000 and 2010, the proportion of lifetime internal migrants increased for both females and males (28.7% to 35.6% and 28.1% to 34.2% respectively). The relative increase in lifetime migration was greater for females during this period.
Table 3: Female population classified by region of birth and region of enumeration, Ghana, 2000 and 2010
Region of birth
Region of enumeration
Total Western Central Greater
Accra
Volta Eastern Ashanti Brong Ahafo
Northern Upper East
Upper West
a) Region of birth by region of enumeration at 2000 Census
Western 642,460 16,760 28,380 2,920 8,000 21,060 5,560 1,880 1,600 1,410 730,030
Central 62,770 676,570 89,760 3,260 29,500 42,480 7,160 2,840 1,000 740 916,080
Greater
Accra 11,700 15,640 809,900 13,850 27,230 17,310 6,220 3,420 2,230 1,420 908,920
Volta 22,260 13,250 125,930 725,740 54,130 23,840 13,520 8,610 780 810 988,870
Eastern 29,300 21,540 162,960 11,400 858,730 37,760 8,970 2,120 1,420 930 1,135,130
Ashanti 44,500 15,970 78,680 5,070 19,850 1,304,400 36,120 7,360 8,830 5,340 1,526,120
Brong
Ahafo 28,420 3,300 16,980 2,130 5,150 35,620 683,910 5,640 2,310 3,390 786,850
Northern 8,870 3,020 23,010 14,910 5,600 31,620 27,290 821,860 4,020 2,660 942,860
Upper
East 19,410 2,550 12,680 960 4,480 42,890 23,720 10,410 422,900 1,440 541,440
Upper
West 12,370 1,890 9,710 810 3,860 22,890 40,210 12,700 2,200 264,120 370,760
Total 882,060 770,490 1,357,990 781,050 1,016,530 1,579,870 852,680 876,840 447,290 282,260 8,847,060
b) Region of birth by region of enumeration at 2010 Census
Western 909,160 30,970 43,610 3,640 11,730 40,980 10,090 1,210 1,600 1,540 1,054,530
Central 71,810 945,810 136,770 4,840 35,330 58,510 8,150 1,880 590 650 1,264,340
Greater
Accra 15,150 43,100 1,188,210 19,930 37,770 25,650 7,480 3,620 2,510 1,480 1,344,900
Volta 23,340 22,980 180,300 1,000,130 63,580 26,720 15,900 8,660 880 710 1,343,200
Eastern 28,610 38,450 245,430 15,380 1,123,500 46,750 10,290 1,830 1,030 1,000 1,512,270
Ashanti 41,350 29,580 125,150 7,230 28,910 2,011,670 44,260 7,620 12,740 5,230 2,313,740
Brong
Ahafo 27,870 7,730 32,930 3,850 8,780 77,220 943,410 6,700 2,550 5,170 1,116,210
Northern 18,190 6,950 49,480 17,280 10,890 61,570 40,740 1,190,720 5,970 3,620 1,405,410
Upper
East 21,250 3,850 20,530 910 6,610 66,430 29,680 9,560 500,400 2,230 661,450
Upper
West 13,370 2,050 9,910 610 4,170 28,600 50,520 11,820 2,770 334,880 458,700
Table 4: Male population classified by region of birth and region of enumeration, Ghana, 2000 and 2010
Region of birth
Region of enumeration
Total Western Central Greater
Accra
Volta Eastern Ashanti Brong Ahafo
Northern Upper East
Upper West
a) Region of birth by region of enumeration at 2000 Census
Western 613,470 14,430 26,760 2,620 7,390 19,710 5,580 1,750 1,870 1,440 695,020
Central 62,760 593,640 85,470 3,460 25,960 43,890 8,380 3,470 910 520 828,460
Greater
Accra 13,890 15,600 769,250 14,930 27,750 19,980 7,480 3,620 2,480 1,200 876,180
Volta 25,450 13,360 122,100 665,010 52,970 26,210 14,590 9,030 1,090 780 930,590
Eastern 33,250 21,020 151,680 10,780 804,890 39,620 9,700 2,330 1,540 790 1,075,600
Ashanti 48,040 15,600 80,840 4,170 18,940 1,222,970 34,200 7,190 8,850 4,610 1,445,410
Brong
Ahafo 30,760 3,690 17,350 2,210 5,170 35,070 647,860 5,340 2,530 2,600 752,580
Northern 10,710 3,630 23,200 14,170 7,260 35,630 32,400 796,510 3,680 2,510 929,700
Upper
East 23,880 2,890 14,600 1,070 6,230 49,060 29,090 8,390 372,130 1,040 508,380
Upper
West 13,780 1,940 8,700 1,060 5,310 27,470 49,760 12,530 2,090 242,230 364,870
Total 875,990 685,800 1,299,950 719,480 961,870 1,519,610 839,040 850,160 397,170 257,720 8,406,790
b) Region of birth by region of enumeration at 2010 Census
Western 874,870 25,780 38,060 2,790 10,360 37,300 11,550 1,070 1,730 1,640 1,005,150
Central 72,240 850,070 117,280 4,790 31,750 54,310 9,030 1,880 800 810 1,142,960
Greater
Accra 20,080 41,520 1,137,810 20,680 36,550 27,510 9,220 3,800 3,370 1,700 1,302,240
Volta 27,770 25,350 164,370 922,570 63,920 31,140 18,380 8,050 1,240 700 1,263,490
Eastern 34,700 37,390 211,150 14,320 1,071,690 46,210 11,210 2,130 1,600 910 1,431,310
Ashanti 50,080 31,680 123,980 6,700 27,270 1,868,170 47,390 7,400 12,710 5,840 2,181,220
Brong
Ahafo 32,480 9,420 29,570 3,330 9,300 66,940 895,440 6,250 2,480 4,430 1,059,640
Northern 21,890 7,840 45,020 16,990 13,680 61,050 47,070 1,172,660 5,250 4,200 1,395,650
Upper
East 26,540 5,250 20,180 910 7,460 65,630 33,050 7,150 471,290 1,610 639,070
Upper
West 14,880 2,650 7,240 680 6,190 27,940 55,620 10,430 1,820 315,410 442,860
Total 1,175,530 1,036,950 1,894,660 993,760 1,278,170 2,286,200 1,137,960 1,220,820 502,290 337,250 11,863,590
both sexes in 2000 and 2010: Greater Accra, Western, Ashanti, and Brong Ahafo. The remaining six regions experienced net losses by both sexes in 2000 and 2010.
Figure 2: Lifetime female migration streams, Ghana, 2000 (blue) and 2010 (red)
Figure 3: Lifetime male migration streams, Ghana, 2000 (blue) and 2010 (red)
-500,000 0 500,000 1,000,000 1,500,000 2,000,000 2,500,000 3,000,000
N
u
m
b
e
r
o
f
m
ig
ra
n
ts
Region of origin and destination
Net lifetime migration, 2010
Lifetime out-migrants, 2010
Lifetime in-migrants, 2010
Net lifetime migration, 2000
Lifetime out-migrants, 2000
Lifetime in-migrants, 2000
-500,000 0 500,000 1,000,000 1,500,000 2,000,000 2,500,000 3,000,000
N
u
m
b
e
r
o
f
m
ig
ra
n
ts
Region of origin and destination
Net lifetime migration, 2010
Lifetime out-migrants, 2010
Lifetime in-migrants, 2010
Net lifetime migration, 2000
Lifetime out-migrants, 2000
4.2 Demographic structure of internal migrants
Disaggregating internal migrants by age and sex highlights changes between groups and over time. Though Ghanaians migrate at all ages, the mean age of internal migrants increased over time. From 2000 to 2010, the mean age of female internal migrants rose from 27.39 years (s.d. 18.86) to 29.71 years (s.d. 18.69). Males showed a similar trend, with the mean age of internal migrants increasing from 28.48 years (s.d. 19.57) to 29.71 years (s.d. 18.62) between 2000 and 2010.
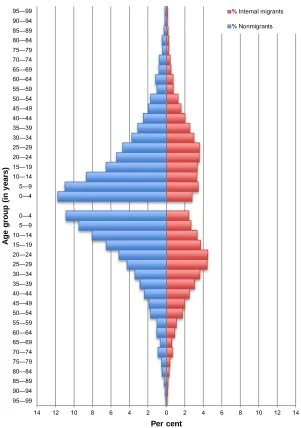
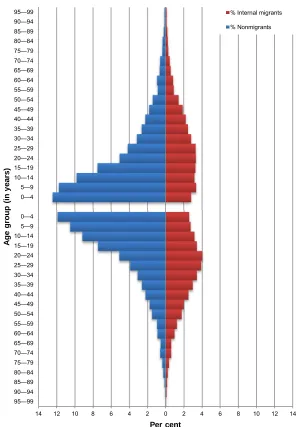
Examining the distribution of migrants and nonmigrants by five-year age groups indicates growing relative migration between 2000 and 2010. In 2000, female nonmigrants outweighed female migrants in each five-year age group (Figure 4, top). By 2010, the percentage of female migrants overtook female nonmigrants among women aged between 25 and 49 years (Figure 4, bottom). For males in 2000, nonmigrants comprised a greater percentage of each age group than migrants, with the exception of the age group 45–49 years (Figure 5, top). By 2010, male migrants outweighed male nonmigrants among men aged between 30 and 59 years (Figure 5, bottom). Working-age migration was particularly pronounced in 2010 for both men and women.
Figure 4: Female population pyramid by migrant status, 2000 Census (top) and 2010 Census (bottom)
14 12 10 8 6 4 2 0 2 4 6 8 10 12 14
95—99 90—94 85—89 80—84 75—79 70—74 65—69 60—64 55—59 50—54 45—49 40—44 35—39 30—34 25—29 20—24 15—19 10—14 5—9 0—4 0—4 5—9 10—14 15—19 20—24 25—29 30—34 35—39 40—44 45—49 50—54 55—59 60—64 65—69 70—74 75—79 80—84 85—89 90—94 95—99
Per cent
A
g
e
g
ro
u
p
(i
n
y
e
a
rs
)
% Internal migrants
Figure 5: Male population pyramid by migrant status, 2000 Census (top) and 2010 Census (bottom)
14 12 10 8 6 4 2 0 2 4 6 8 10 12 14
95—99 90—94 85—89 80—84 75—79 70—74 65—69 60—64 55—59 50—54 45—49 40—44 35—39 30—34 25—29 20—24 15—19 10—14 5—9 0—4 0—4 5—9 10—14 15—19 20—24 25—29 30—34 35—39 40—44 45—49 50—54 55—59 60—64 65—69 70—74 75—79 80—84 85—89 90—94 95—99
Per cent
A
g
e
g
ro
u
p
(i
n
y
e
a
rs
)
% Internal migrants
Figure 6: Regional out-migration by sex over the five-year interval, 1995–2000, and fitted with a 7-parameter model schedule, Ghana, 2000 Census 10% microdata
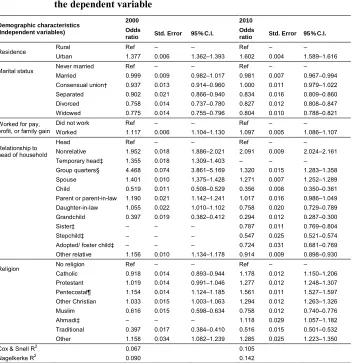
After identifying all female internal migrants in the microdata and examining migrant status by sex and age, we analysed the effects of demographic indicators on the likelihood of a girl or woman being identified as an internal migrant (Table 5). International migrants are excluded from these regression analyses. Age, in five-year age groups, and education status were nonsignificant predictors. These variables are excluded from the final models for 2000 and 2010, as they worsened or did not significantly improve the models’ ability to predict internal migrant status. The model for 2000 accurately predicts 63.5% of cases, predicting nonmigrants (85.1%) better than internal migrants (29.7%). The 2010 model improves the accuracy of predicting internal migrants (51.1%). It accurately predicts 65.7% of cases, including 75.5% of nonmigrants. Difficulties in accurately determining migrant status based on census data are likely to affect the models’ predictive abilities. Although both models have low R-squared values, they also have statistically significant predictors that can be used to draw conclusions about migrant status.
0 0.02 0.04 0.06 0.08 0.1 0.12
0 5 10 15 20 25 30 35 40 45 50 55 60 65 70 75
M
ig
ra
ti
o
n
p
ro
b
a
b
il
it
y
Age (in years)
Female obs Female fit Male obs
Table 5: Regression results explaining female internal migration status in Ghana, 2000 and 2010 Census microdata, with internal migrant as the dependent variable
Demographic characteristics (Independent variables)
2000 2010
Odds
ratio Std. Error 95% C.I.
Odds
ratio Std. Error 95% C.I.
Residence Rural Ref – – Ref – –
Urban 1.377 0.006 1.362–1.393 1.602 0.004 1.589–1.616
Marital status Never married Ref – – Ref – –
Married 0.999 0.009 0.982–1.017 0.981 0.007 0.967–0.994
Consensual union† 0.937 0.013 0.914–0.960 1.000 0.011 0.979–1.022
Separated 0.902 0.021 0.866–0.940 0.834 0.016 0.809–0.860
Divorced 0.758 0.014 0.737–0.780 0.827 0.012 0.808–0.847
Widowed 0.775 0.014 0.755–0.796 0.804 0.010 0.788–0.821
Worked for pay, profit, or family gain
Did not work Ref – – Ref – –
Worked 1.117 0.006 1.104–1.130 1.097 0.005 1.086–1.107
Relationship to head of household
Head Ref – – Ref – –
Nonrelative 1.952 0.018 1.886–2.021 2.091 0.009 2.024–2.161
Temporary head‡ 1.355 0.018 1.309–1.403 – – –
Group quarters§ 4.468 0.074 3.861–5.169 1.320 0.015 1.283–1.358
Spouse 1.401 0.010 1.375–1.428 1.271 0.007 1.252–1.289
Child 0.519 0.011 0.508–0.529 0.356 0.008 0.350–0.361
Parent or parent-in-law 1.190 0.021 1.142–1.241 1.017 0.016 0.986–1.049
Daughter-in-law 1.055 0.022 1.010–1.102 0.758 0.020 0.729–0.789
Grandchild 0.397 0.019 0.382–0.412 0.294 0.012 0.287–0.300
Sister‡ – – – 0.787 0.011 0.769–0.804
Stepchild‡ – – – 0.547 0.025 0.521–0.574
Adopted/ foster child‡ – – – 0.724 0.031 0.681–0.769
Other relative 1.156 0.010 1.134–1.178 0.914 0.009 0.898–0.930
Religion No religion Ref – – Ref – –
Catholic 0.918 0.014 0.893–0.944 1.178 0.012 1.150–1.206
Protestant 1.019 0.014 0.991–1.046 1.277 0.012 1.248–1.307
Pentecostal¶ 1.154 0.014 1.124–1.185 1.561 0.011 1.527–1.597
Other Christian 1.033 0.015 1.003–1.063 1.294 0.012 1.263–1.326
Muslim 0.616 0.015 0.598–0.634 0.758 0.012 0.740–0.776
Ahmadi‡ – – – 1.118 0.029 1.057–1.182
Traditional 0.397 0.017 0.384–0.410 0.516 0.015 0.501–0.532
Other 1.158 0.034 1.082–1.239 1.285 0.025 1.223–1.350
Cox & Snell R2 0.067 0.105
Nagelkerke R2 0.090 0.142
Notes: † In 2010 this category included informal unions and living together. ‡ This response category is included in only one census. § Group quarters included members of nonhousehold populations (e.g., nurses working the night shift) and referred to places such as hotels, orphanages, universities, prisons, and hospitals. ¶ In 2010 the category Pentecostal included respondents who identified as Charismatic.
spouse, or parent/parent-in-law also increases a census respondent’s odds of being identified as an internal migrant. Female migrants are more likely than nonmigrants to report working for pay, profit, or family gain, suggesting that economic opportunity is a likely driver of migration. By 2010, female migrants are likelier to have never married than be married. Female census respondents are substantially less likely to be identified as internal migrants in 2000 and 2010 if they practise a traditional religion or Islam and if they are the children of the household head.
4.3 Interregional female migration
Key features of Ghanaian female internal migration include the high concentration of intraregional migration within all regions and out-migration from the Upper East, Upper West, Northern, Volta, and Central Regions, with no significant in-migration. The Greater Accra Region exhibited significant in-migration from all but three regions (Upper West, Upper East, and Brong Ahafo).
The importance of the Greater Accra and Ashanti Regions as internal migration destinations is further underscored by examination of interregional female migration streams between 1995 and 2000. Using five-year fixed-interval data from the 2000 Census, we calculated interregional female migration streams between 1995 and 2000 in Ghana in the population aged five years and older. Table 6 depicts destination-specific out-migration rates for each of Ghana’s regions, producing a five-year migration rate for females who survived the period 1995–2000. Three of the five highest migration rates are among females migrating to Greater Accra from the Volta (0.0180), Eastern (0.0172), and Central Regions (0.0138). The highest rate is among females in the Western Region migrating to the Central Region (0.0218). The highest rates of migrants to the Ashanti Region are among females migrating from the Upper East (0.0129) and Brong Ahafo (0.0119) Regions.
Table 6: Female interregional migration rates in 2000 as proportions of survivors of the 1995 population, female population aged five years and older
Region of residence, 1995
Region of residence at census, 2000
Western Central Greater
Accra Volta Eastern Ashanti Brong Ahafo Northern
Upper East
Upper West Total
Western – 0.0218 0.0067 0.0025 0.0041 0.0099 0.0037 0.0007 0.0019 0.0023 0.0537
Central 0.0098 – 0.0138 0.0016 0.0052 0.0065 0.0012 0.0005 0.0005 0.0002 0.0394
Greater
Accra 0.0038 0.0080 – 0.0170 0.0086 0.0043 0.0014 0.0009 0.0011 0.0040 0.0490
Volta 0.0032 0.0028 0.0180 – 0.0081 0.0029 0.0015 0.0014 0.0006 0.0005 0.0390
Eastern 0.0032 0.0043 0.0172 0.0046 – 0.0066 0.0016 0.0005 0.0006 0.0008 0.0394
Ashanti 0.0058 0.0033 0.0072 0.0016 0.0036 – 0.0085 0.0012 0.0017 0.0062 0.0391
Brong Ahafo 0.0053 0.0015 0.0042 0.0016 0.0022 0.0119 – 0.0037 0.0023 0.0037 0.0365
Northern 0.0018 0.0007 0.0046 0.0028 0.0017 0.0058 0.0044 – 0.0018 0.0015 0.0251
Upper East 0.0079 0.0020 0.0043 0.0011 0.0021 0.0129 0.0055 0.0041 – 0.0008 0.0408
Upper West 0.0077 0.0008 0.0043 0.0008 0.0016 0.0092 0.0128 0.0058 0.0010 – 0.0441
Note: Interregional migration rates over 0.0100 are emphasized inbold.
Table 7: Estimates of overall net female out-migrants, in-migrants, and migration streams, Ghana, 2000 to 2010
Region of origin and destination
Net in-migrants Net out-migrants Overall net
migration
Total % Total %
Western 42,208 5.25 55,919 6.83 –13,711
Central 91,774 11.41 107,894 13.19 –16,121
Greater Accra 350,391 43.56 50,179 6.13 300,213
Volta 8,186 1.02 109,747 13.41 –101,561
Eastern 70,757 8.80 141,887 17.34 –71,130
Ashanti 180,774 22.47 79,344 9.70 101,431
Brong Ahafo 64,635 8.04 79,573 9.73 –14,939
Northern 662 0.08 109,747 13.41 –109,085
Upper East 6,823 0.85 54,035 6.60 –47,212
Upper West –11,844 –1.47 29,890 3.65 –41,734
Total 804,365 100 818,215 100 –13,849
smallest in the Upper West Region with 29,890 female out-migrants (3.65%), followed by Greater Accra with 50,179 female out-migrants (6.13%).
Negative numbers in Table A-11, such as among girls aged 5–14 years in the Upper West Region, indicate negative net out-migration. Among young girls in the Volta, Upper East, and Upper West Regions, the negative out-migration suggests that these children are likely to be returning home with a mother or father who was working outside the region. Among women aged 55 years and older in the Greater Accra, Western, Northern, Upper East, and Upper West Regions, negative out-migration suggests return migration of retiring workers.
Combining estimates of net in-migration and net out-migration reveals that net out-migration exceeds net in-migration in eight of Ghana’s ten regions. Only the Greater Accra and Ashanti Regions have positive net overall migration (Table 7). By contrast, overall net migration is lowest in the Northern and Volta Regions, with more girls and women moving out of the regions than moving into them.
5. Discussion
Our analyses reveal that the overwhelming focus of previous research on male internal migrants is misplaced. Internal migration in Ghana involves both sexes and warrants greater attention to sex-disaggregated analyses. Our analyses reveal that recent migration in Ghana is sex-balanced, according to the 47%–53% typology put forward by Donato and Gabaccia (2015). Ghanaian girls and women migrate at all ages, and approximately 40%–50% of these migrants are within age groups excluded from noncensus sources of national migration data (e.g., GDHS). Working-age migration is a key feature of migration for both sexes, peaking at earlier ages for females than males. Being a female migrant is significantly associated with residing in an urban area and working for pay, profit, or family gain. These findings suggest that economic opportunity is an important driver of female migration.
Only the Greater Accra and Ashanti Regions, home to Ghana’s two largest cities, have positive net overall migration. With net out-migration exceeding net in-migration in eight of Ghana’s ten regions, productive female labour losses may have a negative impact on local development efforts and local economies. The prominence of the Greater Accra and Ashanti Regions as destinations for female migrants suggests that interventions are needed in Ghana’s more rural regions to reduce poverty and develop greater economic opportunities for girls and women.
Ghana’s kayayei have become a visible sign of changing internal migration patterns. This growing population represents the face of female north–south, rural– urban migration in Ghana, with most migrant female youth becoming porters on arrival in Accra (Kwankye and Addoquaye Tagoe 2009). Though kayayei exist in Ghana’s second and third largest cities, Kumasi and Tamale, their presence in the capital has generated particular policy concerns (Parliament 2016). There is no accurate and reliable data on the number ofkayayei; estimates range from 2,300 to 160,000 in Accra (Kearney 2013; Parliament 2016). Such variation in the estimates reveals a need for improved data on and reporting of female internal migration if policymakers are to address development-related issues in the sending and receiving communities.
Our analyses highlight the valuable information that census data provides on migration’s demographic structure, patterns, and trends. Recent collaborations between the GSS and the International Organization for Migration suggest that future data collection activities in Ghana will pay greater attention to migration; however, existing census data presents an incomplete picture of contemporary female migration. Resource constraints in census offices, the expense of implementing a census, the balance of interests among census committee members, and political priorities frequently limit the number of migration questions in census questionnaires. Censuses also fail to capture migrants’ underlying motivations and migration experiences.
The 2000 and 2010 Censuses have several limitations. Since the post-enumeration survey data collected after the 2000 Census is unavailable, it is impossible to assess the quality of the 2000 Census and whether the results required adjustment. Furthermore, the microdata from the 2000 Census is less representative of the national population than the microdata from the 2010 Census. While the post-enumeration survey conducted after the 2010 Census revealed no need to adjust the final results, the 2010 Census reportedly struggled to enumerate highly mobile populations like thekayayei
(Daily Express 2010). It is possible that such migrant groups may be underrepresented, particularly if enumerators attempted to enumerate them during working hours or were unprepared to capture mobile populations’ large numbers. Additional data limitations include possible reference period error for the question asking about place of residence five years prior, potential uncertainty about exact geographic boundaries, and problems reporting age.
One particular conceptual challenge is that the census questionnaires’ understanding and measuring of migration do not capture contemporary migration patterns identified via other sources of migration data. Most movements between place of birth and current residence are missing. The censuses fail to capture cyclical and short-term migrations, which are commonplace in Ghana, as well as seasonal or repeat migrations and migration histories. The censuses also struggle to capture migration duration and meaningful data on intraregional migration, which is more common than interregional migration. These challenges have implications for the types of migrants and migrations that are identified and included in national analyses. Identifying these types of migration patterns in the census would significantly strengthen the predictive ability of regression models examining determinants of migration, as well as sex-specific differences between migrants.
The analyses conducted in this study provide a rich source of information on female migration across the lifespan that complements subnational migration studies and may have relevance in other low- and middle-income countries. Addressing the measurement and impact of female migration is an issue of importance for researchers, policymakers, and nongovernmental organizations working in the development sector. In order to better meet the varied needs of female migrants of all ages and to plan for changing population distribution within Ghana, we would make the following recommendations:
ageing. Data is needed on female migrants of all ages, not just those of reproductive or working age.
∂ While multiple surveys measure migration at the national level, the questions they use infrequently permit comparative analyses across time or across surveys. Standardizing questions on migration would allow for more comprehensive analyses of national trends.
∂ Survey questions on migration should expand upon basic demographic data to include migrants’ underlying motivations, migration experiences, and economic contributions.
∂ Net out-migration in the Volta Region and northern Ghana (Upper West, Upper East, and Northern Regions) may negatively affect local economies and local development efforts. Policymakers concerned about the impact of this productive female labour loss should consider focused interventions in these rural regions to reduce poverty and develop greater economic opportunities for girls and women.
Ultimately, female migration is a dynamic process with inextricable links to development, affecting factors such as the development of communities, the delivery of social services, and the impact of remittances. Should current trends continue, female migration within Africa will rise, particularly to regions offering economic opportunities. The planning of development programmes requires far better data sources than those currently existing, as well as greater attention to analyses using a gendered lens.
6. Acknowledgements
References
Addoquaye Tagoe, C. and Kwankye, S.O. (2009). Returning home and re-integrating as an independent child migrant in Ghana. In: Anarfi, J.K. and Kwankye, S.O. (eds.). Independent migration of children in Ghana. Accra: Sundel Services: 206–247.
Agyei, J. and Ofosu-Mensah Ababio, E. (2009). Historical overview of internal migration in Ghana. In: Anarfi, J.K. and Kwankye, S.O. (eds.). Independent migration of children in Ghana. Accra: Sundel Services: 9–44.
Anarfi, J.K. and Agyei, J. (2009). To move or not to move: The decision-making process of child migrants from northern to southern Ghana. In: Anarfi, J.K. and Kwankye, S.O. (eds.). Independent migration of children in Ghana. Accra: Sundel Services: 101–131.
Anarfi, J.K. and Appiah, M. (2009). The phenomenon of independent child migration in Ghana in the context of a globalised world. In: Anarfi, J.K. and Kwankye, S.O. (eds.).Independent migration of children in Ghana. Accra: Sundel Services: 45– 70.
Anarfi, J.K. and Kwankye, S.O. (2009).Independent migration of children in Ghana. Legon: Sundel Services.
Awumbila, M. and Ardayfio-Schandorf, E. (2008). Gendered poverty, migration and livelihood strategies of female porters in Accra, Ghana. Norsk Geografisk Tidsskrift – Norwegian Journal of Geography 62(3): 171–179. doi:10.1080/ 00291950802335772.
Beegle, K. and Poulin, M. (2013). Migration and the transition to adulthood in contemporary Malawi.Annals of the American Academy of Political and Social Science 648(1): 38–51.doi:10.1177/0002716213481329.
Caldwell, J.C. (1969). African rural–urban migration: The movement to Ghana’s towns. London: C. Hurst.
Camlin, C.S., Snow, R.C., and Hosegood, V. (2014). Gendered patterns of migration in rural South Africa. Population Space and Place 20(6): 528–551. doi:10.1002/ psp.1794.
Contreras, R. and Griffith, D. (2012). Managing migration, managing motherhood: The moral economy of gendered migration. International Migration 50(4): 51–66.
Daily Express (September 28, 2010). ‘Kayayei’ numbers higher than anticipated.Daily Express.http://statsghana.gov.gh/docfiles/news/Kayayei.pdf.
Donato, K.M. and Gabaccia, D. (2015). Gender and international migration. New York: Russell Sage Foundation.
Dorrington, R. (2013). Estimation of migration from census data. In: Moultrie, T., Dorrington, R.E., Hill, A.G., Hill, K., Timæus, I., and Zaba, B. (eds.).Tools for demographic estimation. Paris: IUSSP: 376–389.
Elias, J. (2010). Making migrant domestic work visible: The rights based approach to migration and the ‘challenges of social reproduction.’ Review of International Political Economy 17(5): 840–859.doi:10.1080/09692290903573872.
Findley, S.E. (1989). Les migrations féminines dans les villes africaines: Une revue de leurs motivations et expériences. In. Antoine, P. and Coulibaly, S. (eds.).
L’insertion urbaine des migrants en Afrique. Paris: ORSTOM: 55–70.
Ford, K. and Hosegood, V. (2005). Aids mortality and the mobility of children in Kwazulu Natal, South Africa. Demography 42(4): 757–768. doi:10.1353/dem. 2005.0029.
Frempong-Ainguah, F., Badasu D.M., and Codjoe, S.N.A. (2009). North-South independent child migration in Ghana: The push and pull factors. In: Anarfi, J.K. and Kwankye, S.O. (eds.). Independent migration of children in Ghana. Accra: Sundel Services: 71–100.
GSS (1999). Government of Ghana 2000 Population and Housing Census: Enumerator’s manual. Accra: Ghana Statistical Service.
GSS (2003).2000 Population and Housing Census administrative report. Accra: Ghana Statistical Service.
GSS (2012). 2010 Population and Housing Census post enumeration survey report. Accra: Ghana Statistical Service.
GSS (2013a). Children, adolescents and young people. In: 2010 Population and Housing Census. Accra: Ghana Statistical Service.
GSS (2013b). 2010 Population and Housing Census: Regional analytical report: Greater Accra Region. Accra: Ghana Statistical Service.
GSS (2014). 2010 Population and Housing Census report: Fertility. Accra: Ghana Statistical Service.
GSS, GHS, and DHS Program (2015).Ghana Demographic and Health Survey 2014. Accra: Ghana Statistical Service, Ghana Health Service, and the DHS Program. GSS, GHS, and ICF Macro (1994). Ghana Demographic and Health Survey 1993.
Accra: Ghana Statistical Service, Ghana Health Service, and ICF Macro.
GSS, GHS, and ICF Macro (2009). Ghana Demographic and Health Survey 2008. Calverton: Ghana Statistical Service, Ghana Health Service, and ICF Macro. GSS and IRD (1989). Ghana Demographic and Health Survey 1988. Accra: Ghana
Statistical Service and Institute for Resource Development.
GSS and Macro International (1999). Ghana Demographic and Health Survey 1998. Accra: Ghana Statistical Service and Macro International.
GSS, NMIMR, and ICF Macro (2004).Ghana Demographic and Health Survey 2003. Calverton: Ghana Statistical Service, Noguchi Memorial Institute for Medical Research, and IFC Macro.
Guo, M., Chow, N.W.S., and Palinkas, L.A. (2011). Circular migration and life course of female domestic workers in Beijing. Asian Population Studies 7(1): 51–67.
doi:10.1080/17441730.2011.544905.
Hofmann, E.T. and Buckley, C.J. (2012). Cultural responses to changing gender patterns of migration in Georgia. International Migration 50(5): 77–94.
doi:10.1111/j.1468-2435.2010.00681.x.
Kearney, H. (November 22, 2013). Ghana’s female porters get family planning advice.
The Guardian. https://www.theguardian.com/global-development-professionals- network/2013/nov/22/ghanas-female-porters-get-family-planning-advice-case-studies.
Kwankye, S.O. and Addoquaye Tagoe, C. (2009). City life outside the home: The experiences of independent child migrants in Ghana. In: Anarfi, J.K. and Kwankye, S.O. (eds.). Independent migration of children in Ghana. Accra: Sundel Services: 132–170.
Llácer, A., Zunzunegui, M.V., del Amo, J., Mazarrasa, L., and Bolůmar, F. (2007). The contribution of a gender perspective to the understanding of migrants’ health.
Journal of Epidemiology and Community Health 61(S2): ii4–ii10.doi:10.1136/ jech.2007.061770.
Moultrie, T., Dorrington, R.E., Hill, A.G., Hill, K., Timæus I.M., and Zaba, B. (2013).
Tools for demographic estimation. Paris: IUSSP.
Parliament of the Republic of Ghana (2016). Parliamentary debates: Official report. Accra: Parliament House.
Quartey, P. and Yambilla, E. (2009). The costs and benefits of child migration in Ghana: The case of child migrants from Northern Ghana. In: Anarfi, J.K. and Kwankye, S.O. (eds.). Independent migration of children in Ghana. Accra: Sundel Services: 248–291.
Resurreccion, B.P. (2009). Female migration and social reproduction in the Mekong region. Asian and Pacific Migration Journal 18(1): 101–122. doi:10.1177/ 011719680901800105.
Rogers, A. and Castro, L.J. (1981). Model migration schedules. Laxenburg: International Institute for Applied Systems Analysis.
Spoorenberg, T. (2015).Population estimation: Regional workshop on the production of population estimates and demographic indicators. Addis Ababa: United Nations, Department of Economic and Social Affairs, Population Division. Thiel, A. and Stasik, M. (2016). Market men and station women: Changing
significations of gendered space in Accra, Ghana. Journal of Contemporary African Studies 34(4): 459–478.doi:10.1080/02589001.2017.1281385.
Toma, S. and Vause, S. (2014). Gender differences in the role of migrant networks: Comparing Congolese and Senegalese migration flows. International Migration Review 48(4): 972–997.doi:10.1111/imre.12150.
Tufuor, T., Niehof, A., Sato, C., and van der Horst, H. (2015). Extending the moral economy beyond households: Gendered livelihood strategies of single migrant women in Accra, Ghana. Women’s Studies International Forum 50: 20–29.
doi:10.1016/j.wsif.2015.02.009.
Twum-Baah, K.A., Nabila, J.S., and Aryee, A.F. (1995).Migration research study in Ghana: Volume 1: Internal migration. Accra: Ghana Statistical Service.
UNDESA (2014). World urbanization prospects: The 2014 revision, highlights. New York: United Nations.
WHO (2018). Global Health Observatory data repository: Life tables by country: Ghana. Geneva: World Health Organization.
Yeboah, I., Dodoo, F., Kwankye, S., Nyarko, P., Badasu, D., and Biavaschi, C. (2010).
Development on the move: Measuring and optimising migration’s economic and social impacts. Legon: Regional Institute for Population Studies (RIPS) at the University of Ghana and Miami University.
Appendix 1: Demographic methods
This technical appendix justifies the methods we used to analyse female migration. It also details the assumptions, applications, and limitations of these methods.
A-1.1 Rogers–Castro multiexponential model migration schedule
Following the instructions detailed in Tools for Demographic Estimation, we fitted a Rogers–Castro multiexponential model migration schedule to observed migration data in order to represent typical age patterns of migration (Rogers and Castro 1981; Little and Dorrington 2013). These migration schedules range from 7 to 13 parameters, depending on the model’s complexity, and depict the dependency between age and migration (Little and Dorrington 2013). Checking the “shape” or age distribution of migrant flows by fitting a model migration schedule also permitted us to check our estimates of net internal female migration in Section A-3.
Before applying this method, we obtained migration rates for single ages, examined the population’s age structure, and examined the relative completeness of the census counts. We assumed that (1) the census accurately counted the population by subnational region and place of birth and (2) the census identified people who moved from one region to another in the time period of interest (1995–2000).
The first step in applying this method is to prepare a schedule of the observed rates. We used census data that gave the numbers of migrants who survived the five-year migration interval 1995–2000. From this data, it is possible to calculate one-five-year age propensities by backcasting census respondents to the region where they reported living in 1995. The age-specific out-migration propensity is calculated for each one-year age group as the ratio of migrants to the number at risk of migrating over the time period (Little and Dorrington 2013).
The second step is to decide which multiexponential model best fits the data. As noted earlier (Section 4.2, Demographic structure of internal migrants), since retirement is not concentrated among specific ages in this data and the data may exaggerate older ages (Little and Dorrington 2013), we adopted the standard 7-parameter model rather than the more complex 9-, 11-, or 13-parameter models.
For the third step, fitting the model using Solver, we obtained an Excel Workbook for fitting model migration schedules directly from Professor Rob Dorrington at the University of Cape Town. Our calculations for fitting this model appear in a multipage Excel Workbook that is available upon request.
a reasonable fit. We also calculated the R-squared values for males (92%) and females (89%). Both values are acceptable compared to the established threshold of 90%, indicating that the models reasonably fit the data (Little and Dorrington 2013). T-statistics are significant at the 0.05 level for all coefficients. We also checked that the age-specific migration rates were visually compatible with the Rogers–Castro model and looked for extreme values that could distort the parameters in our model.
Since we employed census data for these models, they experience the limitations of census data detailed in our article (Section 5, Discussion). Furthermore, a limitation of this method is that without accurate, well-behaved data, it is possible that the model may be overparameterized if it does not produce a close fit (Little and Dorrington 2013). Since the lowest-parameter model best fitted the data, we are not concerned about overparameterization.
A-1.2 Logistic regression analyses
To examine the effects of demographic indicators on the likelihood of a girl or woman migrating internally in 2000 and 2010, we conducted logistic regression analyses using SPSS Statistics 22.0 software. Binary logistic regression modelled the effects of selected independent variables on whether or not a girl or woman was identified in the census as ever having migrated internally (see Table 2 for criteria used to classify migrants). International migrants were excluded. Selection of the independent variables was based on a literature review of push- and pull-factors of migration. We examined the following independent variables: age (in one-year and five-year age groups), education status (ever attended or attending school), marital status, religion, ethnicity, residence (urban, rural), work status (worked for pay, profit, or family gain; did not work), and relationship to household head.
A-1.3 Estimates of net internal female migration from place of birth data
To generate estimates of net internal female migration from census data, we followed the instructions detailed in Tools for Demographic Estimation for estimating subnational regional net in- and out-migration from place of birth data (Dorrington 2013). This estimation required the number of females, in five-year age groups, by subnational region in 2010 and by subnational region at the preceding census in 2000. For estimating deaths in this period, we calculated survival factors using model life tables from GSS (GSS 2013c).
Our assumptions are as follows:
1. Ghana’s censuses correctly identify region of birth and accurately count the population by subnational region.
2. We can accurately estimate the mortality of people moving between two regions in Ghana.
Before applying the method, Dorrington (2013) warns demographers to examine the data’s age structure of the population and the data’s relative completeness. As noted in our article (Section 3.1, Data), we assessed data quality and completeness by (1) reviewing the post-enumeration surveys conducted to assess coverage and content errors (GSS 2003, 2012) and (2) comparing key variables between the microdata and censuses. The microdata sample from the 2010 Census more accurately reflects the complete census than the microdata sample from 2000 in which the age structure differs slightly (Table 1). Unfortunately, the 2000 Census’s post-enumeration survey data is physically missing, preventing analysis of whether or not the final census results required adjustment. The 2010 Census required no adjustments based on the low net coverage error of 1.8% at the national level (GSS 2012). While this data is imperfect, it is the best currently available for estimating net internal migration in Ghana.
Dorrington (2013) also warns demographers that the estimations are sensitive to census quality: for example, inaccurately recorded place of birth (e.g., respondent may be unaware of boundary changes or may be unaware of person’s place of birth), inability to completely identify all migrants and from where they migrated (i.e., undercount), and net migration’s underestimation of migrant flows into and out of a region.
Since we had reason to believe that mortality differed between regions, using the Urban Females and Rural Females life tables produced by the GSS permitted us to better match the mortality profiles of each region. Ten-year survival factors determined by the Urban Females model life table were used to generate migration estimates for the Greater Accra (see “5S ” in the fifth column of Table A-2) and Ashanti Regions,
where the majority of girls and women reside in urban areas (90.5% and 59.6% respectively) (Figure 1). We used the GSS’s Rural Females model life table to generate ten-year survival factors used in the estimates for the other eight regions, where the rural population exceeded the urban population (see “5S ” in the fifth column of
Table A-3). The second step is to use these survival factors to estimate the number of deaths that occurred between the 2000 and 2010 Censuses. The third step is to estimate the net number of in-migrants or out-migrants.
Table A-1: Comparison of overall net migration estimates based on changes to survival factors
Overall net migration
Region
As estimated with constant survival factors for all regions, based on the WHO 2005 life table for Ghana
As estimated with separate survival factors for predominately rural or urban regions, based on Ghana’s 2010 Census life tables
% difference
Western –13,332 –13,711 –1.40
Central –18,117 –16,121 5.83
Greater Accra 318,278 300,213 2.92
Volta –105,237 –101,561 1.78
Eastern –74,510 –71,130 2.32
Ashanti 106,929 101,431 2.64
Brong Ahafo –12,627 –14,939 –8.39
Northern –111,108 –109,085 0.92
Upper East –47,941 –47,212 0.77
Upper West –41,916 –41,734 0.22
Table A-2 works through these steps for estimating the net number of female in-migrants. The second and third columns show the number of girls and women living in the Greater Accra Region who were born outside the region, as counted by the 2000 and 2010 Censuses. We calculated the ten-year survival factors (5S ) in the fifth column
time of the first census (t),5 , of those agedA–nand older at the first census, ∞ ,
and of those born between the censuses, , as follows: For those born between the two censuses
= (5 (2010)) × ((1/ , ) − 1)
= (34,950 × . − 1 = 1,410
For those aged 65 years and older at the time of the first census ∞ = (∞ (2000) × ∞ , + ∞ (2010)) × ((1/∞ , ) − 1)
= ((6,630 + 4,260 + 9,520) × 0.62448 + 14,730) × . − 1 = 8,261
For all other age groups, such as those aged 30–34 years at the time of the first census 5 = (5 (2000) × 5 , + 5 (2010)) × ((1/5 , ) − 1)
= (53,230 × 0.93040 + 57,480) × . − 1 = 4,002
where5 ( ) represents the number of people born outside the region (by age group)
according to the census at time t who were aged between x and x + 10 years.