Int. J. Industrial Mathematics Vol. 1, No. 3 (2009) 227-234
Sensitivity and Stability Radius in Data
Envelopment Analysis
A. Gholam Abria, N. Shoja a, M. Fallah Jelodar a
(a) Department of Mathematics, Islamic Azad University, Firoozkooh Branch,Firoozkooh,Iran.
|||||||||||||||||||||||||||||||-Abstract
One important issue in DEA which has been studied by many DEA researchers is the sensitivity analysis of a specic DMUo, the unit under evaluation.
Moreover, we know that in most models of DEA, the best DMUs have the eciency score of unity. In some realistic situations, the performance of some inecient DMUs is similar to that of ecient ones.
In this paper, we dene a new eciency category, namely ;quasi efficient;. Then, we
develop a procedure for performing a sensitivity analysis of the ecient and quasi-ecient decision making units.
The procedure yields an exact;stability radius;within which data variations will not alter
a DMU;s classication from ecient or quasi-ecient to inecient status (or vice versa).
Keywords: Data Envelopment Analysis, Sensitivity, Stability, Eciency, Quasi-ecient.
||||||||||||||||||||||||||||||||{
1
Introduction
Data envelopment analysis (DEA), which was introduced by Charnes et al.[6] (CCR) and extended by Banker et al.[3] (BCC), is a useful method to evaluate the relative eciency of multiple-input and multiple-output units based on observed data.
The sensitivity analysis has received much attention in recent years from researches, and so many researches have been carried out in this regard. Sensitivity analysis in DEA has been deliberated on from various points of view.
The rst DEA sensitivity analysis paper by Charnes et al.[5] examined change in a single output. This was followed by a sensitivity analysis article by Charnes and Neralic [8] in which sucient conditions for preserving eciency are determined. Another type of DEA sensitivity analysis is based on the super-eciency DEA approach in which the DMU under evaluation is not included in the reference set[1, 15]. Charnes et al.[7, 9]
developed a super-eciency DEA sensitivity analysis technique for the situation where simultaneous proportional change is assumed in all inputs and outputs for a specic DMU under consideration. This data variation condition is relaxed in Zhu [16] and Seiford[15] to a situation where inputs or outputs can be changed individually and the largest stability region that encompasses that of Charnes et al.[7] is obtained.
Especially, some valuable researches have been on sensitivity analysis of extreme ecient units that lead to reaching the stability regions of these units. The rst attempt was made to reach the input and output stability region for extreme ecient units by Seiford and Zhu[14]. These regions are those within which variations of inputs or outputs cause no change in the DMU class. In other words, after any kind of interior variation, the extreme ecient unit under evaluation remains ecient. Jahanshahloo et al.[13] proposed a method that requires a less complex computational process and overcomes some diculties in the previous method.
The DEA sensitivity analysis methods we have just reviewed are all developed for the situation where data variations are only applied to the ecient DMU under evaluation and the data for the remaining DMUs are assumed xed.
In this paper, we develop a procedure for performing a sensitivity analysis of the ecient and quasi-ecient DMUs.
The procedure yields an exact;stability radius;within which data variations will not alter
a DMU;s classication from ecient or quasi-ecient to inecient status (or vice versa).
The current paper proceeds as follows. Section 2 discusses the basic DEA models. Section 3 develops our proposed method for nding the;stability radius;, and section 4 provides
a numerical example. Finally, conclusions are given in section 5.
2 DEA Background
Data Envelopment Analysis (DEA) is a technique that has been used widely in the sup-ply chain management literature. This non-parametric, multi-factor approach enhances our ability to capture the multi-dimensionality of performance discussed earlier. More formally, DEA is a mathematical programming technique for measuring the relative ef-ciency of decision making units (DMUs), where each DMU has a set of inputs used to produce a set of outputs [2].
Consider DMUj; (j = 1; :::; n), where each DMU consumes m inputs to produce s
out-puts. Suppose the observed input and output vectors of DMUj are Xj = (x1j; :::; xmj)
and Yj = (y1j; :::; ysj), respectively, and let Xj 0, Xj 6= 0, Yj 0, and Yj 6= 0.
The production possibility set Tc is dened as:
Tc=
n
(X; Y ) j X Xn
j=1
jXj; Y n
X
j=1
jYj ; j 0; j = 1; : : : ; n
o .
By the stated denition, the CCR model is as follows:
Min s:t: Xn
j=1
jxij xio; i = 1; : : : ; m
n
X
j=1
jyrj yro; r = 1; : : : ; s
j 0; j = 1; : : : ; n
Moreover, the production possibility set Tv is dened as:
Tv=
n
(X; Y ) j X Xn
j=1
jXj; Y n
X
j=1
jYj; n
X
j=1
j = 1; j 0; j = 1; : : : ; n
o .
By the above denition, the BCC model is: Min
s:t: Xn
j=1
jxij xio; i = 1; : : : ; m
n
X
j=1
jyrj yro; r = 1; : : : ; s
n
X
j=1
j = 1
j 0; j = 1; : : : ; n
(2.2)
Furthermore, the multiplier form of the BCC model is as follows:
BCC model
Max
s
X
r=1
uryro+ uo
s:t: Xs
r=1
uryrj m
X
i=1
vixij + uo 0 ; j = 1; ; n m
X
i=1
vixio = 1
vi 0 ; i = 1; :::; m
ur 0 ; r = 1; :::; s
(2.3)
In what follows, two sensitivity analysis models for ecient and inecient units are reconsidered as a reminder. Having identied ecient and inecient DMUs in a DEA analysis, one may want to know how sensitive these identications are, for possible vari-ations in the data. The basic idea is to use concepts such as "distance" or "norm" (= length of a vector), as dened in the mathematical literature dealing with metric spaces, and use these concepts to determine "radii of stability", within which data variations will not alter a DMU;s classication from ecient to inecient status (or vice versa) [10].
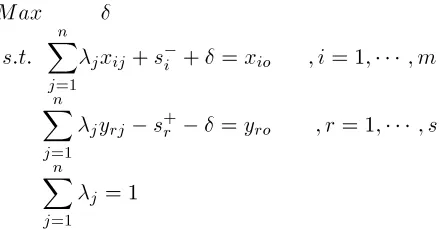
A new avenue for sensitivity analysis was opened by charnes et al [9]. The proposed model for nding the ;stability radius; of ecient DMUs is as follows:
Min s:t: Xn
j=1;j6=o
jxij + si = xio ; i = 1; ; m
n
X
j=1;j6=o
jyrj s+r + = yro ; r = 1; ; s
n
X
j=1;j6=o
j = 1
(2.4)
Here, all variables are constrained to be non-negative.
a DMU;s classication from ecient to inecient status (or vice versa).
Similarly the model proposed for nding the ;stability radius; of inecient DMUs by
Charnes et al. [7] is as follows:
Max s:t:
n
X
j=1
jxij + si + = xio ; i = 1; ; m n
X
j=1
jyrj s+r = yro ; r = 1; ; s
n
X
j=1
j = 1
(2.5)
Here, again, all variables are constrained to be non-negative.
The above formulations pertain to an inecient DMU, which continues to be inecient for all data alterations which yield improvements from xio to xio and from yro to
yro+ .
This means that no reclassication to ecient status will occur within the open set dened by the value of > 0,[10].
3 Proposed Model
In some realistic situations, we know the performance of some inecient DMUs is similar to that of ecient DMUs. This similarity leads us to suggesting a new denition.
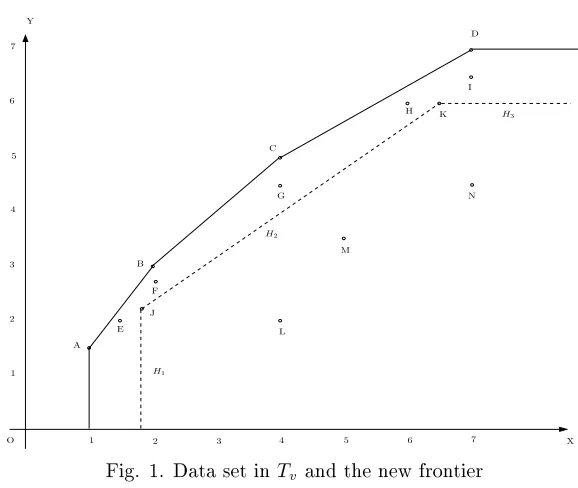
For this purpose, rst consider the following data set. The data are summarized in Table 1 and are illustrated in Figure 1:
Table 1
Data
DMUs A B C D E F G H I J K L M N
Input 1 2 4 7 1.5 2.1 4 6 7 1.8 6.5 4 5 7
1 2 3 4 5 6 7
Y
1 2 3 4 5 6 7 X
O A
B
C
D
L M
N
E F
G
H I
J
K
H1
H2
H3
Fig. 1. Data set in Tv and the new frontier
Fig. 1 exhibits 14 DMUs, each with one input and one output. By evaluating these DMUs by model (2), we nd out that DMUs A,B,C and D are ecient. In addition, the perfor-mance of units E,F,G,H,I,J,K is similar to that of the ecient DMUs. So, we introduce a new denition. To do so, we focus on the inecient DMUs. We assume DMUo is an
arbitrary inecient DMU and we sort out the inecient DMUs according to eciency scores as follows:
(a). If
o ( is the eciency score determined by the conditions of the situation),
DMUo is called completely inecient.
(b). If the eciency score of DMUois close to 1( o ! 1), DMUois called quasi-ecient.
Since the focus is on the stability of the classication of DMUs into ecient and inecient performers, ecient and quasi-ecient DMUs are considered to belong to the same class. The basic idea is to use concepts such as;distance;or;norm;(=length of a vector), and to
employ these concepts to determine the;stability radius;within which data variations will
not alter a DMU;s classication from ecient or quasi-ecient to completely inecient
status (or vice versa).
In order to help our development, we classify the set of n DMUs into three classes: (i) class 1 contains all ecient DMUs;
(ii) class 2 contains quasi-ecient DMUs ( o ! 1);
(iii) class 3 contains completely inecient DMUs (o ).
In what follows, we apply the following procedure:
Step 1 : Use model (2.2) to determine all ecient, quasi-ecient and completely inef-cient DMUs.
Next, remove ecient DMUs.
Step 2 : Solve model (2.2) for the remaining DMUs. If the eciency scores of all ecient DMUs equal one, then stop, and go to step (4). Otherwise, exclude the quasi-ecient DMUs whose eciency scores become one, and go to step (3).
the quasi-ecient DMUs whose eciency scores equal one, and repeat step (3).
Step 4 : Determine the quasi-ecient DMUs whose eciency scores equalled one in the previous steps (whether it be step 2 or step 3).
Let 4 = fDMU1; DMU2; :::; DMUhg be the set of these DMUs. By applying the BCC
multiplier model to the members of 4, the new frontier is constructed.
Step5 : Let (
= (1
[
2)=4 = fDMU1; DMU2; :::; DMUlg
0 = (3
[
4) = fDMUj1; DMUj2; :::; DMUjeg
Next, add each member of to 0 one by one, which is done as follows: 1 = fDMUj1; DMUj2; :::; DMUje; DMU1g
2 = fDMUj1; DMUj2; :::; DMUje; DMU2g
l= fDMUj1; DMUj2; :::; DMUje; DMUlg
Then, we use model (2.4) for i, for each i 2 f1; 2; :::; lg, and we obtain the stability radii
for DMU1; DMU2; :::; DMUl (1; 2; :::; l).
4 Example
Recall the above mentioned example. First, we apply model (2.2). The results are summarized in Table 2:
Table 2
Results of step 1.
DMUs A B C D E F G H I J K L M N
1 1 1 1 0.889 0.857 0.875 0.917 0.893 0.815 0.846 0.334 0.500 0.500
By assuming = 0:7, it can be seen that units A,B,C,D are ecient and units E,F,G,H,I,J,K are quasi-ecient. Moreover, L,M,N are completely inecient. So we set:
1= fA; B; C; Dg.
2= fE; F; G; H; I; J; Kg.
3= fL; M; Ng.
Next, we remove A,B,C,D (ecient DMUs) and use model (2.2) for the remaining DMUs. The results are summarized in Table 3:
Table 3
Results of step 2.
DMUs E F G H I J K L M N
1 1 1 1 1 0.929 0.923 0.375 0.589 0.571
Then, we omit E,F,G,H,I and apply model (2.2) for the remaining DMUs. The results are summarized in Table 4:
Table 4
Results of step 3.
DMUs J K L M N
Let 4 = fJ; Kg.
The BCC multiplier model can be applied for to members of 4 and the supporting
hy-perplanes are found in step (4). These hyhy-perplanes are as follows: H1= f(x; y)jx = 1:8g
H2= f(x; y)jy 0:808x 0:75 = 0g
H3= f(x; y)jy = 6g
Finally, let = (1S2)=4= fA; B; C; D; E; F; G; H; Ig and 0 = 3S4 = fL; M; N; J; Kg.
Next, we add each member of to 0 one by one as follows: 1 = fL; M; N; J; K; Ag
2 = fL; M; N; J; K; Bg
9 = fL; M; N; J; K; Ig
Then, we use model (2.4) for i, for each i 2 f1; 2; :::; 9g, and obtain the stability radii for
A,B,C,D,E,F,G,H,I (
A; B; :::; I).
The results are summarized in Table 5:
Table 5
Results of step 5.
DMUs A B C D E F G H I
0.8000 0.3529 0.5647 1.0000 0.3000 0.1424 0.2882 0.2235 0.5000
5 Conclusions
One research issue which has received widespread attention in the rapidly growing eld of DEA is the sensitivity of the results of an analysis to perturbations in the data.
In some real situations, the performance of some inecient DMUs is similar to ecient ones.
In such cases, as we know, inecient units are divided into two categories. The inecient units whose performance is completely poor and those whose performance is closer to ecient units and whose eciency scores are closer to one. So, it is necessary to distinguish between these units and completely inecient units. A new denition is hence presented in this paper for these units and they are termed;quasi efficient;units. Furthermore,
ecient and;quasi efficient;units are considered to belong in the ecient category (In
this category, the score of all units is not necessarily one ) and the sensitivity analysis of these units in relation to completely inecient units is discussed.
The procedure results in an exact;stability radius; within which data variations will not
alter a DMU;s classication from ecient or quasi-ecient to completely inecient status
(or vice versa).
References
[2] Anthony Ross, Kathryn Ernstberger, 2006. Benchmarking the IT Productivity Para-dox: Recent evidence from the manufacturing sector. Mathematical and Computer Modelling 44, 30-42.
[3] Banker, R.D., Charnes, A., Cooper, W.W., 1984. Some models for estimating techni-cal and stechni-cale ineciencies in data envelopment analysis. Management Science 30 (9), 1078-1092.
[4] Charnes, A., Cooper, W.W., Golany, B., Seiford, L. Stutz, J.,1985b. Foundation of data envelopment analysis for Pareto-Koopmans ecient empirical production func-tions. Journal of Econometrics 30, 91-107.
[5] Charnes, A., Cooper W.W. Lewin A.Y. Morey R.C. and Rousseau J.(1985). Sensitiv-ity and stabilSensitiv-ity analysis in DEA. Ann Opns Res 2: 139-156.
[6] Charnes, A., Cooper, W.W., Rhodes, E., 1978. Measuring the eciency of decision making units. European Journal of Operational Research 2, 429-444.
[7] Charnes, A., Haag S, Jaska, P., and Semple, J. (1992). Sensitivity of eciency clas-sications in the additive model of data envelopment analysis. Int J Syst Sci 23: 789-798.
[8] Charnes, A., and Neralic, L. (1990).Sensitivity analysis of the additive model in data envelopment analysis. European Journal of Operational Research 48: 332-341 [9] Charnes, A., Rousseau, J., and Semple, J. (1996). Sensitivity and stability of eciency
classications in data envelopment analysis.Journal of Productivity Analysis 7: 5-18. [10] Cooper, W.W., Shanling Li, Seiford,L.M.,Tone,K.,Thrall,R.M,Zhu,J., 2001. Sensitiv-ity and StabilSensitiv-ity Analysis in DEA: Some Recent Developments. Journal of Produc-tivity Analysis 15,217-246.
[11] Cooper, W.W., Seiford, L., Tone, K., 2002. Data envelopment analysis a compre-hensive text with Models applications, references and DEA solver software. Third Printing. Kluwer Academic Publishers.
[12] Fare, R., Grosskopf, S., Lovell, C.A.K., 1994. Production frontiers, Cambridge Uni-versity Press, New York.
[13] Jahanshahloo, G.R., Hosseinzadeh Lot,F., Shoja,N., Sanei,M.,Tohidi,G.,2005. Sen-sitivity and Stability analysis in DEA. Applied Mathematics and Computation,169, 897-904.
[14] Seiford, Lawrence M.,Zhu,J.,1998. Stability regions for maintaining eciency in data envelopment analysis. European Journal of Operational Research 108, 127-139. [15] Seiford, Lawrence M., Zhu, J.,1999. Infeasibility of super eciency data envelopment
analysis models. INFOR 37:174-187