________________________________
Author for Correspondence: B. Shirisha
Research Article
ISSN Print 2231 – 3648 Online 2231 – 3656
Available Online at: www.ijpir.com
Formulation and evaluation of colon ivermectin immediate release tablets
by using natural polymers
B. Shirisha*
1, M. Ajitha
2 1CMR College of Pharmacy, Kandlakoya (V), Medchal, Hyderabad
2
Jawaharlal Nehru Technological University, IST, CPS, Hyderabad.
ABSTRACT
In the present study it has been aimed at developing pH sensitive tablets of Ivermectin for local action in proximal colon, with a view of minimizing the drug release in the physiological environment of stomach and small intestine and to ensure maximum drug release in the physiological environment of proximal colon with an improved patient compliance, least side effects, better drug therapy and all aspects of an ideal drug delivery system. In present work attempt was made to formulate and evaluate colon tablets of ivermectin. Attempts were made to achieve immediate drug release from the dosage form. Twenty seven formulations (F1-F27) were prepared by direct compression method using 33 Response surface method where 33 indicates 3 variables and 3 levels of natural superdisintegrants like Gellan Gum, Locust bean Gum and Fenugreek seed Gum (low, middle and high concentrations) by using Design of experiment software. In the Preformulation properties was carried out and the values obtained were within the range. And FTIR studies results revealed that there was no incompatibility between drug and excipients. Thus, colon Tablets were formulated by varying proportions of natural superdisintegrants by direct compression method and all formulations were coated by Eudragit RS 100 coating solution which is a pH sensitive polymer to prevent drug release in stomach and intestine. Entire drug will release in proximal part of colon.
Keywords:
Ivermectin, Superdisintegrants, Gellan Gum, Locust bean Gum and Fenugreek seed GumINTRODUCTION
The oral route of drug administration is the most convenient and important method of administering drugs for systemic effect. Nearly 50% of the drug delivery systems available in the market are oral D.D.S. and these systems have more advantages due to patient acceptance and ease
of administration [1, 2] . During the last decade there has been interest in developing site-specific formulations for targeting drug to the colon. Colonic drug delivery has gained increased importance not just for the delivery of the drugs for the treatment of local diseases associated with the colon like Crohn’s disease, ulcerative colitis, irritable bowel syndrome and constipation but also
for the systemic delivery of proteins, therapeutic peptides, antiasthmatic drugs, antihypertensive drugs and antidiabetic agents [3, 4] . There are various methods or techniques through which colon drug targeting can be achieved, for example, formation of prodrug, coating with pH-sensitive polymers, coating with biodegradable polymers, designing formulations using polysaccharides, timed released systems, pressure controlled drug delivery systems, osmotic pressure controlled systems [5, 6] . Coating of the drugs with pH sensitive polymers provides simple approach for colon specific drug delivery.
In the present study it has been aimed at developing pH sensitive tablets of Ivermectin for local action in proximal colon, with a view of minimizing the drug release in the physiological environment of stomach and small intestine and to ensure maximum drug release in the physiological environment of proximal colon with an improved patient compliance, least side effects, better drug therapy and all aspects of an ideal drug delivery system.
MATERIALS AND METHODS
Estimation of Ivermectin [7, 8, 9]
The following methods are available for the estimation of Ivermectin.
Spectrophotometric method
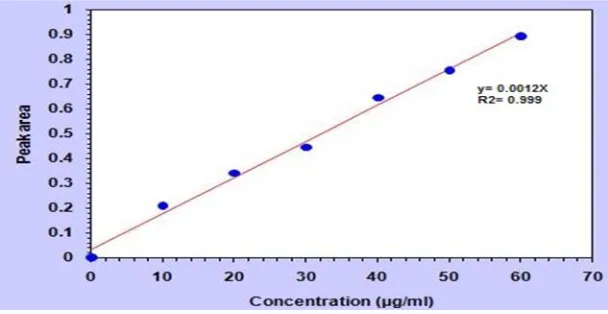
The predetermined maxima wavelength i.e., 254 nm in 0.1N HCl, Phosphate buffer pH 6.8 and Phosphate buffer pH 7.4 was adopted in the assessment of Ivermectin in dissolution and assay techniques.
Standard solution
100 mg of Ivermectin was dissolved in solvents like 0.1N HCl, Phosphate buffer pH 6.8 and Phosphate buffer pH 7.4 in100mL volumetric flasks separately and the solution was made up to volume with rest solvent.
Preparation of colon tablets of Ivermectin
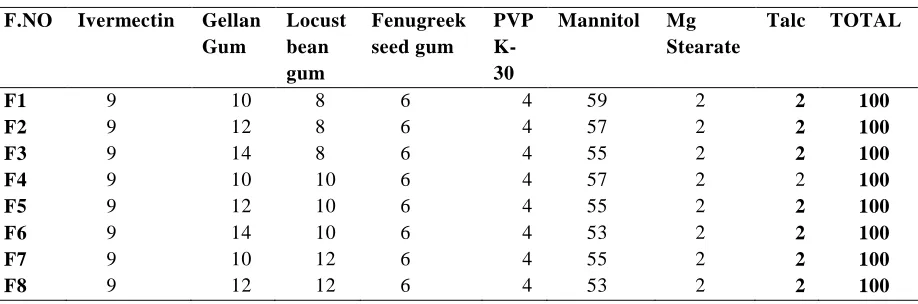
Twenty seven formulations (F1-F27) were prepared by direct compression method using 33 Response surface method (3 variables and 3 levels of polymers) by using Design of experiment software with natural superdisintegrants like Gellan Gum, Locust bean Gum and Fenugreek seed Gum. All the formulations were varied in concentration of natural superdisintegrants, magnesium stearate constituted in all the formulations. All the ingredients were passed through sieve no 85# and were mixed uniformly. Direct compression was carried out with sufficient quantity of binder (PVP K 30). Tablets were compressed with 6 mm flat punch (Cadmach, Ahmedabad, India) [10].pH sensitive coating of prepared compression
tablets
Compression tablets of ivermectin were further coated with pH sensitive coating polymers by dip coating method. Required quantity of Eudragit RS 100 was dissolved in acetone using a magnetic stirrer. After complete solubilisation of polymer, castor oil (10% w/w of dry polymer) was added as plasticizer. Talc (0.1% w/v) was added as antiadherant and the solution was stirred for 15 min. Pre-weighted compression tablets were dipped for 3-5 times into the solution until 10% weight gain [11].
Table 1: Formulation trials of colon tablets of Ivermectin F.NO Ivermectin Gellan
Gum Locust bean gum Fenugreek seed gum PVP K-30
Mannitol Mg Stearate
Talc TOTAL
F1 9 10 8 6 4 59 2 2 100
F2 9 12 8 6 4 57 2 2 100
F3 9 14 8 6 4 55 2 2 100
F4 9 10 10 6 4 57 2 2 100
F5 9 12 10 6 4 55 2 2 100
F6 9 14 10 6 4 53 2 2 100
F7 9 10 12 6 4 55 2 2 100
F9 9 14 12 6 4 51 2 2 100
F10 9 10 8 8 4 57 2 2 100
F11 9 12 8 8 4 55 2 2 100
F12 9 14 8 8 4 53 2 2 100
F13 9 10 10 8 4 53 2 2 100
F14 9 12 10 8 4 53 2 2 100
F15 9 14 10 8 4 51 2 2 100
F16 9 10 12 8 4 53 2 2 100
F17 9 12 12 8 4 51 2 2 100
F18 9 14 12 8 4 51 2 2 100
F19 9 10 8 10 4 55 2 2 100
F20 9 12 8 10 4 53 2 2 100
F21 9 14 8 10 4 51 2 2 100
F22 9 10 10 10 4 53 2 2 100
F23 9 12 10 10 4 51 2 2 100
F24 9 14 10 10 4 49 2 2 100
F25 9 10 12 10 4 51 2 2 100
F26 9 12 12 10 4 49 2 2 100
F27 9 14 12 10 4 47 2 2 100
Table 2: Composition of coating solution
S. No Composition Quantity
1 Eudragit RS 100 10% w/v
2 Acetone 95 ml
3 Water 5 ml
4 Castor oil 0.1% w/v
5 Talc 0.1% w/v
Total weight gain + 10% w/v
EVALUATION TESTS
Pre compression evaluation tests [12, 13, 14]
Angle of repose, bulk density, tapped density, compressibility index (carr’s index), hausner’s ratio were performedPOST
COMPRESSION
EVALUATION
TESTS
Weight variations, Thicknesses, Hardness, Friability, and Content Uniformity were performed
In-vitro disintegration time
The USP device to rest disintegration was six glass tubes that are “3 long, open at the top, and held against 10” screen at the bottom end of the basket rack assembly. One tablet is placed in each tube and the basket rack is poisoned in 1 liter beaker of buffer at 37± 2 0C, such that the tablets
remain below the surface of the liquid on their upward movement and descend not closer than 2.5cm from the bottom of the beaker.
In Vitro
Drug Dissolution Study
The dissolution of prepared colon tablet formulations was carried out by obeying below conditions; Dissolution Apparatus USP Dissolution Apparatus Type II (Paddle), Dissolution Medium 0.1N HCL pH 1.2Phosphate buffer pH 6.8 Phosphate buffer (pH 7.4), Dissolution Medium Volume was 900ml, Temperature was 37±0.2°C, Estimation was 254 in UV Spectrophotometer, Time Intervals (Hours) 12,3,4,5,6 & 7
Kinetic Model Fitting [15, 16, 17]
compare test and Reference dissolution profiles are as follows:
Zero order kinetics
First order kinetics
Higuchi
Korsmeyer-Peppas model
Drug-excipient compatibility studies
While development of new drug delivery systems the drug will be influenced a lot by excipients and solvents used and may lead to degradation of drug so, the stability and purity
of the drug (Ivermectin) in presence of other excipients before formulation were determined by various techniques like Infrared Spectroscopy (IR) with which future complications can be investigated and predicted. [18]
Compatibility check by FTIR Studies
FTIR spectra of Pure Drug sample and its physical mixture along with formulation additives of colon tablets and Optimized formulation were testaments with FTIR instrument.
Table 3: Kinetic Model Fitting
Release exponent (n) Drug transport mechanism Rate as a function of time
0.5 Fickian diffusion t-0.5
0.5<n<1.0 Anomalous transport tn-1
1.0 Case-II transport Zero-order release
Higher than 1.0 Super Case-II transport tn-1
This type of analysis of release behavior is valuable is to the formulator for comparative purposes. The Release exponent can be obtained from the slope and the Constant (Kk) obtained from
the intercept of the graphical relation between logarithmic versions of left side of the equation versus log t.
Stability studies
Among all tablets compressed of distinct batches, mucoadhesive tablets were subjected to
immutability studies in accordance with guidelines of ICH stability protocol. The test specifications include Temperature of 40 0C ± 2 0C and relative humidity of 75±5% RH for a time period of 6 months in Humidity chamber (REMI, Mumbai). The specifications to be evaluated in stability study period include Content Uniformity, Hardness and in vitro drug release [19]
RESULTS AND DISCUSSION
FTIR Spectrum of pure ivermectin
Figure 2: FTIR Spectrum of pure ivermectin Table 4: FTIR interpretation of ivermectin
Functional groups Reference peak (cm-1) Observed peak(cm-1)
Cyclic amines 3200-3500 3250
C-H stretching 3000-2840 2950
O-H bending 1470-1395 1459.20
C-Cl 1000-925 990.91
FTIR Spectrum Ivermectin optimized formulation
Figure 3: FTIR Spectrum Ivermectin optimized formulation Table5: FTIR interpretation of ivermectin optimized formulation Functional groups Reference peak (cm-1) Observed peak(cm-1)
Cyclic amines 3200-3500 3281.89
C-H stretching 3000-2840 2949.44
O-H bending 1470-1395 1462.08
Physical parameters of prepared powder blends of colon DDS
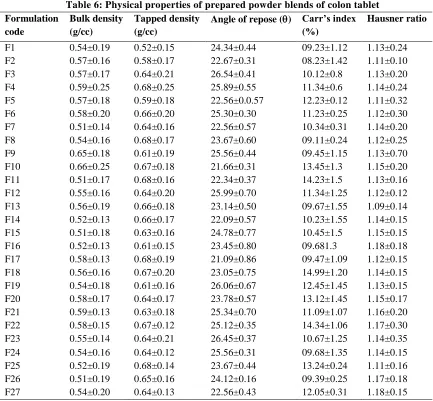
Table 6: Physical properties of prepared powder blends of colon tablet Formulation
code
Bulk density (g/cc)
Tapped density (g/cc)
Angle of repose () Carr’s index (%)
Hausner ratio
F1 0.54±0.19 0.52±0.15 24.34±0.44 09.23±1.12 1.13±0.24
F2 0.57±0.16 0.58±0.17 22.67±0.31 08.23±1.42 1.11±0.10
F3 0.57±0.17 0.64±0.21 26.54±0.41 10.12±0.8 1.13±0.20
F4 0.59±0.25 0.68±0.25 25.89±0.55 11.34±0.6 1.14±0.24
F5 0.57±0.18 0.59±0.18 22.56±0.0.57 12.23±0.12 1.11±0.32
F6 0.58±0.20 0.66±0.20 25.30±0.30 11.23±0.25 1.12±0.30
F7 0.51±0.14 0.64±0.16 22.56±0.57 10.34±0.31 1.14±0.20
F8 0.54±0.16 0.68±0.17 23.67±0.60 09.11±0.24 1.12±0.25
F9 0.65±0.18 0.61±0.19 25.56±0.44 09.45±1.15 1.13±0.70
F10 0.66±0.25 0.67±0.18 21.66±0.31 13.45±1.3 1.15±0.20
F11 0.51±0.17 0.68±0.16 22.34±0.37 14.23±1.5 1.13±0.16
F12 0.55±0.16 0.64±0.20 25.99±0.70 11.34±1.25 1.12±0.12
F13 0.56±0.19 0.66±0.18 23.14±0.50 09.67±1.55 1.09±0.14
F14 0.52±0.13 0.66±0.17 22.09±0.57 10.23±1.55 1.14±0.15
F15 0.51±0.18 0.63±0.16 24.78±0.77 10.45±1.5 1.15±0.15
F16 0.52±0.13 0.61±0.15 23.45±0.80 09.681.3 1.18±0.18
F17 0.58±0.13 0.68±0.19 21.09±0.86 09.47±1.09 1.12±0.15
F18 0.56±0.16 0.67±0.20 23.05±0.75 14.99±1.20 1.14±0.15
F19 0.54±0.18 0.61±0.16 26.06±0.67 12.45±1.45 1.13±0.15
F20 0.58±0.17 0.64±0.17 23.78±0.57 13.12±1.45 1.15±0.17
F21 0.59±0.13 0.63±0.18 25.34±0.70 11.09±1.07 1.16±0.20
F22 0.58±0.15 0.67±0.12 25.12±0.35 14.34±1.06 1.17±0.30
F23 0.55±0.14 0.64±0.21 26.45±0.37 10.67±1.25 1.14±0.35
F24 0.54±0.16 0.64±0.12 25.56±0.31 09.68±1.35 1.14±0.15
F25 0.52±0.19 0.68±0.14 23.67±0.44 13.24±0.24 1.11±0.16
F26 0.51±0.19 0.65±0.16 24.12±0.16 09.39±0.25 1.17±0.18
F27 0.54±0.20 0.64±0.13 22.56±0.43 12.05±0.31 1.18±0.15
Above parameters are communicated as Average ± Standard Deviation; (n=3)
The results of bulk densities formulations bearing F1 to F27 reported being in the range of 0.51g/cc to 0.66g/cc. The findings of tapped density formulations F1 to F27 reported being in the range of 0.52g/cc³ to 0.68g/cc³. The angle of repose of all the formulations was found satisfactory results. The formulation F17 was found to be 21.09 having good flow property.
The compressibility index values were found to be in the range of 8 to 15 %. These findings indicated that the all the batches of formulations exhibited good flow properties.
The Hausner’s ratio values in the range of 1.11 to 1.18 %. These findings indicated that the all the batches of formulations exhibited good flow properties.
Physico-chemical properties of ivermectin
colon tablets
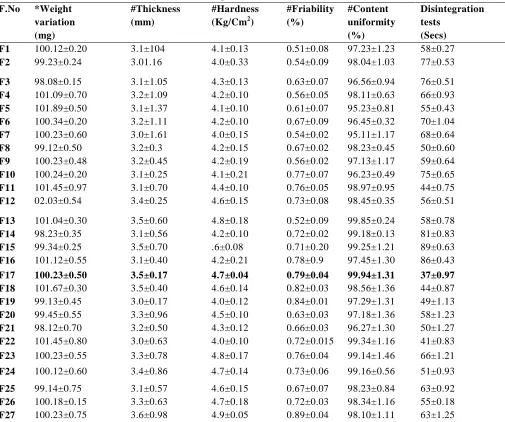
Table 7: Physico-chemical parameters of ivermectin colon core tablets F.No *Weight
variation (mg)
#Thickness (mm)
#Hardness (Kg/Cm2)
#Friability (%)
#Content uniformity (%)
Disintegration tests
(Secs)
F1 100.12±0.20 3.1±104 4.1±0.13 0.51±0.08 97.23±1.23 58±0.27
F2 99.23±0.24 3.01.16 4.0±0.33 0.54±0.09 98.04±1.03 77±0.53
F3 98.08±0.15 3.1±1.05 4.3±0.13 0.63±0.07 96.56±0.94 76±0.51
F4 101.09±0.70 3.2±1.09 4.2±0.10 0.56±0.05 98.11±0.63 66±0.93
F5 101.89±0.50 3.1±1.37 4.1±0.10 0.61±0.07 95.23±0.81 55±0.43
F6 100.34±0.20 3.2±1.11 4.2±0.10 0.67±0.09 96.45±0.32 70±1.04
F7 100.23±0.60 3.0±1.61 4.0±0.15 0.54±0.02 95.11±1.17 68±0.64
F8 99.12±0.50 3.2±0.3 4.2±0.15 0.67±0.02 98.23±0.45 50±0.60
F9 100.23±0.48 3.2±0.45 4.2±0.19 0.56±0.02 97.13±1.17 59±0.64
F10 100.24±0.20 3.1±0.25 4.1±0.21 0.77±0.07 96.23±0.49 75±0.65
F11 101.45±0.97 3.1±0.70 4.4±0.10 0.76±0.05 98.97±0.95 44±0.75
F12 02.03±0.54 3.4±0.25 4.6±0.15 0.73±0.08 98.45±0.35 56±0.51
F13 101.04±0.30 3.5±0.60 4.8±0.18 0.52±0.09 99.85±0.24 58±0.78
F14 98.23±0.35 3.1±0.56 4.2±0.10 0.72±0.02 99.18±0.13 81±0.83
F15 99.34±0.25 3.5±0.70 .6±0.08 0.71±0.20 99.25±1.21 89±0.63
F16 101.12±0.55 3.1±0.40 4.2±0.21 0.78±0.9 97.45±1.30 86±0.43
F17 100.23±0.50 3.5±0.17 4.7±0.04 0.79±0.04 99.94±1.31 37±0.97
F18 101.67±0.30 3.5±0.40 4.6±0.14 0.82±0.03 98.56±1.36 44±0.87
F19 99.13±0.45 3.0±0.17 4.0±0.12 0.84±0.01 97.29±1.31 49±1.13
F20 99.45±0.55 3.3±0.96 4.5±0.10 0.63±0.03 97.18±1.36 58±1.23
F21 98.12±0.70 3.2±0.50 4.3±0.12 0.66±0.03 96.27±1.30 50±1.27
F22 101.45±0.80 3.0±0.63 4.0±0.10 0.72±0.015 99.34±1.16 41±0.83
F23 100.23±0.55 3.3±0.78 4.8±0.17 0.76±0.04 99.14±1.46 66±1.21
F24 100.12±0.60 3.4±0.86 4.7±0.14 0.73±0.06 99.16±0.56 51±0.93
F25 99.14±0.75 3.1±0.57 4.6±0.15 0.67±0.07 98.23±0.84 63±0.92
F26 100.18±0.15 3.3±0.63 4.7±0.18 0.72±0.03 98.34±1.16 55±0.18
F27 100.23±0.75 3.6±0.98 4.9±0.05 0.89±0.04 98.10±1.11 63±1.25
*Values are expressed in mean± SD :( n=20) #Values are expressed in mean± SD :( n=3)
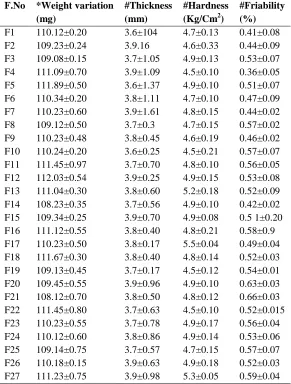
The Weight variation of all formulations within the limit because weight variation deviation is ± 5 for tablet and weight above 100 mg. The measured hardness of the tablets of each batch of all formulations i.e. F1 to F27 was ranged between 4.0 to 5.0 Kg/cm2 and the results are shown in Table…. The thickness of the tablets was found to be almost uniform in all formulations F1 to F27. The thickness of all the formulations between the ranges 3.0-3.6 mm.
The friability of all prepared formulation is between 0.53-0.89.the friability properties limits are in between 0-1%. The drug content of all formulation is in between 95.00-99.94%, drug content depends on the angle of repose since the angle of repose indicates uniform flow nature of powder blend which makes the drug to evenly distribute in all the formulation and to maintain content uniformity in all batches.
F.No *Weight variation (mg)
#Thickness (mm)
#Hardness (Kg/Cm2)
#Friability (%) F1 110.12±0.20 3.6±104 4.7±0.13 0.41±0.08 F2 109.23±0.24 3.9.16 4.6±0.33 0.44±0.09 F3 109.08±0.15 3.7±1.05 4.9±0.13 0.53±0.07 F4 111.09±0.70 3.9±1.09 4.5±0.10 0.36±0.05 F5 111.89±0.50 3.6±1.37 4.9±0.10 0.51±0.07 F6 110.34±0.20 3.8±1.11 4.7±0.10 0.47±0.09 F7 110.23±0.60 3.9±1.61 4.8±0.15 0.44±0.02 F8 109.12±0.50 3.7±0.3 4.7±0.15 0.57±0.02 F9 110.23±0.48 3.8±0.45 4.6±0.19 0.46±0.02 F10 110.24±0.20 3.6±0.25 4.5±0.21 0.57±0.07 F11 111.45±0.97 3.7±0.70 4.8±0.10 0.56±0.05 F12 112.03±0.54 3.9±0.25 4.9±0.15 0.53±0.08 F13 111.04±0.30 3.8±0.60 5.2±0.18 0.52±0.09 F14 108.23±0.35 3.7±0.56 4.9±0.10 0.42±0.02 F15 109.34±0.25 3.9±0.70 4.9±0.08 0.5 1±0.20 F16 111.12±0.55 3.8±0.40 4.8±0.21 0.58±0.9 F17 110.23±0.50 3.8±0.17 5.5±0.04 0.49±0.04 F18 111.67±0.30 3.8±0.40 4.8±0.14 0.52±0.03 F19 109.13±0.45 3.7±0.17 4.5±0.12 0.54±0.01 F20 109.45±0.55 3.9±0.96 4.9±0.10 0.63±0.03 F21 108.12±0.70 3.8±0.50 4.8±0.12 0.66±0.03 F22 111.45±0.80 3.7±0.63 4.5±0.10 0.52±0.015 F23 110.23±0.55 3.7±0.78 4.9±0.17 0.56±0.04 F24 110.12±0.60 3.8±0.86 4.9±0.14 0.53±0.06 F25 109.14±0.75 3.7±0.57 4.7±0.15 0.57±0.07 F26 110.18±0.15 3.9±0.63 4.9±0.18 0.52±0.03 F27 111.23±0.75 3.9±0.98 5.3±0.05 0.59±0.04 *Values are expressed in mean± SD :( n=20)
#Values are expressed in mean± SD :( n=3)
In vitro Dissolution Studies:
Figure 4: In vitro Drug Release Profile for colon ivermectin tablets F1-F7
0 1 2 3 4 5 6 7 8
0 10 20 30 40 50 60 70 80 90 100
Time (Hours)
Cu
mu
lati
ve
%
Dr
ug
Re
lea
sed
Figure 5: In vitro drug relase profile for colon ivermectin tablets f8-f14
Figure 6: In vitro Drug Release Profile for colon ivermectin tablets F15-F21
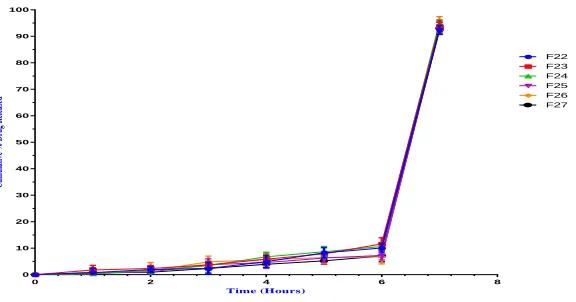
Figure 7: In vitro Drug Release Profile for colon ivermectin tablets F22-F27
In vitro
drug release studies
In vitro release profiles of ivermectin was sequentially determined in0.1 N HCL pH 1.2,
intestinal fluid pH 6.8 and simulated colonic fluid (SCF) pH 7.4.
The formulation with drug superdisintegrants ratio F17 was selected as optimized formulation
0 2 4 6 8
0 10 20 30 40 50 60 70 80 90 100
Time (Hours)
Cu
m
ul
at
ive
%
D
ru
g R
ele
as
ed
because it showed a maximize release in proximal colon.
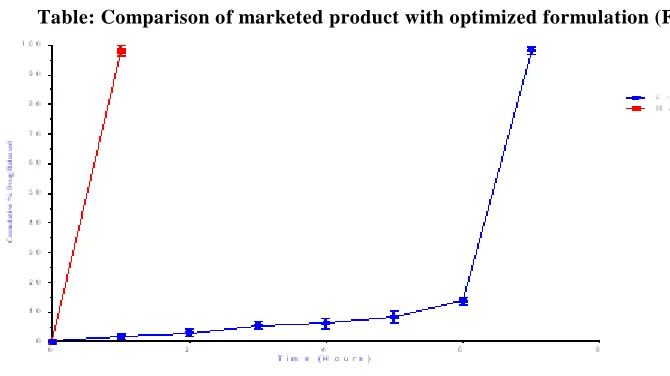
Table: Comparison of marketed product with optimized formulation (F17)
Figure 8: Comparative In vitro study plot of optimized formulation (F17) and conventional marketed tablet
Mathematical modeling of optimized formula
of ivermectin colon tablets
In vitro dissolution has been recognised as an important element in drug development. Under certain conditions it can be used as a surrogate for the assessment of bioequivalence.There are several models to represent the drug dissoluton profiles where ft is a function of time releated to the amout of drug dissolved from the pharmaceutical dosage systems.The quatitative interpretation of the values obtained in the dissolution assay is facilitated by the usage of a generic eqation that mathematically translates the dissolution curve in the function of some parameters releated with the pharmaceutical dosage forms.
A water soluble drug incorporated in a matrix is mainly released by diffusion, while for a low
water- soluble drug the self-erosion of the matrix will be the principal relese mechanism. To accomplish these studies the cumulative profiles of dissolved drug are more commonly used in opposition to their differential profiles.Mathematical modeling of the relese kinetics of specific classes of controlled-relese systems may be used to predict solute release rates from and solute diffusion behavior through polymers and elucidate the physical mechanisms of solute transport by simply comparing the relese data to mathematical models.
In the view of establishment of release mechanism and quatitatively interpreting and translate mathematically the dissolution date being plotted.
In vitro
drug release order kinetics for optimized (F17) Formulation
Table 9: Release kinetics of optimized formulation of ivermectin colon tablets Formulation Code Zero Order First Order Higuchi Korsmeyer-Peppas
R2 n R2 n R2 n R2 n
F17 0.994 8.02 0.842 0.119 0.946 29.41 0.988 0.817
From the above results it is apparent that the regression coefficient value closer to unity in case
This data indicates a lesser amount of linearity when plotted by the first order equation. Hence it can be concluded that the major mechanism of drug release follows zero order kinetics.
Further, the translation of the data from the dissolution studies suggested possibility of understanding the mechanism of drug release by
configuring the data in to various mathematical modeling such as Higuchi and Korsmeyer-Peppas plots. Further the n value obtained from the Korsmeyer-Peppas plots i.e. 0.817 indicating non Fickian (anomalous) transport thus it projected that delivered its active ingredient by coupled diffusion and erosion.
In vitro
drug release order kinetics for marketed product
Table 10: Release kinetics of Marketed Product
Formulation Code Zero Order First Order Higuchi Korsmeyer-Peppas
R2 n R2 n R2 n R2 n
Marketed 0.923 4.87 0.967 0.088 0.925 27.05 0.945 0.823
From the above results it is apparent that the regression coefficient value closer to unity in case of First order plot i.e.0.967 indicates that the drug release follows a first order mechanism (Table No 10). This data indicates a lesser amount of linearity when plotted by the zero order equation. Hence it can be concluded that the major mechanism of drug release follows first order kinetics.
Further, the translation of the data from the dissolution studies suggested possibility of
understanding the mechanism of drug release by configuring the data in to various mathematical modeling such as Higuchi and Korsmeyer-Peppas plots.
Further the n value obtained from the Korsemeyer-Peppas plots i.e. 0.823 indicating non Fickian (anomalous) transport thus it projected that delivered its active ingredient by coupled diffusion and erosion.
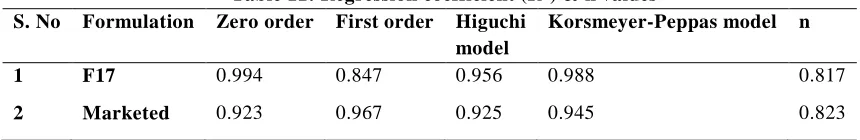
Correlation Coefficient Values For Optimized
Table 11: Regression coefficient (R2) & n values S. No Formulation Zero order First order Higuchi
model
Korsmeyer-Peppas model n
1 F17 0.994 0.847 0.956 0.988 0.817
2 Marketed 0.923 0.967 0.925 0.945 0.823
The in vitro drug release profiles were fitted to several kinetic models and release data followed by their R2 and n values shown in the Table 11/ The optimized formulation was best fitted in Zero Order and Korsmeyer-Peppas. The optimized formulation n value was 0.817 indicating non Fickian
(anomalous) transport thus it projected that delivered its active ingredient by coupled diffusion and erosion. The marketed conventional formulation followed the first order kinetics indicating drug release is directly proportional to the concentration of drug.
Stability study
Parameters
Temperature Maintained at 40±20C ;
Relative Humidity (RH) Maintained at 75%±5%RH Initial After 1 month After 2 months After 3 months Drug Content (%) 99.94±0.14 99.83±0.68 99.70±0.37 99.62±0.22 In Vitro Drug Release (%) 98.21±1.15 98.17±1.53 98.15±1.42 98.11±1.35 Disintegration tests 37±0.64 37±0.56 36±0.67 36 ±0.23
Hardness 4.7±0.84 4.7±0.34 4.7±0.25 4.7±0.13
There were no physical changes in appearance and flexibility. After subjecting the optimized formulation (F17) to the Accelerated Stability Studies, the results were shown that there were no major changes in Drug Content, In Vitro Drug Release, Disintegration tests and Hardness. Hence the formulation was found to be stable.
SUMMARY AND CONCLUSION
In present work attempt was made to formulate and evaluate colon tablets of ivermectin. Attempts were made to achieve immediate drug release from the dosage form. Twenty seven formulations (F1-F27) were prepared by direct compression method using 33 Response surface method where 33 indicates 3 variables and 3 levels of natural superdisintegrants like Gellan Gum, Locust bean Gum and Fenugreek seed Gum (low, middle and high concentrations) by using Design of experiment software. In the Preformulation properties was carried out and the values obtained were within the range. And FTIR studies results revealed that there was no incompatibility between drug and excipients. Thus, colon Tablets were formulated by
varying proportions of natural superdisintegrants by direct compression method and all formulations were coated by Eudragit RS 100 coating solution which is a pH sensitive polymer to prevent drug release in stomach and intestine. Entire drug will release in proximal part of colon. The formulation F17 was selected as optimized formulation because it showed minimum release in stomach and small intestine and a maximize release in proximal colon. In vitro drug release studies were carried out to know the drug release with respective of the time. Maximum drug was released from the formulation F17 within 7 Hrs. Based on the physico-chemical properties and in vitro drug release, the formulation F17 was concluded as the best formulation. No prominent changes in physico-chemical properties of formulation after its exposure to accelerated conditions of temperature (40±20C) and humidity conditions (75 ± 5%RH) were seen. Hence the developed formulation was found to be stable even after subjecting to accelerated stability conditions. In the present work, it can be concluded that the colon Tablets of ivermectin formulations can be an innovative and promising approach for the delivery of ivermectin for the treatment of worm infections.
REFERENCES
[1]. Barbara L, Teresa C, Federica B, Isabella O, Z: pH-sensitive polymeric physical-mixture for possible site-specific delivery of ibuprofen. Eur J Pharm Biopharm 55 , 2003, 199-202.
[2]. Lachman L, Lieberman HA, Kanig JL: The theory and practice of industrial pharmacy. Bombay, Varghese publishing house: Hind Rajasthan building; 3, 1991, 293.
[3]. Antonin KH, Rak R, Beick PR, Schenker U, Hastewell J, Fox R: The absorption of human calcitonin from the transverse colon of man. Int J Pharm.130, 1996, 33-39.
[4]. Van-den GM, Kinget R: Oral colon-specific drug delivery: a review. Drug Delivery 2, 1995, 81-93. [5]. Rama Prasad Y, Krishnaiah Y, Satyanarayana S: In vitro evaluation of guar gum as a carrier for colon
-specific drug delivery. J Controlled Release 51, 1998, 281-287.
[7]. Rama Prasad Y, Krishnaiah Y, Satyanarayana S: In vitro evaluation of guar gum as a carrier for colon -specific drug delivery. J Controlled Release 51, 1998, 281-287
[8]. Xinmuing Liu, Qingshen Sun, Huajie Wang, Lei Zhang, Jin-Ye Wang, Microspheres of Corn protein, zein, for an ivermectin drug delivery system Biomaterials, 26, 2005, 109- 115.
[9]. Klaus Florey, David.W.F, Analytical Profiles of Drug Substances - Ivermectin, Academic Press-Elsevier, New Delhi; 17, 2005, 156-184.
[10]. Pragnesh patel, anupkumar Roy. Formulation and evaluation of colon targeted tablets of Ornidazole for the treatment of amoebiasis, International journal of drug delivery & research. 3(1), 2011, 52-61.
[11]. Krishnaiah YSR, Satyanarayana V, Rama Prasad YV. Studies of guar gum compression -coated 5-aminosalicylic acid tablets for colon-specific drug delivery, Journal of Drug Development and Industrial Pharmacy. 25, 1999, 651– 657.
[12]. Montgomery, Douglas C, Design and Analysis of Experiments: Response surface method and designs, John Wiley and Sons, Inc. New Jersey, 2005, 210-256.
[13]. Schwartz BJ,Connor RE, Optimization technique in pharmaceutical formulations and processing, J Drugs Pharm Sci Modern Pharm, 72, 1996, 727-54.
[14]. Nair Rahul, Sevukarajan.M, Vishnu Priya K, Arun Kumar K.S, Response Surface Methodology for the Optimization OF Ethylcellulose Microspheres, International Journal of PharmTech Research, 3 (2), 775-783.
[15]. Friend DR, Phillips S, McLeod A, Tozer TN. Relative anti inflammatory effect of oral dexamathasoneß -D-glucoside and dexamathasone in experimental inflammatory bowel disease. J Pharm Pharmacol. 43, 1991, 353–355.
[16]. Fukui E, Miyamura N, Uemura K, Kobayashi M. Preparation of enteric coated tim ed release press-coated tablets and evaluation of their function by in vitro and in vivo tests for colon targeting. Int J Pharm. 204 , 2000, 7 - 15.
[17]. Gardner N. Haresign W, Spiller R, Faraj N, Wiseman J, Norbury H, Illum L. Development and validation of a pig model for colon-specific drug delivery. J Pharm Pharmacol. 48, 1996, 689–693.
[18]. Gazzaniga A, Bussetti C, Moro L, Sangali ME, Giordano F. Time dependent oral delivery system for colon targeting. STP Pharm Sci. 5, 1995, 83-88.