Volume 4 - January 2015
International Journal
of Sciences
Alkhaer Publications
ijSciences [ ISSN 2305-3925 ] is an open access journal having expertise in
delivering high-quality and rapid publications, from online submission systems
and in-depth peer review to an efficient, author-friendly production process.
Ivanka Dimova (Correspondence)
[email protected]
+359 2 9172 735
1Department of Medical genetics, Medical University Sofia, Bulgaria 2Department of Pathophysiology, Medical University Sofia, Bulgaria 3Second Surgical Clinics, Alexandrovska Hospital, Sofia, Bulgaria
Abstract: Despite of the large number of molecular studies in breast cancer, the data are still insufficient for understanding its molecular pathogenesis. The dramatic development of genetics in recent years has made it possible to gain insight into the molecular mechanisms of tumorigenesis. The aims of the study was to determine the type, frequency and fine mapping of unbalanced genomic alterations in ductal carcinoma of the breast. For this study we have used tumor samples of invasive ductal breast cancer to be analysed by comparative genomic hybridization on DNA microarrays. Two approaches were applied in the analysis of significant unbalanced genomic changes: a) identification of clones which presented unbalanced changes (log2 T: H> +0.25 for gain and <-0.25 for losses) in more than 70% of the tumors; b) establishing clones which harbor amplifications (log2 T: H> +0.5) or homozygous deletions (log2 T: H <- 0.5) in more than 50% of tumors. Our results showed that the most commonly affected chromosome arms by gains were 20q and 1q. Loss at high frequency was found in 8p. Totally 9 regions with high rate of genetic alterations (7 in short and 2 in long arm) were detected in chromosome 1. Genetic losses in chromosome 8 predominated - 8p11.21 have lost in 100% of the cases. There were regions of chromosome 17 with a frequency of genetic gains over 70% - in 17q12, 17q21.31, 17q22 and a region with a frequency of more than 80% loss in 17q21.32. The long arm of chromosome 20 was affected by significant amplifications in 10 regions, but with the highest frequency of more than 80% in 20q11.21-q11.23, 20q12 and 20q13.12-q13.2. Our study contributed to the fine mapping of genomic imbalances in ductal breast cancer, suggesting the significant regions of genetic gains and losses. The genes in the found regions could represent potential oncogenes and/or tumor-supressor genes with cancer-emerging role.
Keywords: ductal breast cancer, array CGH, oncogenes and tumor-supressor genes
INTRODUCTION
Despite of the large number of molecular studies in breast cancer, the data are still insufficient for understanding its molecular pathogenesis. The dramatic development of genetics in recent years has made it possible to gain insight into the molecular mechanisms of tumorigenesis. In breast cancer several different combinations of genes are involved that are likely to determine the aggressiveness of the cancer [1].
Genetic mapping in tumors of the breast tissue established multiclonality, which implies the presence of intratumoral heterogeneity at a high level [2]. Frequent changes occur in the chromosome arms 1p, 3p, 6q and 8p; i(1q) and der t(1, 16) as well as single aberrations such as +7, +8 and +20; DNA amplifications such as homogeneously stained regions (HSR), which are mainly related to 8p [3-5]. Aberrations leading to addition or loss of part of the genome can be determined by molecular cytogenetic
techniques: comparative genomic hybridization (CGH) and fluorescent in situ hybridization (FISH). Such aberrations are interstitial deletions, duplications, non-reciprocal translocations and gene amplifications.
Comparative genomic hybridization (CGH) is used to examine the entire genome for identification of quantitative changes in DNA sequences – genetic gain/amplifications and losses (deletions). CGH assay is based on competitive hybridization between DNA from the sample (ie. test DNA) and DNA from normal cells (reference DNA) to identify chromosomal regions with additional or absent genetic material in the tumor genome.
http://www.ijSciences.com Volume 4 – January 2015 (01)
9
gens are already described in the hot areas - AIB1, BTAK, NABC1 and ZNF217 [6]. They are involved in the amplifications and related overexpression of 20q13 and induce phenotypic effects in the cells which carry these modifications. For more than 20 "hot" amplification regions exist throughout the genome, however, the target genes remain unknown. Tumors can be classified based on their genomic profile, determined by CGH-microarrays [7-10]. Based on these genomic profiles it is possible to perform:
• selection of certain genes from the affected areas for the study of gene expression;
• identifying different types of genomic instability. Thus, tumor-specific genomic profiles created "genomic phenotypes" of tumors.
Many studies use the advantage of the high resolution of the method for more precise mapping of boundaries and size of the amplified region. Once this is known, the candidate oncogenes in this region or in the amplification maximum can be easily identified by a "genome sequence databases". The study of the expression levels of these candidate genes in tumors and cell lines can further determine which of the candidates at most contribute to the phenotype and are "driving" genes in the amplified region [11-13].
The purpose of this study was to determine the type, frequency and fine mapping of unbalanced genomic alterations in ductal carcinoma of the breast by comparative genomic hybridization on microarrays covering the entire genome.
MATERIALS AND METHODS
For this study we have used 10 tumor samples of invasive ductal breast cancer analysed by comparative genomic hybridization on DNA microarrays covering the whole genome with an average density of one BAC clone / 0.8 Mb. Materials and microarrays are kindly provided by the laboratory "Identité et plasticite des tumeurs", Montpellier, France.
Array CGH
The method is based on competitive hybridization of alternatively labeled tumor and normal DNA on BAC clones applied to microchips. The method allows quantitative detection of abnormalities in the genetic material of tumor cells relative to normal, and the determination of the position of the additional or missing DNA sequences according to the affected branch. In this work against each tumor DNA was hybridized DNA from normal female.
DNA isolation, labeling and hybridization
Isolation of DNA by phenol-chloroform extraction is based on the extraction of proteins and other constituents of the cell lysate in the organic phase, DNA remains in the aqueous phase and precipitated with ethanol. Labeling of genomic DNA was performed using a random priming. The presence of labeled DNA was estimated on a spectrophotometer at the following wavelengths: 260 nm for DNA, 550 nm for Cy3 and 650 nm for Cy5. Incorporation of fluorochrome was calculated by Molecular probes software:
http://www.probes.com/resources/calc/basedyeratio.h tml. For subsequent hybridization was taken only samples with incorporation of less than 50 (i.e. 1 fluorochrome per 50 base pairs) or 525 pmol DNA, calculated by the software program.
Mix 700 pmol Cy-5 and 700 pmol Cy-3 labeled probe is precipitated in ethanol in the presence of 250-300 μg of human Cot-1 DNA (Roche Diagnostics, Meylan, France) and 100 μg DNA from herring sperm (Promega , Charbonnières, France). The microchip was then dried and resuspended in 110 μl hibrizol VII (Appligene Oncor, Qbiogen, Illkirch, France). It continues with hybridization and washing of the samples.
Scanning and software analysis of the images
The slides were scanned by GenePix 4100 A. The images were analyzed with the software program GenePix Pro 6.0. Spots on the chip were outlined and defined automatically by the software and manually where necessary. It calculated fluorescent intensities of all spots after elimination of the local background. Intensities of Cy3 and Cy5 were normalized to the entire set spots on the chip and then the ratio Cy3 / Cy5 was calculated (when tumor DNA was labeled with Cy3), taking the average of the ratio of the replicates for each clone (analyzed only in spots less than 15% deviation from the average of the repliques). All these data are processed in program CapWeb array CGH, which is generated by the profile of each tumor with fluorescent log2 value ratios of all BAC clones on the ordinate and Mb position of BAC clones on the abscissa. Fluorescent ratio values above 0.25 are reported as gain, and over 0.5 - as amplification and values below -0.25 are reported as a loss and below -1 - as homozygous deletion.
RESULTS
Whole Genome Microarray Analysis in Invasive Ductal Breast Cancer Revealed the most Significant Changes Affect Chromosomes 1, 8, 17 and 20
http://www.ijSciences.com Volume 4 – January 2015 (01)
10
artificial chromosome (BAC) with an average density of one BAC / 0.8 Mb. Figure 1 shows a single profile with log2 T: N ratios for all clones in all chromosomes in tumor № 4. corresponding karyotype of a tumor is presented in Figure 2.
Array CGH analysis found that the average increased copy number (gain and amplification) was 8.3% of the clones, while the average reduced number of copies was 7.8% of clones.
Фиг. 1. Single profile with log2 T: N ratios for all clones in all chromosomes in tumor № 3. The abscissa represents all chromosomes; genetic gains are colored in red, whereas genetic losses – in green.
Фиг. 2. Corresponding karyotype of tumor № 3 – losses are presented in green and gains in red.
Analysis of genomic instability in the tumors
To assess the degree of genomic instability, tumors were classified into three groups according to the average number of copy number alterations (ACNA), which according to our results was 1319 clones: Group A - instability below ACNA; group B - over ACNA and group C - more than 2 times above ACNA.
http://www.ijSciences.com Volume 4 – January 2015 (01)
11
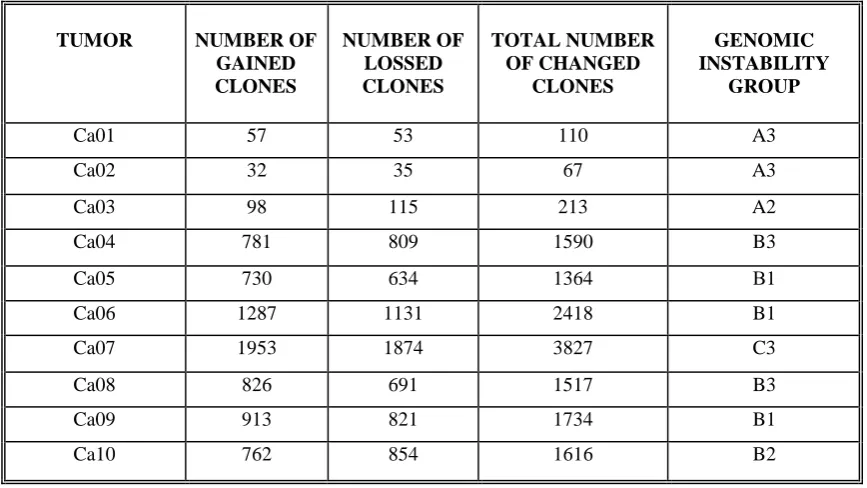
Table 1. Data about number of clones with altered copy numbers in all tumors and grouping them by type of genomic instability.
TUMOR NUMBER OF
GAINED CLONES
NUMBER OF LOSSED CLONES
TOTAL NUMBER OF CHANGED
CLONES
GENOMIC INSTABILITY
GROUP
Ca01 57 53 110 A3 Ca02 32 35 67 A3 Ca03 98 115 213 A2 Ca04 781 809 1590 B3 Ca05 730 634 1364 В1 Ca06 1287 1131 2418 B1 Ca07 1953 1874 3827 C3 Ca08 826 691 1517 B3 Ca09 913 821 1734 B1 Ca10 762 854 1616 B2
The highest percentage of the analyzed tumors fall into group B of genomic instability, in half of the cases we observed prevalence of genetic gains. Three of the tumors showed a degree of genomic instability lower than average, and only one tumor was assigned to group C of genomic instability. The last had equal participation of genetic gains and losses. These results are a starting point for tracking the effects of treatment and course of the disease in each of the patients to assess the impact of genomic instability on these indicators.
Analysis of aberrations, involving whole
chromosomes or chromosome arms
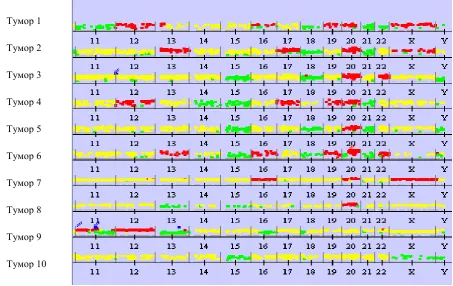
The involvement of chromosomes in large aberrations (gains and losses of whole chromosomes or chromosome arms) is presented in Figure 3 a) for chromosomes 1 to 10 and in Figure 3 b) for chromosome 11 to D.
According to our results, the most frequently affected by large aberrations (aneuploidies of whole chromosomes and chromosomal arms) are chromosomes 8 and 20, and such changes have been found in 90% of tumors studied. They are followed by chromosomes 4 and 15 (60%), 18 and 21 (50%), 5, 7, 13 and X (40%), 11, 12, 16, 19 and 22 (30%), 1 and 17 (20% ), 2, 6, 9, 10 and 14 (10%). Chromosome 3 was not affected by large aberrations in any of the tumors.
Whole Genome Microarray Analysis in Invasive Ductal Breast Cancer Revealed the most Significant Changes Affect Chromosomes 1, 8, 17 and 20
http://www.ijSciences.com Volume 4 – January 2015 (01)
12
Figure 3 а). Large aberrations in chromosomes 1 to 10. Genetic gains are presented in red and losses – in green.
Figure 3 b). Large aberrations in chromosomes 11 to Y. Тумор 01
Тумор 02
Тумор 03
Тумор 04
Тумор 05
Тумор 06
Тумор 07
Тумор 08
Тумор 09
Тумор 10
Тумор 1
Тумор 2
Тумор 3
Тумор 4
Тумор 5
Тумор 6
Тумор 7
Тумор 8
Тумор 9
http://www.ijSciences.com Volume 4 – January 2015 (01)
13
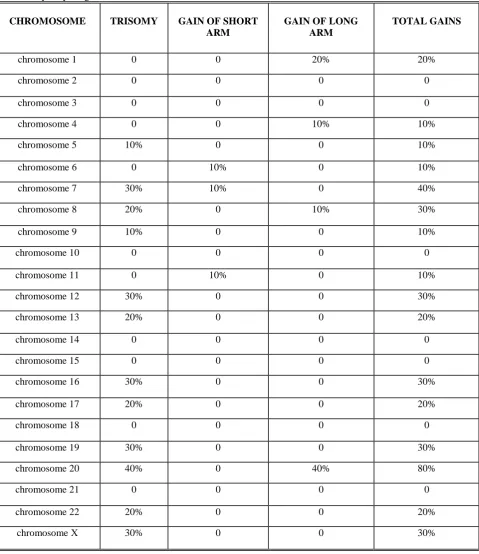
Table 2. Frequency for gains of whole chromosomes or chromosome arms.
CHROMOSOME TRISOMY GAIN OF SHORT
ARM
GAIN OF LONG ARM
TOTAL GAINS
chromosome 1 0 0 20% 20% chromosome 2 0 0 0 0 chromosome 3 0 0 0 0 chromosome 4 0 0 10% 10% chromosome 5 10% 0 0 10% chromosome 6 0 10% 0 10% chromosome 7 30% 10% 0 40% chromosome 8 20% 0 10% 30% chromosome 9 10% 0 0 10% chromosome 10 0 0 0 0 chromosome 11 0 10% 0 10% chromosome 12 30% 0 0 30% chromosome 13 20% 0 0 20% chromosome 14 0 0 0 0 chromosome 15 0 0 0 0 chromosome 16 30% 0 0 30% chromosome 17 20% 0 0 20% chromosome 18 0 0 0 0 chromosome 19 30% 0 0 30% chromosome 20 40% 0 40% 80% chromosome 21 0 0 0 0 chromosome 22 20% 0 0 20%
chromosome Х 30% 0 0 30%
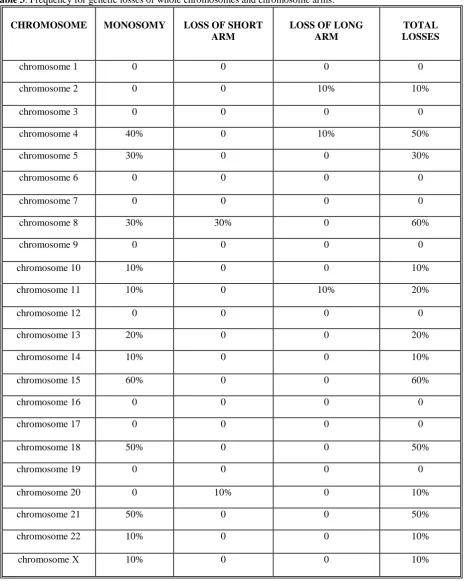
The highest incidence of large losses (Table 3) had chromosomes 8 and 15 (60%), followed by chromosomes 4, 18, and 21 (50%), chromosome 5 (30%) and chromosomes 11 and 13 (20%). Low
Whole Genome Microarray Analysis in Invasive Ductal Breast Cancer Revealed the most Significant Changes Affect Chromosomes 1, 8, 17 and 20
http://www.ijSciences.com Volume 4 – January 2015 (01)
14
Table 3. Frequency for genetic losses of whole chromosomes and chromosome arms.
CHROMOSOME MONOSOMY LOSS OF SHORT
ARM
LOSS OF LONG ARM
TOTAL LOSSES
chromosome 1 0 0 0 0 chromosome 2 0 0 10% 10% chromosome 3 0 0 0 0 chromosome 4 40% 0 10% 50% chromosome 5 30% 0 0 30% chromosome 6 0 0 0 0 chromosome 7 0 0 0 0 chromosome 8 30% 30% 0 60% chromosome 9 0 0 0 0 chromosome 10 10% 0 0 10% chromosome 11 10% 0 10% 20% chromosome 12 0 0 0 0 chromosome 13 20% 0 0 20% chromosome 14 10% 0 0 10% chromosome 15 60% 0 0 60% chromosome 16 0 0 0 0 chromosome 17 0 0 0 0 chromosome 18 50% 0 0 50% chromosome 19 0 0 0 0 chromosome 20 0 10% 0 10% chromosome 21 50% 0 0 50% chromosome 22 10% 0 0 10% chromosome Х 10% 0 0 10%
Analysis of significant gains and losses and their fine mapping in ductal breast cancers
In this study, two approaches were applied in the analysis of significant unbalanced genomic changes: a) identification of clones which presented unbalanced changes (log2 T: H> +0.25 for gain and <-0.25 for losses) in more than 70% of the tumors;
b) establishing clones which harbor amplifications (log2 T: H> +0.5) or homozygous deletions (log2 T: H <- 0.5) in more than 50% of tumors.
http://www.ijSciences.com Volume 4 – January 2015 (01)
15
chromosome 8 we detected high frequency of loss for 8p11.21 and 8p23.1-p12. In the long arm, loci in 8q21.13, 8q21.3 and 8q22.1-q24.23 are characterized with the same frequency of losses (Table 4).
We found genetic gains along the entire chromosome 17, comprising several clones. In the long arm there was an area with a high percentage of amplification - in 17q11.2-q22 and 17p13.3 (over 70% of tumors) (Table 5), while high frequency loss was found in 17p11.2 and 17q21.31-q24.3 (Table 4).
In our study we observed in the short arm chromosome 20 a region with amplification of 80% frequency - 20p11.21. The long arm of chromosome was affected by significant amplifications in 10 regions, but with the highest frequency of more than 80% in 20q11.21-q11.23, 20q12 and 20q13.12-q13.2 (Table 5).
Among the important gains there were clones containing known oncogenes such as MUC1 gene in 1q21, LASP1 (17q11-q21.3) and HER-2 (17q21.1), ZNF217 and AURKA (STK6) at 20q13.2-q13 .3.
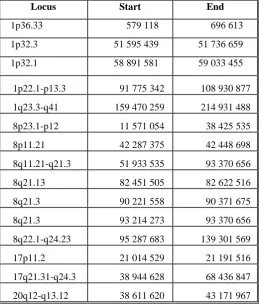
Table 4. Genomic regions with more than 70% frequency of genetic loss
Locus Start End
1p36.33 579 118 696 613 1p32.3 51 595 439 51 736 659 1p32.1 58 891 581 59 033 455
1p22.1-p13.3 91 775 342 108 930 877 1q23.3-q41 159 470 259 214 931 488 8p23.1-p12 11 571 054 38 425 535 8p11.21 42 287 375 42 448 698 8q11.21-q21.3 51 933 535 93 370 656 8q21.13 82 451 505 82 622 516 8q21.3 90 221 558 90 371 675 8q21.3 93 214 273 93 370 656 8q22.1-q24.23 95 287 683 139 301 569 17p11.2 21 014 529 21 191 516 17q21.31-q24.3 38 944 628 68 436 847 20q12-q13.12 38 611 620 43 171 967
Table 5. Genomic regions with more than 70% frequency of genetic gain
Locus Start End
Whole Genome Microarray Analysis in Invasive Ductal Breast Cancer Revealed the most Significant Changes Affect Chromosomes 1, 8, 17 and 20
http://www.ijSciences.com Volume 4 – January 2015 (01)
16
DISCUSSION
Genomic aberrations with altered DNA copy number at sub-microscopic level is a hallmark of epithelial tumors, including breast cancer. The introduction of comparative genomic hybridization in 1992 has opened new possibilities for the study of the genome and in particular, the methodology has contributed significantly to the development of research on solid tumors as it removes the need for the cultivation of cells for analysis of chromosomes.
The most common large aberrations in breast cancer
According to our results, the most commonly affected chromosome arm by gains were 20q and 1q. Loss at high frequency was found in 8p. Microstructural aberratons (less than 5Mbp) were found in more than 70% of tumors in the following regions:
- for gains: 17q11.2-q22, 17p13.3, 20p11.21, 20q11.21-q11.23, 20q12 and 20q13.12-q13.2
- for losses: 1p36.33, 1p32.3, 1p32.1, 1p22.1-p13.3, 1q23.3-q41, 8p11.21, 8p23.1-p12, 8q21.13, 8q21.3, 8q22.1-q24.23, 17p11.2, 17q21.31-q24.3 and 20q12-q13.12. K. Renstam and colleagues studied chromosomal gains and losses through CGH analysis in 305 unselected invasive breast cancer. The most commonly affected chromosome arms were: + 1q (55%), + 8q (41%), + 16p (40%), + 17q (28%), -13q (27%), -16q (22%) , + 20q (19%), -8p (18%) and + 11q (16%) [14].
According to other research groups, the most common gains are in 1q, 8q, 11q, 17q, 20q and losses in 6p, 8p, 9p, 13q, 16q [15-17].
M. Tirkonen and colleagues through CGH analysis detected changes in the number of copies of DNA sequences that are common to different cell subpopulations in tumors and thus they suggested pathways of developing breast cancer. In their study with the highest percentage of genetic additions have emerged 1q (67%) and 8q (49%). Other regions with such aberrations were detected in 16p, 19q, 19p, and 20q13 (over 18%). Genetic losses in over 18% of tumors were found in 8p, 16q, 13q, 17p, 9p, Xq, 6q, 11q, and 18q [18].
Analysis of significantly changed regions
According to B. Orsetti and colleagues, chromosome 1 is associated with copy number changes in 50-60% of breast cancer cases. Their research aimed to identify the specific changes by combining two methods - CGH on DNA microarrays and expression analysis. The results indicate that the short arm of chromosome 1 in the majority of cases is affected by genetic losses, while the long arm - almost entirely by
genetic gains. Using fine mapping they found the shortest regions of overlapping for 19 regions of chromosome 1 (with size of 170 kbp to 3.2 Mbps) for genetic gains (one at 1p and 18 in 1q) and 20 regions - for genetic losses (all in 1p). To identify candidate oncogenes the authors examined RNA expression profiles of 307 genes located in 1q. The research team has identified 30 candidate genes showing significant overexpression associated with increased number of DNA copies [19]. According to our results, a total of 9 regions characterized by a high rate of genetic alterations (7 in short and 2 in long arm) were detected in chromosome 1.
According to Rodriguez and colleagues genomic changes in chromosome 8 are common in breast cancer cell lines and tumors. By CGH-microarrays using BAC clones with a density of 100 kb they were able to identify changes in the copy number of chromosome 8. BAC-clones, covering both established areas of amplification (8q21 and 8q24) in cell lines of breast cancer, were distributed in 9 subregions including 6 amplicons and 3 dropped areas, as all were analyzed by FISH as well. Scientists have found that two regions in 8q24 (125.3-126.5 Mb and 128.1-129.1 Mb) are amplified in 87.5% of the cell lines. Through further research with 30 samples of breast cancer, the team of Rodriguez has found a new gene TRMT12, which was overexpressed twice more in 87% of tumors. TRMT12 represents homologue of the yeast gene, which encodes mRNA methyltransferase involved in post-transcriptional modification of tRNA for the amino acid phenylalanine (Phe). According to the research team, studying the biological effects of this modified expression allows to find new pathways of tumorigenesis [20].
http://www.ijSciences.com Volume 4 – January 2015 (01)
17
In many types of cancer it has been observed recurring genetic gains or amplifications in the long arm of chromosome 20 (20q). This suggests the existence of a gene or genes that are important for the tumor phenotype when they are overexpressed. Hodgsan and colleagues in an effort to discover oncogenes aimed to investigate the whole chromosome 20. Their results have shown a correlation between many areas with changes in the copy number of 20q and poor clinical prognosis. The research team found that this contributes to the development of the cancer phenotype, especially in terms of characteristics such as immortality, genomic instability, apoptosis and enhanced proliferation. Efforts aimed at discovery of new genes on chromosome 20 revealed candidate genes that may contribute to oncogenic development [22].
K. Collins and colleagues confirmed that the gene amplification occurs in most solid tumors and is associated with poor prognosis. Amplification at 20q13.2 is common for many types of tumors, including breast cancer and is the most comprehensive research segment of the human genome. The complex structure of the amplicon was discovered, which suggests the existence of at least two genes resulting in tumorigenesis. One of them, ZNF217, is able to immortalize human mammary epithelial cells when overexpressed. Through further research on the region the research team of Collins has received evidence of additional leading gene - prefoldin 4 (PFDN4), coregulated genes conserved noncoding regions and associated repetitive regions of genomic instability in this locus [23].
Conclusion
Our study contributed to the fine mapping of genomic imbalances in ductal breast cancer, suggesting the significant regions of genetic gains and losses are those affecting chromosomes 1, 8, 17 and 20. We precisely defined their boundaries. The genes in the found regions could represent potential oncogenes and/or tumor-supressor genes with cancer-emerging role.
References
1. Berchuck A, Kohler M, Bast R Oncogenes in ovarian cancer. Hematol Oncol (1992) 4:813-827
2. www.atlasgeneticsoncology.org/Tumors/breastID5018.html 3.Bieche I and Lidereau R. Genetic alterations in breast cancer. Genes Chromosom Cancer 1995; 14: 227-251.
4.Heim S and Mitelman F. Tumors of the breast. Cancer Cytogenetics, Wiley-Liss, 1995.Bernardino J, Apiou F, Gerbault-Seureau M, Malfoy B, Dutrillaux B. Characterization of recurrent homogeneously staining regions in 72 breast carcinomas. Genes Chromosom Cancer 1998; 23: 100-108.
5.Anzick SL, Kononen J, Walker RL, Azorsa DO, Tanner MM, Guan X-Y, Sauter G, Kallioniemi O-P, Trent JM, Meltzer PS.
AIB1, a steroid receptor coactivator amplified in breast and ovarian cancer. Science 1997; 277: 965-968.
6.Loo L, Grove D, Williams E et al. Array comparative genomic hybridization analysis of genomic alterations in breast cancer subtypes. Cancer Res 2004, 64: 8541-8549.
7.Fritz B, Schubert F, wrobel G et al. Microarray-based copy number and expression profiling in dedifferentiated and pleomorphic liposarcoma. Cancer Res 2002, 62: 2993-2998. 8.Van Dekken H, Paris PL, Albertson DG et al. Evaluation of genetic patterns in different tumor arreas of intermediate-grade prostatic adenocarcinomas by high-resolution genomic array analysis. Genes Chromosomes Cnacer 2004, 39 (3): 249-56. 9.Jones AM, Douglas EJ, Halford SE et al. Array-CGH analysis of microsatellite-stable, near diploid bowel cancers and comparison with other types of colorectal carcinoma. Oncogene 2005, 24 (1): 118-29.
10. Douglas E, Fiegler H, Rowan A, et al. Array comparative genomic hybridization analysis of colorectal cancer cell lines and primary carcinomas. Cancer Res 2004, 64: 4817-25. 11. Wessendorf S, Nessling M, Moller P, et al. Hidden gene amplifications in aggressive B-cell non-Hodgkin lymphomas detected by microarray-based comparative genomic hybridization. Oncogene 2003, 22: 1425-1429.
12. Albertson DG, Yistra B, Segraves R, et al. Quantitative mapping of amplicon structure by array CGH identifies CYP24 as a candidate oncogene. Nat genet 2000, 25:144-146.
13. Monni O, Barlund M, Mousses S, et al. Comprehensive copy number and gene expression profiling of the 17q23 amplicon in human breast cancer. Proc Natl Acad Sci 2001, 98: 5711-16. 14. Rennstam K, Ahlstedt-Soini M, Baldetorp B, Bendahl PO, Borg A, Karhu R, Tanner M, Tirkkonen M, Isola J: Patterns of chromosomal imbalances defines subgroups of breast cancer with distinct clinical features and prognosis. A study of 305 tumors by comparative genomic hybridization. Cancer Res 2003, 63:8861-8868.
15. Pollack JR, Perou CM, Alizadeh AA, Eisen MB, Pergamenschikov A, Williams CF, Jeffrey SS, Botstein D, Brown PO: Genome-wide analysis of DNA copy-number changes using cDNA microarrays. Nat Genet 1999, 23:41-46.
16. Pollack JR, Sorlie T, Perou CM, Rees CA, Jeffrey SS, Lonning PE, Tibshirani R, Botstein D, Borresen-Dale AL, Brown PO: Microarray analysis reveals a major direct role of DNA copy number alteration in the transcriptional program of human breast tumors. Proc Natl Acad Sci USA 2002, 99:12963-12968. 17. Albertson DG: Profiling breast cancer by array CGH. Breast Cancer Res Treat 2003, 78:289-298.
18. Tirkkonen M, Tanner M, Karhu R, Kallioniemi A, Isola J, Kallioniemi OP: Molecular cytogenetics of primary breast cancer by CGH. Genes Chromosomes Cancer 1998, 21:177-184. 19. Orsetti B, Nugoli M, Cervera N, Lasorsa L, Chuchana P, Rougé C, Ursule L, Nguyen C, Bibeau F, Rodriguez C, Theillet C. Genetic profiling of chromosome 1 in breast cancer: mapping of regions of gains and losses and identification of candidate genes on 1q. Br J Cancer. 2006 Nov 20;95(10):1439-47.
20. Rodriguez V, Chen Y, Elkahloun A, Dutra A, Pak E, Chandrasekharappa S. Chromosome 8 BAC array comparative genomic hybridization and expression analysis identify amplification and overexpression of TRMT12 in breast cancer. Genes Chromosomes Cancer. 2007 Jul;46(7):694-707.
21. Orsetti B, Nugoli M, Cervera N, Lasorsa L, Chuchana P, Ursule L, Nguyen C, Redon R, du Manoir St, Rodriguez C, Theillet C. Genomic and expression profiling of chromosome 17 in breast cancer reveals complex catterns of alterations and novel candidate genes. Cancer Research 64, 6453-6460, September 15, 2004.
22. Hodgson JG, Chin K, Collins C, Gray JW. Genome amplification of chromosome 20 in breast cancer. Breast Cancer Res Treat. 2003;78:337–345.