Open Access
Research
How high: Quantity as a predictor of cannabis-related problems
Nicole Walden and Mitch Earleywine*
Address: Department of Psychology, University at Albany, State University of New York, 1400 Washington Ave., SS369, Albany, New York, 12222, USA
Email: Nicole Walden - [email protected]; Mitch Earleywine* - [email protected] * Corresponding author
Abstract
Background: Research on cannabis use has emphasized frequency as a predictor of problems. Studies of other drugs reveal that frequency relates to psychological and physiological outcomes, but quantity also plays an important role. In the study of cannabis, quantity has been difficult to assess due to the wide range of products and means of consumption.
Methods: The present study introduces three new measures of quantity, and examines their contribution to cannabis-related problems. Over 5,900 adults using cannabis once or more per month completed an internet survey that inquired about use, dependence, social problems and respiratory health. In addition to detailing their frequency of cannabis use, participants also reported three measures of quantity: number of quarter ounces consumed per month, usual intensity of intoxication, and maximum intensity of intoxication.
Results: Frequency of use, monthly consumption, and levels of intoxication predicted respiratory symptoms, social problems and dependence. What is more, each measure of quantity accounted for significant variance in outcomes after controlling for the effects of frequency.
Conclusion: These findings indicate that quantity is an important predictor of cannabis-related outcomes, and that the three quantity measures convey useful information about use.
Background
Most research on cannabis emphasizes frequency of con-sumption. For example, three prominent surveys, the National Epidemiological Survey on Alcohol and Related Conditions [1], The Epidemiologic Catchment Area [2], and the National Comorbidity Survey [3] inquire about the number of joints smoked per day, and how often par-ticipants used in the past twelve months. Research on other drugs reveals that frequency serves as an important predictor of problems, but quantity also plays an impor-tant role [4-6]. Similarly, tobacco research has determined that the impact of cigarette smoking on respiratory health is related to the quantity of tobacco smoked [7,8]. Thus,
whether addressing the psychological or the physiological outcomes of cannabis use, there is impetus to consider quantity.
Quantity of cannabis used is an important predictor of psychosocial outcomes. In a study conducted by Stephens and colleagues [9] cannabis users meeting the criteria for dependence typically reported consuming nearly one half ounce of cannabis per week, and smoking approximately three joints daily. Thus, in this research population, a pro-file of heavy use accompanied dependence. Other studies indicate that frequency alone does not overwhelmingly account for dependence. For example, the 2003 National Published: 29 May 2008
Harm Reduction Journal 2008, 5:20 doi:10.1186/1477-7517-5-20
Received: 9 December 2007 Accepted: 29 May 2008
This article is available from: http://www.harmreductionjournal.com/content/5/1/20
© 2008 Walden and Earleywine; licensee BioMed Central Ltd.
Survey on Drug Use and Health [10] found over 60% of daily cannabis users to be non-dependent. Such variance in dependence among even daily users suggests that other factors, such as quantity, play a role in dependence.
For those who smoke cannabis, quantity also contributes to respiratory symptoms. Inhaling cannabis smoke exposes the lungs to harmful gaseous and particulate mat-ter [11,12] and is associated with respiratory impairment [13]. Daily cannabis smoking predicts respiratory symp-toms comparable to those resulting from cigarette smoke, such as coughing, increased phlegm and shortness of breath [14]. Although the risks for lung cancer are mark-edly higher in cigarette smokers because of nicotine's tumor-enhancing effects and THC's tumor-inhibiting ones, the acute and longitudinal effects of cannabis smoke on respiratory functioning are dose dependent in a way that suggests that the smoke increases respiratory irrita-tion [11,15]. In light of such findings on both respiratory health and psychosocial functioning, it is apparent that quantity plays an important role in determining the con-sequences of cannabis use.
While quantity of use is an important factor to consider, it is rarely measured. For example, of forty-one articles iden-tified through the PsychInfo literature database that address cannabis use and psychosocial problems, only two include a measure of quantity [16,17]. In an effort to contend with "uncertainties about THC content [18]," researchers have often defined heavy use as "daily or near daily use [18]." Addressing quantity more directly, Chen and colleagues [16] and Grant and Pickering [17] meas-ured quantity in terms of the number of joints smoked per day or per smoking occasion. These approaches have been helpful, and research stands to benefit from incorporating other direct and indirect measures of quantity.
The assessment of quantity is important for understand-ing outcomes of cannabis use, but the design of a mean-ingful measure is not without its challenges. Tobacco use may be relatively easy to quantify due to cigarette manu-facturing standards, but there is no standardized cannabis product. Alcohol researchers have devised a "standard drink" [19] to measure alcohol consumption comparably between different beverage types. However, as joint size varies, THC content varies, and there are many different products and means of delivery, a "standard drink" meas-ure may not apply to cannabis. Nevertheless, an estimate of amount consumed could still help predict problems. Additionally, as an indirect measure of quantity, an index of intoxication might also help predict problems.
The present study introduces new measures of quantity and examines the relation between quantity of cannabis consumption and problems. As a direct measure of
phys-ical quantity consumed, we inquired about the number of quarter ounces used per month. Cannabis users may not be able to report the precise dosage of individual joints, but are likely to be familiar with the rate at which they consume quarter ounces, as this unit of weight typically corresponds with product purchase [20,21]. In addition to this direct measure, we also measured quantity indi-rectly by asking about intensity of intoxication. Psychoac-tive effects are dose-related [22-25] and therefore intoxication level conveys information about quantity. We asked individuals to report both their usual and max-imum levels of intoxication, as each may relate differen-tially to problems. With these direct and indirect measures, we were able to examine the independent con-tributions of frequency and quantity to cannabis-related outcomes.
Consistent with previous cannabis research [11,26-28], we hypothesized that frequency would predict respiratory symptoms, social problems, and dependence. We further hypothesized that quantity would predict respiratory symptoms, social problems, and dependence even after the effects of frequency were taken into account. To exam-ine the independent contribution of each predictor, as well as the effects of quantity after controlling for fre-quency, hierarchical multiple regression analyses were conducted for each outcome.
Methods
Participants
Data were collected by means of an internet survey. In order to access a sample of regular cannabis users, partici-pants were recruited from among the constituency of sev-eral organizations promoting drug law reform. The researchers requested The Drug Policy Alliance, The Mari-juana Policy Project, and The National Organization for the Reform of Marijuana Laws to notify their membership of the survey through e-mail. Participants were asked to forward the survey information to others, and were entered into a drawing for a cash prize.
The analysis examining respiratory symptoms included only those participants who did not have cystic fibrosis or asthma, and who had never used other inhalant drugs, in order to reduce the contribution of other factors related to respiratory health. This analysis was also limited to indi-viduals whose primary method of cannabis consumption involved smoking. Therefore, those who reported con-suming cannabis primarily by eating were excluded. As a result, data from a subsample of 2,647 participants was available for the analysis predicting respiratory symp-toms. These participants were demographically equivalent to the larger sample.
Procedure
Survey
The local Institutional Review Board approved the survey and informed consent procedure. Participants were informed of the nature of the study, and were instructed that survey items would inquire about their drug use and quality of life. Informed consent was obtained at the beginning of the survey.
Measures
Demographic variables of sex and age were significantly correlated with the outcomes of interest and were there-fore included in the analyses as covariates.
Frequency
Participants reported how many days per month they used cannabis.
Quantity
As a direct measure of quantity, participants were asked to report the number of quarter ounces they used per month, on average.
Intensity of intoxication
Usual and maximum levels of intoxication were assessed to indirectly measure quantity of cannabis consumption. Participants reported the level of high they usually experi-enced ("Approximately how 'high,' 'buzzed,' 'stoned,' or intoxicated do you usually get when you use mari-juana?"), as well as the maximum level of high experi-enced in the past 90 days ("What's the highest you've been in the past 90 days?"). To maximize consistency between individuals' ratings, response options were provided along a six-point scale describing a range of highs (1 = 'light buzz', 6 = 'very high') [25].
Respiratory symptoms
Six questions that have been used in previous work on cannabis smokers [12] inquired about respiratory symp-toms: Do you have a cough? Do you cough up phlegm in the morning? Are you troubled by shortness of breath when hurrying on the level ground or walking up a slight
hill? Do you have to walk slower than most people your own age on the level ground because of breathlessness? Does your chest sound wheezy or whistling other than from colds? Do you wake up at night with tightness in your chest? Participants responded 'yes' or 'no' and symp-toms were summed to create a composite variable.
Social problems associated with cannabis use
Nineteen items from the Marijuana Problems Scale [29] assessed the experience of social problems related to can-nabis use in the past 90 days. Items included such prob-lems as getting into trouble at work, getting into fights, or losing friends because of cannabis use. Responses were made on a six-point scale of severity, anchored at 0 (no problem) and 5 (serious problem).
Dependence
Dependence symptoms were assessed using a seven-item measure based on the DSM-IV-TR criteria for substance dependence [16,30]. In each item, participants were asked to indicate whether or not they had experienced a particu-lar dependence symptom within the past 12 months.
Cigarette smoking
Cigarette smoke contributes to similar respiratory symp-toms as cannabis smoke [14,31]. Therefore, two measures of cigarette smoking were included as covariates in the analysis predicting respiratory symptoms. In one item, participants indicated if they had ever smoked cigarettes. In a second item, participants reported the average number of cigarettes they currently smoked per day.
Results
Hierarchical multiple regression analyses were conducted to examine the degree to which frequency and quantity of cannabis use predicted respiratory symptoms, social prob-lems and dependence symptoms. Separate regression analyses were conducted for each outcome, with partici-pants' age, sex, frequency of cannabis use, quantity of con-sumption, usual high, and maximum high entered as predictors in each analysis. Additionally, the analysis pre-dicting respiratory symptoms included measures of ciga-rette smoking as covariates. Significance levels for the second and third analyses were corrected to prevent inflated probability of type I error [32].
In all analyses, age and sex were included as covariates in step 1. In the analysis predicting respiratory symptoms, number of cigarettes currently smoked per day, and whether participants had ever smoked cigarettes were also included in step 1 as covariates. Next, in all analyses, fre-quency of use was entered in step 2. Quantity predictors were then entered individually, to examine their unique contribution to outcomes. Quantity of monthly con-sumption was entered in the third step of regression, usual
intoxication level in the fourth, and maximum intoxica-tion level in the fifth and final step. Inter-item correlaintoxica-tions are provided in Table 1. Results of the regression analyses indicate that the three quantity variables contributed sig-nificantly to the prediction of respiratory symptoms, social problems and dependence, over and above fre-quency of use.
Respiratory Symptoms
Altogether, the predictors for respiratory symptoms explained just over 14 % of variance in this outcome. Fre-quency of use, quarter ounces per month, and usual intox-ication level were significantly related to respiratory symptoms, in order of increasing associative strength (see Table 2). The number of respiratory symptoms reported increased the more frequently cannabis was smoked, the greater the quantity smoked, and the greater the usual level of intoxication. Participants' maximum level of intoxication was found to be negatively related to respira-tory symptoms. This finding was unexpected, and further replication would be necessary before this result could be interpreted. After controlling for the effects of frequency,
Table 2: Summary of Regression Analysis for Variables Predicting Respiratory Symptoms (N = 1868)
Variable B SE B β R2 R2-Change
Step 1 0.124 0.107***
Respondent sex 0.219 0.047 0.102***
Respondent age -0.006 0.002 -0.063*
Ever smoked cigarettes 0.115 0.064 0.057
Cigarettes smoked per day 0.028 0.003 0.268***
Step 2 0.134 0.010***
Frequency of use (days per month) 0.194 0.088 0.062*
Step 3 0.140 0.005**
Quarter ounces per month 0.297 0.094 0.087**
Step 4 0.142 0.002*
Usual intoxication intensity 0.073 0.023 0.091**
Step 5 0.144 0.002*
Maximum intoxication intensity -0.059 0.025 -0.074**
F (8,1868) = 39.267, p < 0.001.
Note. *p < 0.05, **p < 0.01, ***p < 0.001
Table 1: Intercorrelations Between Independent Variables (N = 5987)
Variables 1 2 3 4 5 6 7 8
1. Respondent age
---2. Respondent sex -0.005
---3. Ever smoked cigarettes 0.115** 0.092**
---4. Number of cigarettes per day 0.254** 0.057** 0.688**
---5. Frequency of use (days per month) 0.047** -0.021 0.159** 0.180**
---6. Quarter ounces consumed per month -0.006 -0.014 0.159** 0.238** 0.600**
---7. Usual intoxication intensity -0.310** -0.082** -0.048** -0.078** 0.052** 0.136**
---8. Maximum intoxication intensity -0.424** -0.087** -0.021 -0.086** 0.195** 0.168** 0.629**
each of the three quantity measures accounted for unique and significant variance in respiratory symptoms. With the exception of maximum intoxication, all effects were in the expected direction.
Social Problems
The set of predictors in this analysis accounted for approx-imately 12% of variance in participants' report of prob-lems associated with cannabis use. As shown in Table 3, frequency of consumption and each of the three quantity measures were positively related to the experience of can-nabis-related social problems. Those who used cannabis more often reported a significantly greater number of social problems associated with cannabis use. After con-trolling for frequency of use, the effect of quarter ounces consumed per month was in the predicted direction, but did not reach conventional significance levels (R2 change =
.001, p = .054). Both usual and maximum intoxication levels did significantly predict problems, with more
intense 'highs' corresponding with the experience of more social problems.
Dependence
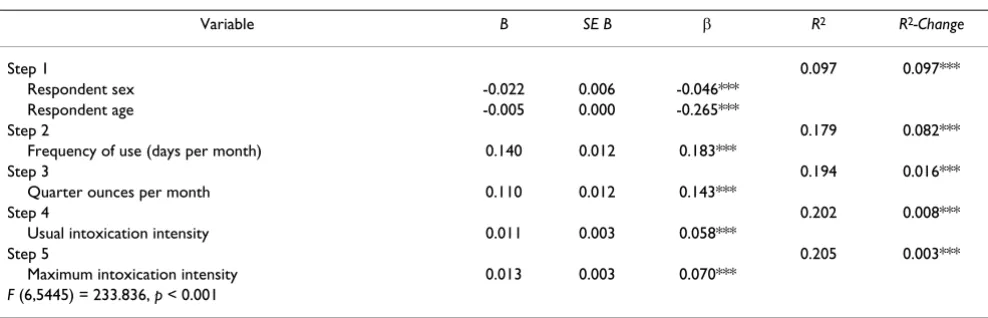
As shown in Table 4, the independent variables accounted for approximately 21% of variance in the number of dependence symptoms reported. Frequency of use and all three measures of quantity were significantly related to the endorsement of dependence symptoms. More frequent use predicted the endorsement of more dependence symptoms. What is more, each of the three quantity meas-ures accounted for a significant portion of variance in dependence symptoms, over and above frequency. Greater monthly consumption of quarter ounces was associated with a higher number of dependence symp-toms, after controlling for the contribution of frequency. Both usual and maximum intoxication levels were posi-tively related to the number of dependence symptoms
Table 4: Summary of Regression Analysis for Variables Predicting Dependence (N = 5446)
Variable B SE B β R2 R2-Change
Step 1 0.097 0.097***
Respondent sex -0.022 0.006 -0.046***
Respondent age -0.005 0.000 -0.265***
Step 2 0.179 0.082***
Frequency of use (days per month) 0.140 0.012 0.183***
Step 3 0.194 0.016***
Quarter ounces per month 0.110 0.012 0.143***
Step 4 0.202 0.008***
Usual intoxication intensity 0.011 0.003 0.058***
Step 5 0.205 0.003***
Maximum intoxication intensity 0.013 0.003 0.070***
F (6,5445) = 233.836, p < 0.001
Note. ***p < 0.001
Table 3: Summary of Regression Analysis for Variables Predicting Social Problems (N = 5828)
Variable B SE B β R2 R2-Change
Step 1 0.084 0.084***
Respondent sex -0.134 0.037 -0.045***
Respondent age -0.028 0.002 -0.246***
Step 2 0.113 0.029***
Frequency of use (days per month) 0.663 0.073 0.142***
Step 3 0.113 0.001α
Quarter ounces per month 0.078 0.073 0.017
Step 4 0.122 0.008***
Usual intoxication intensity 0.075 0.018 0.067***
Step 5 0.124 0.002**
Maximum intoxication intensity 0.065 0.019 0.058**
F (6,5827) = 136.881, p < 0.001.
reported, after controlling for frequency and quantity of quarter ounces consumed.
Summary
The results demonstrate that quantity is an important indicator of cannabis-related outcomes. The first hypoth-esis was supported, as frequency was found to be a signif-icant predictor of respiratory symptoms, social problems and dependence. The second hypothesis was also sup-ported. Quantity of cannabis use predicted respiratory symptoms, social problems and dependence, after con-trolling for the effects of frequency. Each of the three quantity measures was positively related to dependence symptoms. Two of the quantity measures, quantity of monthly consumption and level of usual intoxication, were positively associated with respiratory symptoms. When examining social problems, more intense usual and maximum intoxication levels significantly predicted a higher number of problems. In addition to predicting out-comes over and above frequency, each of the three quan-tity measures related significantly to outcomes when controlling for the effects of each other. These findings indicate that monthly consumption, usual and maximum intoxication levels not only predict cannabis-related out-comes, but that each measure conveys distinct informa-tion.
Discussion
The present study provides evidence that quantity of can-nabis use is an important predictor of both psychosocial and physiological outcomes. Variability in products, dos-age and delivery has posed a challenge to the quantifica-tion of cannabis use, and past research has typically focused on frequency. To explore the contribution of quantity to cannabis-related outcomes, we introduced three new measures of quantity and examined their rela-tion to respiratory symptoms, social problems and dependence.
Quantity was measured directly by inquiring about the number of quarter ounces participants consumed per month. As an indirect measure of quantity, we also asked participants to report their usual and maximum levels of intoxication. Consistent with the extant literature, fre-quency of use predicted social problems and dependence, as well as respiratory symptoms among cannabis smokers. After controlling for the effects of frequency, quantity of cannabis use also predicted respiratory symptoms among smokers, social problems and dependence. Each of the three quantity measures accounted for significant and unique variance in outcomes, indicating that monthly consumption, maximum and typical intoxication levels each convey distinct information related to outcomes of cannabis use.
Although the observed effects of frequency were notably larger than those of quantity, even the relatively small effects of quantity bear considerable consequence in an epidemiological context. With over 40% of people in the United States trying cannabis once or more [33], and a prevalence of problems in regular users up to 12% [34], this relatively small effect could relate to a large number of people. When addressing such important outcomes as respiratory function, social problems and dependence, each amount of variance that can be accounted for is ben-eficial. Given the popularity of cannabis, there is all the more impetus to understand the dimensions of use that are relevant to wellbeing.
There are limitations to the interpretation of results due to sampling methodology. Participants were recruited from organizations that advocate drug policy reform, and could have been hesitant to report negative experiences associ-ated with cannabis use. The occurrence of problems might therefore be underrepresented in the data. However, a full range of responses was observed for each outcome, sug-gesting that participants were likely to have been forth-coming. Previous research also indicates that substance use may be reported at least as candidly in Internet surveys as in paper-based surveys, if not more so [35,36]. There-fore, the use of web-based survey methodology may have increased the likelihood of honest self report.
find that the effects that they appreciate most will vary with quantity, perhaps with an optimal dose that is nei-ther too high nor too low. The results on respiratory effects also suggest that using smaller amounts of higher quality cannabis could enhance the safety of the plant. Examining the implications of quantity in more diverse populations would require different sampling and survey methods.
Clearly, quantity of cannabis consumed can be an impor-tant predictor of problems. Further research can employ the three new measures of quantity to help clarify its role in outcomes. These single-item indicators each reveal unique aspects of the amount consumed and contribute to the prediction of negative consequences. Continued efforts to examine quantity can have important implica-tions for prevention and treatment of cannabis-related problems. As another astute and anonymous reviewer mentioned, these data support the idea that efforts to increase the safety of cannabis can emphasize decreasing amount as well as frequency of consumption. Despite the challenges to quantification, the present findings suggest that perhaps researchers and clinicians should not only ask people how often they smoke; they should also ask how much they consume and how high they get.
Competing interests
ME is affiliated with organizations devoted to changing cannabis laws.
Authors' contributions
NW managed data, performed analyses, and drafted the manuscript, ME contributed to study design, coordination of data collection, and manuscript revisions.
Acknowledgements
A grant from the Marijuana Policy Project supported data collection. We thank Dr. Elana B. Gordis for continued support.
References
1. National Epidemiological Survey on Alcohol and Related
Conditions. National Institute on Alcohol Abuse and Alcoholism ; 2002.
2. Robins LN, Regier DA: Psychiatric Disorders in America: The Epidemiologic Catchment Area Study. Free Press; 1991. 3. Kessler RC, McGonagle KA, Zhao S, Nelson CB, et al.: Lifetime and
12-month prevalence of DSM-III--R psychiatric disorders in the United States: Results from the National Comorbidity Study. Archives of General Psychiatry 1994, 51(1):8-19.
4. Chermack ST, Blow FC, Hill EM, Mudd SA: The relationship between alcohol symptoms and consumption among older drinkers. Alcoholism, Clinical and Experimental Research 1996,
20(7):1153-1158.
5. Sanchez-Craig M: How much is too much? Estimates of hazard-ous drinking based on clients' self-reports. British Journal of Addiction 1986, 81(2):251-256.
6. Sanchez-Craig M, Israel Y: Pattern of alcohol use associated with self-identified problem drinking. American Journal of Public Health
1985, 75(2):178-180.
7. Kuschner WG, D'Alessandro A, Wong H, Blanc PD: Dose-depend-ent cigarette smoking-related inflammatory responses in healthy adults. European Respiratory Journal 1996, 9(10):1989-1994.
8. Larsson ML, Loit HM, Meren M, Polluste J, Magnusson A, Larsson K, Lundback B: Passive smoking and respiratory symptoms in the FinEsS Study. European Respiratory Journal 2003, 21(4):672-676. 9. Stephens RS, Babor TF, Kadden R, Miller M: The Marijuana
Treat-ment Project: Rationale, design and participant characteris-tics. Addiction 2002, 97(Suppl1):109-124.
10. Results from the 2003 National Survey on Drug Use and
Health: National Findings (Office of Applied Studies, NSDUH Series H–25, DHHS Publication No. SMA 04–3964).
Rockville, MD , Substance Abuse and Mental Health Services Admin-istration; 2004.
11. Taylor DR, Fergusson DM, Milne BJ, Horwood LJ, Moffitt TE, Sears MR, Poulton R: A longitudinal study of the effects of tobacco and cannabis exposure on lung function in young adults.
Addiction 2002, 97(8):1055.
12. Taylor DR, Poulton R, Moffitt TE, Ramankutty P, Sears MR: The res-piratory effects of cannabis dependence in young adults.
Addiction 2000, 95(11):1669-1677.
13. Tashkin DR: Respiratory and immunologic consequences of marijuana smoking. J Clin Pharmacol 2002, 42(90110):71-81. 14. Van Hoozen BE, Cross CE: Marijuana. Respiratory tract effects.
Clinical Reviews in Allergy and Immunology 1997, 15(3):243-269. 15. Gold MS, Miller NS: Marijuana. Marcel Dekker, Inc, New York,
NY(USA) 1991 1991.
16. Chen K, Kandel DB, Davies M: Relationships between frequency and quantity of marijuana use and last year proxy depend-ence among adolescents and adults in the United States.
Drug Alcohol Depend 1997, 46(1-2):53-67.
17. Grant BF, Pickering R: The relationship between cannabis use and DSM-IV cannabis abuse and dependence: results from the National Longitudinal Alcohol Epidemiologic Survey.
Journal of Substance Abuse 1998, 10(3):255-264.
18. Hall W, Solowij N, Lemon J: The health and psychological con-sequences of cannabis use. Monograph Series No. 25. Aus-tralian Government Publishing Service: Canberra; 1994.
19. Turner C: How much alcohol is in a 'standard drink'? An anal-ysis of 125 studies. British Journal of Addiction 1990,
85(9):1171-1175.
20. DeSimone J, Journals O: The Relationship between Illegal Drug Prices at the Retail User and Seller Levels. Contemporary Eco-nomic Policy 2006, 24(1):64-73.
21. Wilkins C, Reilly JL, Pledger M, Casswell S: Estimating the dollar value of the illicit market for cannabis in New Zealand. Drug Alcohol Rev 2005, 24(3):227 -2234.
22. Ashton CH: Pharmacology and effects of cannabis: a brief review. British Journal of Psychiatry 2001, 178(2):101-106.
23. Bolla KI, Brown K, Eldreth D, Tate K, Cadet JL: Dose-related neu-rocognitive effects of marijuana use. Neurology 2002,
59(9):1337-1343.
24. Jones RT, Benowitz NL, Herning RI: Clinical relevance of canna-bis tolerance and dependence. J Clin Pharmacol 1981,
21(8_suppl):S143-152.
25. Reinarman C, Cohen PDA, Kaal HL: The Limited Relevance of Drug Policy: Cannabis in Amsterdam and in San Francisco.
American Journal of Public Health 2004, 94(5):836-842.
26. Tashkin DP: Is frequent marijuana smoking harmful to health.
The Western Journal of Medicine 1993, 158(6):596-601.
27. Budney AJ, Kandel DB, Cherek DR, Martin BR, et al.: College on problems of drug dependence meeting, Puerto Rico (June 1996): Marijuana use and dependence. Drug Alcohol Depend
1997, 45(1-2):1-11.
28. Coffey C, Carlin JB, Lynskey M, Li N, Patton GC: Adolescent pre-cursors of cannabis dependence: Findings from the Victorian Adolescent Health Cohort Study. British Journal of Psychiatry
2003, 182(4):330-336.
29. Stephens RS, Roffman RA, Curtin L: Comparison of extended ver-sus brief treatments for marijuana use. J Consult Clin Psychol
2000, 68(5):898-908.
30. Looby A, Earleywine M: Negative consequences associated with dependence in daily cannabis users. Substance Abuse Treatment, Prevention and Policy 2007, 2(1):3.
Publish with BioMed Central and every scientist can read your work free of charge "BioMed Central will be the most significant development for disseminating the results of biomedical researc h in our lifetime."
Sir Paul Nurse, Cancer Research UK
Your research papers will be:
available free of charge to the entire biomedical community
peer reviewed and published immediately upon acceptance
cited in PubMed and archived on PubMed Central
yours — you keep the copyright
Submit your manuscript here:
http://www.biomedcentral.com/info/publishing_adv.asp
BioMedcentral 32. Rom DM: A sequentially rejective test procedure based on a
modified Bonferroni inequality. Biometrika 1990, 77(3):663.
33. Results from the 2005 National Survey on Drug Use and
Health: National Findings (Office of Applied Studies, NSDUH Series H-30, DHHS Publication No. SMA 06-4194.
In NSDUH Series H-30 Rockville, MD , Substance Abuse and Mental Health Services Administration; 2006.
34. Earleywine M: Understanding Marijuana: A New Look at the Scientific Evidence. Oxford University Press US; 2002. 35. McCabe SE, Diez A, Boyd CJ, Nelson TF, Weitzman ER: Comparing
web and mail responses in a mixed mode survey in college alcohol use research. Addictive Behaviors 2006, 31(9):1619-1627. 36. Wang YC, Lee CM, Lew-Ting CY, Hsiao CK, Chen DR, Chen WJ: