Potential distribution range of invasive
plant species in Spain
Núria Gassó1, Wilfried Thuiller2, Joan Pino1, Montserrat Vilà3
1 CREAF (Centre for Ecological Research and Forestry Applications), Universitat Autònoma de Barcelona. E-08193 Bellaterra, Catalonia, Spain 2 Laboratoire d’Ecologie Alpine, CNRS-UMR 5553, Université Joseph Fourier, BP 53, F-38041 Grenoble Cedex 9, France 3 Estación Biológica de Doñana (EBD-CSIC), Avda. Américo Vespucio, s/n, 41092 Sevilla, Spain
Corresponding author:Montserrat Vilà ([email protected])
Academic editor:I. Kühn | Received 10 November 2011 | Accepted 1 February 2012 | Published 15 February 2012
Citation: Gassó N, Thuiller W, Pino J, Vilà M (2012) Potential distribution range of invasive plant species in Spain. NeoBiota 12: 25–40. doi: 10.3897/neobiota.12.2341
Abstract
Success of invasive species has been frequently estimated as the present distribution range size in the in-troduced region. However, the present distribution range is only a picture of the invasion for a given time step and do not inform on the potential distribution range of the species. Based on niche-based models we used climatic, geographic and landscape information on the present distribution range for 78 major plant invaders in Spain to estimate and map their potential distribution range. We found a positive relationship between present and potential distribution of species. Most of the species have not yet occupied half of their potential distribution range. Sorghum halepense and Amaranthus retroflexus have the widest potential distribution range. Sorghum halepense and Robinia pseudoacacia have the highest relative occupancy (i.e. proportion of potential distribution range currently occupied). Species with a larger minimum residence time have, on average, higher relative occupancy. Our study warns managers that it might be only a matter of time that currently localized invasive species reach their potential area of distribution.
Keywords
alien plants, climate, distribution range, landscape, minimum residence time, niche models, propagule pressure, range size, species occupancy
Introduction
Invasive plant species are defined as alien species that sustain self-replacing popula-tions without direct human intervention. They produce offspring, often in very large numbers, at considerable distances from the parent plants, and thus have the potential
to spread over a large area (Pyšek et al. 2004). Yet, the spread rate of invasive species differs considerably. The distribution of invasive species is not static. There might be large differences between the present and potential distribution ranges of invasive spe-cies (Higgins et al. 1996, Sakai et al. 2001). From a management point of view, it is extremely important to identify areas not yet invaded but where early warning detec-tion and control programs are critical to implement.
Up to now, most efforts to evaluate the success of invasive species at the regional scale have been traditionally measured as the present distribution range in the region of introduction (Mack et al. 2006). However, the present geographical range size shows only a picture of the degree of invasion for a given time step, but it does not inform about the dynamics of invasion and the potential invasion range in the near future. Re-cent studies have developed niche-based models to assess the suitability of a region for a given invasive species and its potential to spread throughout (Petterson 2003, Rouget et al. 2004, Guisan and Thuiller 2005, Thuiller et al. 2005). These models are mainly based on the climate matching approach (Curnutt 2000, Pauchard et al. 2004, Watt et al. 2010, Kriticos et al. 2011). However, even at the regional scale, other factors deter-mine the distribution of species including biotic interactions, evolutionary change and dispersal ability (Pearson and Dawson 2003, Ibáñez et al. 2006). For invasive species, direct and indirect human assisted dispersal is a primary determinant of species distribu-tion. This is the reason why recent estimations of the distribution area of invasive species incorporate geographical and landscape variables related to human activities and distur-bances (Pino et al. 2005, Thuiller et al. 2006, Chytrý et al. 2008, Gassó et al. 2009).
Moreover, historical factors determining differences in propagule pressure such as the minimum residence time (i.e. time since first record) also influence the range size of invaders (Hamilton et al. 2005, Gassó et al. 2009, Ahern et al. 2010). Due to lag times, the longer the species is present in the region, the more propagules are spread and the probability of founding new populations increases (Crooks 2005, Lockwood et al. 2005). Therefore, the relationship between range size and residence time should be considered. If there is a positive relationship between the proportion of the po-tential distribution range currently occupied and the minimum residence time, we can consider that it is only a matter of time for a localised invasive species to become widespread.
Materials and methods
Species distribution
Distribution data and minimum residence time (i.e. earliest date on which a given spe-cies was recorded in Spain) were compiled from the Atlas of Invasive Plant Spespe-cies in Spain (Sanz-Elorza et al. 2004). This atlas contains spatially explicit presence records for over 100 invasive alien plant species at a resolution of 10×10 km UTM (Universal Transverse Mercator) grid. The atlas was generated using several information sources: herbarium records, publications and field surveys. From the initial database, we only calculated the potential distribution range for neophytes (i.e. established aliens intro-duced after 1500) recorded in more than 10 UTMs. We did not include archaeophytes because the minimum residence time is unknown. We also excluded UTM cells with a land proportion of less than 60% to avoid large differences of land proportion per UTM cell. Overall, our analysis is based on 2401 UTM cells and 78 invasive species (Appendix I).
Environmental data
Environmental data were obtained from different data sources that were originally at different resolutions, but we aggregated each one of them to a 10x10 km UTM grid cell scale by averaging. All the GIS procedures involving the set up of the environmen-tal variables were performed using MiraMon (Pons 2000); mapping was performed with ArcView (ESRI 1992-2006).
The selection of environmental variables was based on preliminary results on vari-ables strongly related to invasive plant species richness in Spain (Gassó et al. 2009). These included 3 climatic variables (minimum temperature in winter, annual tem-perature range, and summer rainfall), a reduction of 10 landscape variables to 5 us-ing a principal component analysis (PCA), and keepus-ing the first five orthogonal axes (cumulated explained variance = 80%) and one geographic variable (distance to the coastline) (Table 1).
pre-dictor variable. We then used the residuals of the univariate regression as a prepre-dictor into the model. We followed the same strategy for summer rainfall which was corre-lated with minimum winter temperature and annual temperature range as predictor variables (for more details on the approach, see Thuiller et al. 2006).
Estimation of potential distribution ranges
Because a precise native distribution was not known for most of the species selected, we estimated the potential range of each species using climatic, geographic and landscape information from their present distribution in Spain (see Wilson et al. 2007 for more details on the approach).
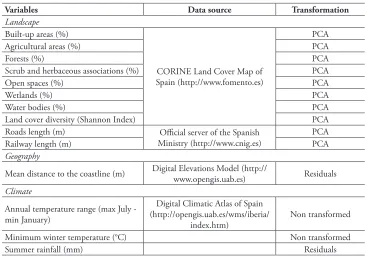
Considering that our goal was to estimate and map the potential distribution of 78 invasive species, it was impossible to find good climatic data from the native range for table 1.Initial set of environmental predictors to estimate potential distribution ranges of 78 invasive plant species in Spain. Landscape variables were reduced from 10 to 5 using a principal component analy-sis (PCA) and keeping the first five orthogonal axes (cumulated explained variance = 80%). Distance to the coastline and 3 climatic variables were also selected. For distance to the coastline we used the residuals from the regression with annual temperature range as predictor variable. For summer rainfall, we used the residuals from multiple regressions with annual temperature range and minimum winter temperature as predictor variables (for more details see Thuiller et al. 2006).
Variables Data source Transformation
Landscape
Built-up areas (%)
CORINE Land Cover Map of Spain (http://www.fomento.es)
PCA
Agricultural areas (%) PCA
Forests (%) PCA
Scrub and herbaceous associations (%) PCA
Open spaces (%) PCA
Wetlands (%) PCA
Water bodies (%) PCA
Land cover diversity (Shannon Index) PCA
Roads length (m) Official server of the Spanish
Ministry (http://www.cnig.es) PCA
Railway length (m) PCA
Geography
Mean distance to the coastline (m) Digital Elevations Model (http://www.opengis.uab.es) Residuals
Climate
Annual temperature range (max July - min January)
Digital Climatic Atlas of Spain (http://opengis.uab.es/wms/iberia/
index.htm) Non transformed
Minimum winter temperature (°C) Non transformed
all species. However, notice that we did not solely base our analysis on climatic data but also on geographic and landscape data. These variables account for habitat inva-sibility and propagule pressure influencing on the degree of invasion. Therefore, even if possibly our models might be climatically conservative they included other relevant landscape variables known to influence the degree of invasion (Vilà and Ibáñez 2011). Considering that the grain of the analysis are 10×10 km UTM grids, these maps can be used as tools for risk analysis for the different Spanish administrative regions (e.g. early warning maps for species that have still not invaded a particular administrative region).
The potential distribution range of each species was modelled as a function of the 9 selected environmental variables. All the modelling process was performed using the BIOMOD application implemented under R software. We calibrated 4 models usu-ally described as the most powerful approaches available (Elith et al. 2006, Prasad et al. 2006): generalised linear models (GLM) using a stepwise regression with AIC criteria, generalised additive models (GAM) with four degrees of smoothing using a stepwise regression with AIC criteria, Random Forest (RF) with 2000 trees, and Generalised Boosting Models(GBM) with 3000 trees and an interaction depth of 2. Models were calibrated using 70% of the initial data sets and evaluated on the remaining 30% using the Relative Operating Characteristic (ROC) curve procedure.
To avoid the usual trouble of selecting a particular model, we performed a weight-ed averaging procweight-edure across our four models as recommendweight-ed by Marmion et al. (2009). For each species, the four models were ranked according to the area under the ROC curve values (AUC), and only the best three predictions (i.e. from the best three models) were conserved and were awarded 3, 2 or 1 point(s) respectively and then standardized to produce a vector of weights whose elements sum to unity. Final projections consisted in the weighted average of these three simulations. Then, for each species, we transformed the averaged predictions into presence–absence using a thresh-old maximizing the percentage of presence and absence correctly predicted (Pearce and Ferrier 2000). For these averaged predictions, the accuracy of the simulations was assessed using the area under the ROC curve (AUC). We used the following conserva-tive rough guide for the AUC: AUC<0.8, bad model; 0.8<AUC<0.9, good model and AUC>0.9, very good model.
Statistical analyses
Invasive species are a non-random subset of all species introduced (Blackburn and Duncan 2001). Furthermore, species are linked by phylogeny (Harvey and Pagel 1991). Therefore, using species as independent data points may inflate the degrees of freedom and increase the Type-I error. We used Generalized Linear Mixed Models (GLMM) to deal with the phylogenetic effects by incorporating taxonomic categories as nested random factors (Family/Genus). Several sophisticated procedures are avail-able to implement phylogenetic structure in the model, but, in our case, there was not any robust phylogeny available covering all studied species.
Analyses were conducted in the open source R software version 2.5.1 (R Develop-ment Core Team 2005). We modelled relative occupancy with a binomial distribution of errors using the glmmPQL of the MASS library on the R statistical package (Vena-bles and Ripley 2002,R Development Core Team 2006).
Results
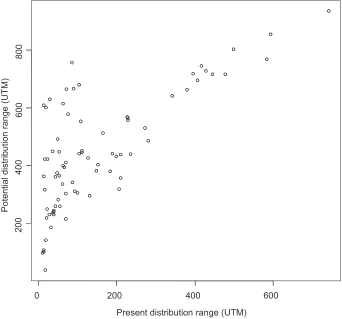
We are confident that our models to estimate the potential distribution range were very good because for most species AUC>0.9 (Appendix I). As expected, there was a positive relationship between present distribution ranges (CDR) and potential distri-bution ranges (PDR). However, present distridistri-bution ranges only explained half of the variance of the potential distribution ranges (PDR = 309.3 + 0.89CDR, R2 = 0.53,
F(1, 76) = 85.44, p < 0.01). There was a set of species, especially those that currently
oc-cupy less than 200 UTM that, according to our models, would have the potential to spread through larger areas than that expected by the linear relationship (Fig. 1).
The species with the widest potential distribution ranges were Sorghum halepense, considered as one of the top weeds in the world (Holm et al. 1977) and Amaranthus retroflexus, also a worldwide invader, both of them invading many different habitat-types (Sanz-Elorza et al. 2004). These two species were introduced more than 100 years ago and exhibit wide present distribution ranges, being spread already in more than half of their potential distribution range.
The mean (±SE) relative occupancy of species was 0.28 ± 0.02; with values ranging from 0.05 to 0.73. Most of the species have not yet occupied half of their potential geographic ranges (Fig. 2). The two species with the lowest relative occupancy were the shrub Senecio inaequidens (0.28) and the herb Tradescantia flumminensis (0.23), and the two species with the highest relative occupancy were the deciduous tree Robinia pseudoacacia (0.73) and the grass Sorghum halepense (0.72) (Fig. 3).
0 200 400 600
20
0
40
0
60
08
00
Present distribution range (UTM)
Potentia
ld
istr
ib
utio
nr
ange
(U
TM
)
Figure 1. Relationship between present (CDR) and potential (PDR) distribution ranges for 78 invasive plant species in Spain. PDR = 309.3 + 0.89CDR, R2 = 0.53, F
(1, 76) = 85.44, p < 0.01.
Relative occupancy Relative occupancy
Number
of
spec
ie
s
Number
of
spec
ie
s
Number
of
spec
ie
s
Number
of
spec
ie
s
0 5 10 15 20 25
0.1 0.2 0.3 0.4 0.5 0.6 0.7 0.8
Robinia pseudoacacia
Senecio inaequidens Tradescantia flumminensis
Sorghum halepense
Figure 3. Maps of present distribution range (black) over potential distribution range (grey) of four in-vasive plant species in Spain. The two species on top are the ones with the highest relative occupancy (i.e. proportion of the potential distribution range currently occupied) and the ones at the bottom are those with the lowest. Maps for the remaining analysed 74 invasive species are available in Appendix II.
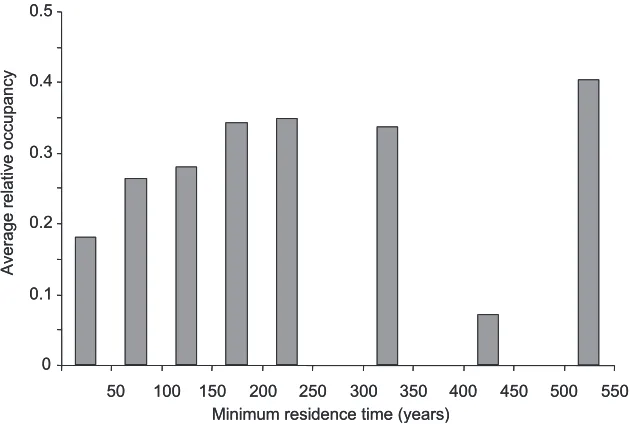
Figure 4.Average relative occupancy (i.e. proportion of the potential distribution range currently oc-cupied) for minimum residence time classes of invader plant species in Spain (N = 78).
0 0.1 0.2 0.3 0.4 0.5
50 100 150 200 250 300 350 400 450 500 550
Minimum residence time (years)
Av
erage
re
lati
ve
oc
cu
pancy
0 0.1 0.2 0.3 0.4 0.5
50 100 150 200 250 300 350 400 450 500 550
Minimum residence time (years)
Av
erage
re
lati
ve
oc
cu
Discussion
We found large differences among species in their potential distribution range in Spain. However, in general, invasive species have not yet reached half of their potential distribution ranges. On average, it takes around 150 years for a neophyte to reach its maximum distribution range in an European country (Gassó et al. 2010) and many invasive species in Spain have been introduced less than a century ago (Sanz-Elorza et al. 2004).
Our calculations of potential distribution ranges for the 78 invasive species are based on climatic conditions in the introduced range in Spain and not in the na-tive range. Theoretically, modelling the potential distribution range of an alien spe-cies should be based on climate matching envelopes build with information from the native range where the species is at equilibrium (Jiménez-Valverde et al. 2011). It is possible that recently arrived species in Spain have not yet expanded to available locali-ties of suitable climates. However, climatic information from the native range was not available for most species. Moreover, models build with climatic conditions in the na-tive range assume that the same interactions between biotic factors and climatic factors that limit the range size in the native range operate in the introduced range (Pearson and Dawson 2003). This assumption might not be correct as plant fitness, population performance and distribution range of invasive species are usually improved in the introduced than in the native range (Hierro et al. 2005). It is clear that the interactions between biotic factors and abiotic factors in the native range are different than in the introduced range (Ibáñez et al. 2006, Wilson et al. 2007). Even if our estimations of the potential distributional ranges are probably conservative, we are confident that by including geographic and landscape variables in our models, the predictions are more accurate than by only including climatic variables (Ibáñez et al. 2009).
Similarly, the association between relative occupancy and minimum residence time is weak for species introduced many centuries ago (Williamson et al. 2009) be-cause there is high uncertainly with old first records. Indeed, in Spain, some species introduced a long time ago have not yet occupied their entire potential suitable habi-tat. For example, Sophora japonica was introduced 304 years ago, but it currently oc-cupies only 11.1% of its potential distribution range, demonstrating a very low spread rate. The low spread of this species could be related to the history of its use. It was first introduced in the country in the 18th century but it was not used commonly as an ornamental species until the 20th century (Sanz-Elorza et al. 2004). Besides minimum residence time, other historical factors such as the intensity and frequency of introduc-tion determine propagule pressure and hence invasion success (Lockwood et al. 2005). For example, market availability (i.e. sold in many nurseries) and frequency (i.e. sold very often) are significant determinants of invasion by traded ornamental plant species (Dehnen-Schmutz et al. 2007). We can therefore suspect that in some species intro-duced several centuries ago there might be a substantial time lag between the date of first record and spread due to differences in historical propagule pressure (Crooks et al. 2005).
Besides propagule pressure, differences in the potential distribution range might be also explained by differences in their niche breadth (Thuiller et al. 2005) and the availability of suitable habitats for establishment. The potential distribution ranges calculated here are mainly based on abiotic factors defining a fundamental niche sensu Hutchinson and Deevey (1949), while species traits (e.g. reproduction or dispersal), local biotic interactions (e.g. competition, natural enemies, and mutualistic relation-ships), and geographical barriers for dispersal also influence alien species establishment and spread (Rejmánek et al. 2005, Ibáñez et al. 2006, Pyšek and Richardson 2006).
Our study has been possible because there was reliable spatially explicit data on the present distribution of invasive species (Sanz-Elorza et al. 2004). This empirical infor-mation, which has been a compilation of the effort by many naturalists and botanists, has been complemented by modelling approaches to estimate the potential distribu-tion area of the species. More than half of the main invasive species in Spain have not reached their potential area of distribution. However, many species would be able to reach this area in the near future because many species are ornamental and dispersal is favoured by humans (Aikio et al. 2010). We believe that the potential distribution maps of these species are a crucial early warning tool to guide control and eradication plans even if the potential distribution for recent introduced invasive species is possibly underestimated.
Acknowledgements
(SSPI-CT-2003-511202) within the 6th FP of the EU; the Spanish Ministerio de Ciencia e Innovación projects RIXFUTUR (CGL2009-7515) and MONTES (CSD2008-00040); the Junta de Andalucía project RNM-4031; and the ANR SCION project (ANR-08-PEXT-03). This paper contributes to the forthcoming Virtual Lab on Bio-logical Invasions within the LIFEWATCH framework.
References
Ahern RG, Landis DA, Reznicek AA, Schemske DW (2010) Spread of exotic plants in the landscape: the role of time, growth habit, and history of invasiveness. Biological Invasions 12: 3157–3169. doi: 10.1007/s10530-010-9707-x
Aikio S, Duncan RP, Hulme PE (2010) Lag-phases in alien plant invasions: separating the facts from the artefacts. Oikos 119: 370–378. doi: 10.1111/j.1600-0706.2009.17963.x Blackburn TM, Duncan RP (2001) Determinants of establishment success in introduced birds.
Nature 414: 195–197. doi: 10.1038/35102557
Chytrý M, Jarošík V, Pyšek P, Hájek O, Knollová I, Tichý L, Danihelka J (2008) Separating hab-itat invasibility by alien plants from the actual level of invasion. Ecology 89: 1541–1553. doi: 10.1890/07-0682.1
Crooks JA (2005) Lag times and exotic species: The ecology and management of biological invasions in slow-motion. Écoscience 12: 316–329. doi: 10.2980/i1195-6860-12-3-316.1 Curnutt JL (2000) Host-area specific climatic-matching similarity breeds exotics. Biological
Conservation 94: 341–351. doi: 10.1016/S0006-3207(99)00186-X
Dehnen-Schmutz K, Touza J, Perrings C, Williamson M (2007) A century of the ornamental plant trade and its impact on invasion success. Diversity and Distributions 13: 527–534. doi: 10.1111/j.1472-4642.2007.00359.x
Elith J, Graham CH, Anderson RP, Dudik M, Ferrier S, Guisan A, Hijmans RJ, Huettmann F, Leathwick JR, Lehmann A, Li J, Lohmann LG, Loiselle BA, Manion G, Moritz C, Nakamu-ra M, Nakazawa Y, Overton JM, Peterson AT, Phillips SJ, Richardson K, Scachetti-PereiNakamu-ra R, Schapire RE, Soberon J, Williams S, Wisz MS, Zimmermann NE (2006) Novel methods improve prediction of species’ distributions from occurrence data. Ecography 29: 129–151. doi: 10.1111/j.2006.0906-7590.04596.x
Gassó N, Sol D, Pino J, Dana ED, Lloret F, Sanz-Elorza M, Sobrino E, Vilà M (2009) Explor-ing species attributes and site characteristics to assess plant invasions in Spain. Diversity and Distribution 15: 50–58. doi: 10.1111/j.1472-4642.2008.00501.x
Gassó N, Pyšek P, Vilà M, Williamson M (2010) Spreading to a limit: the time required for a neophyte to reach its maximum range. Diversity and Distributions 16: 310–311. doi: 10.1111/j.1472-4642.2010.00647.x
Guisan A, Thuiller W (2005) Predicting species distribution: offering more than simple habitat models. Ecology Letters 8: 993–1009. doi: 10.1111/j.1461-0248.2005.00792.x
Harvey PH, Pagel MD (1991) The comparative method in evolutionary biology. Oxford Uni-versity Press, Oxford.
Hierro JL, Maron JL, Callaway RM (2005) A biogeographical approach to plant invasions: the importance of studying exotics in their introduced and native range. Journal of Ecology 93: 5–15. doi: 10.1111/j.0022-0477.2004.00953.x
Higgins SI, Richardson DM (1996) A review of models of alien plant spread. Ecological Mod-elling 87: 249–265. doi: 10.1016/0304-3800(95)00022-4
Holm LG, Plucknett DL, Pancho JV, Herberger JP (1977) The world’s worst weeds, distribu-tion and biology. East-West Center. Honolulu: Univ. Pr. Hawaii.
Hutchinson GE, Deevey ES (1949) Ecological studies in population. Survey of Biological Pro-gress 1: 325–359.
Ibáñez I, Clark JS, Dietze MC, Feeley K, Hersh M, LaDeau S, McBride A, Welch NE, Wolo-sin MS (2006) Predicting biodiversity change: outside the climate envelope, beyond the species-area curve. Ecology 87: 1896–1906. doi: 10.1890/0012-9658(2006)87[1896:PB-COTC]2.0.CO;2
Ibáñez I, Silander JA, Wilson A, LaFleur N, Tanaka N, Tsuyama I (2009) Multi-variate forecasts of potential distribution of invasive plant species. Ecological Applications 19: 359–375. doi: 10.1890/07-2095.1
Jiménez-Valverde A, Peterson AT, Soberón J, Overton JM, Aragón P, Lobo JM (2011) Use of niche models in invasive species risk assessments. Biological Invasions 13: 2785–2797. doi: 10.1007/s10530-011-9963-4
Kriticos DJ, Watt MS, Potter KJB, Manning LK, Alexander NS, Tallent-Halsell N (2011) Managing invasive weeds under climate change: considering the present and potential
future distribution of Buddleja davidii. Weed Research 51: 85–96. doi:
10.1111/j.1365-3180.2010.00827.x
Lockwood JL, Cassey P, Blackburn TM (2005) The role of propagule pressure in explain-ing species invasions. Trends in Ecology and Evolution 20: 223–228. doi: 10.1016/j. tree.2005.02.004
Mack RN, Simberloff D, Lonsdale WM, Evans H, Clout M, Bazzaz F (2006) Biotic inva-sions: causes, epidemiology, global consequences, and control. Ecological Applications 10: 689–710. doi: 10.1890/1051-0761(2000)010[0689:BICEGC]2.0.CO;2
Marmion M, Parviainen M, Luoto M, Heikkinen RK, Thuiller W (2009) Evaluation of con-sensus methods in predictive species distribution modelling. Diversity and Distributions 15: 59–69. doi: 10.1111/j.1472-4642.2008.00491.x
Pauchard A, Cavieres LA, Bustamante R (2004) Comparing alien plant invasions among re-gions with similar climates: where to from here? Diversity and Distributions 10: 371–375. doi: 10.1111/j.1366-9516.2004.00116.x
Pearson RG, Dawson TP (2003) Predicting the impacts of climate change on the distribution of species: Are bioclimate envelope models useful? Global Ecology and Biogeography, 12: 361–371. doi: 10.1046/j.1466-822X.2003.00042.x
Pino J, Font X, Carbó J, Jové M, Pallarès L (2005) Large-scale correlates of alien plant
inva-sion in Catalonia (NE of Spain). Biological Conservation 122: 339–350. doi: 10.1016/j.
biocon.2004.08.006
Pons X (2002) MiraMon. Sistema d’informació geogràfica i software de teledetecció, Centre de Re-cerca Ecològica i Aplicacions Forestals, CREAF, Bellaterra. doi: 10.1007/s10021-005-0054-1 Prasad AM, Iverson LR, Liaw A (2006) Newer classification and regression tree techniques:
bagging and random forests for ecological prediction. Ecosystems 9: 181–199.
Pyšek P, Richardson DM, Rejmánek M, Webster GL, Williamson M, Kirschner J (2004) Alien plants in checklists and floras: towards better communication between taxonomists and ecologists. Taxon 53: 131–143. doi: 10.2307/4135498
Pyšek P, Richardson DM (2006) The biogeography of naturalization in alien plants. Journal of Biogeography 12: 2040–2050.
R Development Core Team (2006) R: A language and environment for statistical computing. R Foundation for Statistical Computing, Vienna, Austria. http://www.R-project.org
Rejmánek M, Richardson DM, Higgins SI, Pitcairn MJ, Grotkopp E (2005) Ecology of invasive plants - state of the art. In: Mooney HA, Mack RN, McNeely JA, Neville L, Schei PJ, Waage J (Eds) Invasive alien species: a new synthesis. Island Press, Washington, D.C: 104–161. Rouget M, Richardson DM, Nel JL, Le Maitre DC, Egoh B, Mgidi T (2004) Mapping the
potential ranges of major plant invaders in South Africa, Lesotho and Swaziland using climatic suitability. Diversity and Distributions 10: 475–484. doi: 10.1111/j.1366-9516.2004.00118.x
Sanz-Elorza M, Dana ED, Sobrino E (2004) Atlas de las plantas alóctonas invasoras de España. Dirección General para la Biodiversidad, Madrid.
Sakai AK, Weller SG, Allendorf FW, Holt JS, Lodge DM, Molofsky J, With KA, Baughman S, Cabin RJ, Cohen JE, Ellstrand NC, McCauley DE, O’Neil P, Parker IM, Thompson JN (2001) The population biology of invasive species. Annual Review of Ecology and System-atics 32: 305–332. doi: 10.1146/annurev.ecolsys.32.081501.114037
Thuiller W, Richardson DM, Pyšek P, Midgley GF, Hughes GO, Rouget M (2005) Niche-based modelling as a tool for predicting the risk of alien plant invasions at a global scale. Global Change Biology 11: 2234–2250. doi: 10.1111/j.1365-2486.2005.001018.x Thuiller W, Richardson DM, Rouget M, Procheş Ş, Wilson JRU (2006) Interactions between
environment, species traits and human uses describe patterns of plant invasion. Ecology 87: 1755–1769. doi: 10.1890/0012-9658(2006)87[1755:IBESTA]2.0.CO;2
Václavík T, Meentemeyer RK (2012) Equilibrium or not? Modelling potential distribution of invasive species in different stages of invasion. Diversity and Distributions 18: 73–83. doi: 10.1111/j.1472-4642.2011.00854.x
Venables WN, Ripley BD (2002) Modern applied statistics with S. 4rth edt. Springer, New York. Vilà M, Ibáñez I (2011) Plant invasions in the landscape. Landscape Ecology 26: 461–472. doi:
10.1007/s10980-011-9585-3
Williamson M, Dehnen-Schmutz K, Kühn I, Hill M, Klotz S, Milbau A, Stout J, Pyšek P (2009) The distribution of range sizes of native and alien plants in tour European coun-tries and the effects of residence time. Diversity and Distributions 15: 158–166. doi: 10.1111/j.1472-4642.2008.00528.x
Wilson JRU, Richardson DM, Rouget M, Procheş Ş, Amis MA, Henderson L, Thuiller W (2007) Residence time and potential range: crucial considerations in plant invasion ecol-ogy. Diversity and Distributions 13: 11–22. doi: 10.1111/j.1366-9516.2006.00302.x
Appendix I
Minimum residence time (MRT; years), present distribution ranges (CDR; number of UTM 10x10 km), potential distribution ranges (PDR; number of UTM 10×10 km) and relative occupancy (i.e. proportion of the potential distribution range currently occupied) for 78 invasive plant species in Spain. PDR were calculated according to an averaged model of 4 potential distribution models for each species. The area under the ROC curve (AUC) of the averaged model is shown on the table.
Family Species MRT CDR PDR OCCUPANCY AUC
Malvaceae Abutilon theophrasti 74 94 680 0.14 0.92
Fabaceae Acacia cyanophylla 204 20 217 0.09 0.98
Fabaceae Acacia dealbata 204 204 356 0.57 0.99
Fabaceae Acacia melanoxylon 204 71 214 0.33 1.00
Aceraceae Acer negundo 204 61 393 0.16 0.95
Asteraceae Achillea filipendulita 22 18 37 0.49 1.00
Agavaceae Agave americana 504 217 557 0.39 0.97
Simaroubaceae Ailanthus altísima 186 210 563 0.37 0.96
Amaranthaceae Amaranthus albus 143 408 716 0.57 0.95
Amaranthaceae Amaranthus blitoides 94 445 715 0.62 0.96
Amaranthaceae Amaranthus hybridus 124 368 718 0.51 0.94
Amaranthaceae Amaranthus muricatus 96 189 432 0.44 0.97
Amaranthaceae Amaranthus powellii 21 83 666 0.12 0.93
Amaranthaceae Amaranthus retroflexus 104 551 854 0.65 0.94
Amaranthaceae Amaranthus viridis 106 100 444 0.23 0.95
Asclepiadaceae Araujia sericifera 28 90 311 0.29 0.98
Asteraceae Arctotheca calendula 88 23 421 0.05 0.97
Asteraceae Artemisia verlotiorum 91 158 512 0.31 0.97
Asteraceae Aster squamatus 92 320 641 0.50 0.96
Cactaceae Austrocylindropuntia subulata 20 48 282 0.17 0.98
Asteraceae Baccharis halimifolia 55 14 106 0.13 1.00
Asteraceae Bidens aurea 41 64 663 0.10 0.91
Asteraceae Bidens frondosa 60 83 341 0.24 0.97
Asteraceae Bidens pilosa 91 21 249 0.08 0.98
Asteraceae Bidens subalternans 69 131 295 0.44 0.99
Poaceae Bromus willdenowii 100 144 403 0.36 0.97
Family Species MRT CDR PDR OCCUPANCY AUC
Aizoaceae Carpobrotus edulis 104 98 441 0.22 0.97
Poaceae Chloris gayana 102 23 249 0.09 0.99
Asteraceae Conyza bonariensis 132 348 662 0.53 0.95
Asteraceae Conyza canadensis 220 456 803 0.57 0.94
Asteraceae Conyza sumatrensis 100 265 485 0.55 0.96
Poaceae Cortaderia selloana 35 61 335 0.18 0.98
Asteraceae Cotula coronopifolia 107 42 361 0.12 0.97
Solanaceae Datura innoxia 504 62 410 0.15 0.94
Solanaceae Datura stramonium 504 386 744 0.52 0.95
Poaceae Echinochloa hispidula 36 37 242 0.15 0.99
Poaceae Echinochloa oryzicola 104 36 449 0.08 0.98
Poaceae Echinochloa oryzoides 36 28 629 0.04 0.95
Elaeagnaceae Elaeagnus angustifolia 204 54 614 0.09 0.92
Poaceae Eleusine indica 143 43 259 0.17 0.99
Hydrocharitaceae Elodea canadensis 99 13 362 0.04 0.97
Myrtaceae Eucalyptus camaldulensis 204 70 578 0.12 0.95
Myrtaceae Eucalyptus globulus 204 200 317 0.63 0.99
Polygonaceae Fallopia baldschuanica 26 79 757 0.10 0.94
Caesalpiniaceae Gleditsia triacanthos 56 51 364 0.14 0.97
Asclepiadaceae Gomphocarpus fruticosus 242 53 259 0.20 0.99
Boraginaceae Heliotropium curassavicum 130 36 230 0.16 0.98
Asteraceae Helianthus tuberosus 304 179 380 0.47 0.98
Convolvulaceae Ipomoea indica 104 144 381 0.38 0.98
Convolvulaceae Ipomoea purpurea 104 101 553 0.18 0.94
Convolvulaceae Ipomoea sagittata 304 36 235 0.15 0.99
Verbenaceae Lippia filiformis 404 44 490 0.09 0.95
Caprifoliaceae Lonicera japonica 43 70 303 0.23 0.99
Nyctaginaceae Mirabilis jalapa 119 223 438 0.51 0.98
Solanaceae Nicotiana glauca 152 120 425 0.28 0.96
Onagraceae Oenothera biennis 156 100 451 0.22 0.96
Onagraceae Oenothera glazioviana 80 50 446 0.11 0.95
Cactaceae Opuntia dillenii 130 17 421 0.04 0.99
Cactaceae Opuntia ficus-indica 504 396 728 0.54 0.96
Oxalidaceae Oxalis pes-caprae 154 199 437 0.46 0.97
Poaceae Paspalum dilatatum 97 178 441 0.40 0.97
Poaceae Paspalum paspalodes 180 216 568 0.38 0.97
Poaceae Paspalum vaginatum 97 38 239 0.16 0.98
Polygonaceae Reynoutria japonica 30 14 100 0.14 1.00
Fabaceae Robinia pseudoacacia 304 559 768 0.73 0.97
Asteraceae Senecio inaequidens 20 14 609 0.02 0.94
Asteraceae Senecio mikanioides 71 19 141 0.13 0.96
Solanaceae Solanum bonariense 121 42 374 0.11 0.97
Fabaceae Sophora japonica 304 11 97 0.11 1.00
Poaceae Sorghum halepense 204 674 935 0.72 0.95
Appendix II
Maps of present distribution range over potential distribution range for 78 invasive plant species in Spain. (doi: 10.3897/neobiota.12.2341.app2) File format: PDF.
Explanation note: Maps of present distribution range (purple) over potential
distribu-tion range (grey) for 78 invasive plant species in Spain. Potential distribudistribu-tion ranges were calculated by niche models as a function of climatic, geographic and landscape variables on the present distribution of species at 10×10 km UTM resolution. Niche models were build by weighted averaging procedures across GLM, GAM, RF and GBM models.
Copyright notice: This dataset is made available under the Open Database License
(http://opendatacommons.org/licenses/odbl/1.0/). The Open Database License (ODbL) is a license agreement intended to allow users to freely share, modify, and use this Dataset while maintaining this same freedom for others, provided that the original source and author(s) are credited.
Citation: Gassó N, Thuiller W, Pino J, Vilà M (2012) Potential distribution range of invasive plant species in Spain. NeoBiota 12: 25–40. doi: 10.3897/neobiota.12.2341.app2
Family Species MRT CDR PDR OCCUPANCY AUC
Poaceae Stenotaphrum secundatum 101 27 230 0.12 0.97
Commelinaceae Tradescantia fluminensis 304 17 601 0.03 0.92
Tropaeolaceae Tropaeolum majus 404 16 315 0.05 0.97
Asteraceae Xanthium spinosum 304 367 694 0.53 0.95
Asteraceae Xanthium strumarium 122 262 530 0.49 0.97