VOLUME 37, ARTICLE 35, PAGES 1081
,
1230
PUBLISHED 17 OCTOBER 2017
http://www.demographic-research.org/Volumes/Vol37/35/
DOI: 10.4054/DemRes.2017.37.35
Research Material
Life-table representations of family dynamics
in the 21
st
century
Gunnar Andersson
Elizabeth Thomson
Aija Duntava
© 2017 Gunnar Andersson, Elizabeth Thomson & Aija Duntava.
1
Introduction
1082
2
Data issues
1083
3
Methods
1088
4
Illustrative results
1088
5
Discussion
1096
6
The database
1098
7
Acknowledgments
1101
References
1103
Life-table representations of family dynamics in the 21
st
century
Gunnar Andersson
1Elizabeth Thomson
2Aija Duntava
3BACKGROUND
A key resource for cross-national comparative research on family dynamics (Andersson
and Philipov 2002) is seriously outdated.
OBJECTIVE AND METHODS
We provide an update of the life-table estimates by Andersson and Philipov (2002)
based on data from the Generations and Gender Surveys and other related surveys in 18
countries across Europe and the United States.
RESULTS
Life-table estimates of family formation of women and men, union dynamics, and
children’s experience of family disruption and family formation demonstrate the degree
of variation in family dynamics across countries.
CONCLUSIONS
Our findings provide the basis for more in-depth research on the causes and
consequences of differences in family dynamics across contexts.
CONTRIBUTION
1. Introduction
Any sound investigation of a demographic phenomenon must originate from
some knowledge about its very basic patterns: how common the demographic
event of interest is, at what ages it typically occurs, and how such patterns in
a country differ from those in other countries and periods.
(Andersson and
Philipov 2002)
The above assertion was the rationale for a key resource for cross-national comparative
research on family dynamics in the 1980s and 1990s. Andersson and Philipov (2002)
generated a standard set of life tables and other descriptive measures for family
formation and family dissolution, focusing in particular on the role of cohabitation and
parenthood; see also Andersson (2002a, 2002b). They used data from the Fertility and
Family Surveys that were conducted in a large number of European countries in 1989–
1997, and comparable data from the US National Survey of Family Growth.
Appropriate data was available for 16 countries: Sweden, Norway, Finland, France, the
United States, Austria, Germany, Belgium, Italy, Spain, the Czech Republic, Hungary,
Slovenia, Latvia, Lithuania, and Poland. For Belgium the data covered only Flanders.
East and West Germany were treated as separate countries because the retrospective
biographical events occurred mostly prior to reunification.
This data is now seriously out of date. Fortunately, the Generations and Gender
Surveys and other related country-specific surveys have since then provided updated
data on birth and union histories. Many of these histories have been compiled in a
single file known as the Harmonized Histories (
http://www.nonmarital.org/Harm
mHist.htm
). Additional and related data is available from the Changing Life Course
Regimes (CLiCR) database (Duntava and Billingsley 2013). In our current project, we
have generated the same estimates as reported by Andersson and Philipov (2002) from
these new histories for the period around 2005. Estimates cover 19 countries: Sweden,
Norway, Germany, France, the United States, Spain, Italy, Austria, Netherlands,
Belgium, Estonia, Lithuania, Poland, the Czech Republic, Hungary, the Russian
Federation, Romania, Bulgaria, and Georgia. Direct comparisons can be made for 11
countries included in the previous report.
Three broad groups of tabulations are included. First we present measures of
women’s and men’s family formation, i.e., the cumulative percent of women or men
who would experience a specific demographic event by single-year ages from 15 to 50.
As compared to Andersson and Philipov, and to cover patterns in postponed family
formation, we have extended the upper age limit with another ten years of observation.
(In some cases we still have to stop observation at earlier ages due to age limits in the
survey.) Second, we present measures of union experience by duration of union, from
union formation to 15 years later. In this case the union is the unit of observation, so
information about women and men is pooled. Third, we present life-table measures of
children’s experience of family formation and of family dissolution, all calculated from
information provided by mothers. In most cases, we present information by single years
of age, up to the 15
thbirthday. In addition, we present a summary of the fractions of
total time that men, women, and children would spend in various family types if the
observed age-specific spells by family type prevailed throughout the reproductive ages
or during childhood.
2. Data issues
The life-table estimates are based on union and birth histories, dated by year and month
of event. For coresidential unions we require the start and end month (or month of
interview if union has not ended), as well as the marriage month if the couple married at
the start or after a period of nonmarital cohabitation. Such histories are the foundation
of the Generations and Gender Programme, within which the first survey waves were
conducted between 2003 and 2013 in 18 countries (Vikat et al. 2008; Vergauwen et al.
2015; Fokkema et al. 2016;
www.ggp-i.org
). This data has been combined with data
from other surveys in the Harmonized Histories (Perelli-Harris, Kreyenfeld, and
Kubisch 2010;
www.nonmarital.org
) and the Changing Life-Course Regimes (CLiCR)
database (Duntava and Billingsley 2013), with some eastern and central European
countries included in both.
Because this data is publicly available, we explain below some modifications in
the data we used for the life-table analysis. We applied a modified version of the
Harmonized Histories code to GGP wave 1 files downloaded from the official website
(
www.ggp-i.org
). For example, missing months in the Harmonized Histories are
for Hungary available at the time was discovered to contain large errors, so we
produced a corrected data file from data provided by the HCSO Demographic Research
Institute of Hungary. The files we created for Bulgaria, Estonia, Georgia, Hungary,
Lithuania, Poland, Romania, and Russia are derived from the CLiCR dataset. Data for
the Czech Republic is also found in CLiCR and was harmonized during the work with
the current project; at the time CLiCR was created, the Czech GGP data was not yet
available. We did not use the Harmonized Histories data from the British Household
Panel Survey or the Swiss Household Panel Survey because they did not provide data
for all of the transitions or age ranges to be documented. Data for Germany was
produced with unique code from the German National Educational Panel Study
(Blossfeld, Roßbach, and von Maurice 2011) instead of the GGS. The German GGS
histories, included in the Harmonized Histories, are known to generate invalid estimates
of several birth and union transitions (Kreyenfeld, Hornung, and Kubisch 2013).
Because not all data was available in the NEPS, we used the German GGS to derive
estimates of home-leaving.
Table 1:
Size of study populations for life tables, by country in alphabetical
order
Ages of respondents
Men Women Mothers Children Men Women
Austria 1,754 2,583 1,473 2,871 18–45 18–45
Belgium 1,429 1,619 1,149 2,339 18–55 18–54
Bulgaria 4,002 5,065 3,688 6,395 17–55 18–55
Czech R. 3,041 3,090 1,942 3,559 17–55 17–55
Estonia 1,735 2,770 2,166 4,374 20–55 20–55
France 2,546 3,515 2,275 4,728 17–55 17–55
Georgia 3,200 3,713 2,727 5,800 18–55 17–55
Germany (NEPS) 3,873 4,071 2,963 5,872 21–55 22–55
Hungary 3,670 4,174 2,980 5,912 20–55 20–55
Italy – 12,011 7,090 13,370 – 18–55
Lithuania 3,227 3,060 2,072 3,581 17–55 17–55
Netherlands (FFS) 3,024 3,476 2,325 4,897 18–55 18–55
Norway 4,389 4,529 3,081 6,754 18–55 18–55
Poland 4,983 6,287 4,548 9,273 18–55 18–55
Romania 3,765 3,444 2,710 5,154 18–55 18–55
Russia 2,807 4,204 3,379 5,662 17–55 17–55
Spain (SFS) – 5,174 2,877 5,427 – 14–55
Sweden 2,568 2,779 1,718 3,649 17–55 17–55
USA (NSFG) 5,302 6,405 3,269 6,823 14–45 14–45
may be de facto marriages as well, to a much larger extent than is the case in other
countries. The same holds for Bulgaria, where at least ethnic minority people are less
inclined than others to register their marriages with the authorities (Kostova 2008;
Hoem and Kostova 2008). Even the majority population may show patterns where
cohabiting couples behave as married people do. Cohabiting unions in Spain also show
patterns that are surprisingly marriage-like, with unusually low levels of union
dissolution (see similar findings in Esping-Andersen et al. 2013).
Table 2:
Number of respondents and exclusions of respondents from survey
samples
Country Initial Form. Marr. Disr. Childb. Misc. Total
deleted
% del Final
Austria 4,440 78 4 15 5 1 103 2.3 4,337
Belgium 4,332 307 896 21 53 7 1,284 29.6 3,048
Bulgaria 9,435 115 73 48 109 23 368 3.9 9,067
Czech R. 6,696 213 72 79 145 56 565 8.4 6,131
Estonia 4,512 6 1 0 0 0 7 0.2 4,505
France 6,203 48 56 26 6 6 142 2.3 6,061
Georgia 6,968 1 0 9 45 0 55 0.8 6,913
Germany (NEPS) 8,363 213 68 92 35 11 419 5.0 7,944
Hungary 8,844 892 25 57 26 0 1,000 11.3 7,844
Italy 12,237 62 0 140 24 0 226 1.8 12,011
Lithuania 6,473 95 23 31 28 9 186 2.9 6,287
Netherlands (FFS) 6,824 10 3 190 121 0 324 4.7 6,500
Norway 9,470 280 131 114 23 4 552 5.8 8,918
Poland 11,458 87 57 26 16 2 188 1.6 11,270
Romania 7,289 11 6 12 51 0 80 1.1 7,209
Russia 7,220 61 24 40 25 59 209 2.9 7,011
Spain (SFS) 5,779 197 99 100 84 125 605 10.5 5,174
Sweden 5,575 164 21 38 0 5 228 4.1 5,347
USA (NSFG) 11,936 59 40 52 40 38 229 1.9 11,707
Notes: Exclusions due to missing data on: Form. = union formation; marr. = marriage formation; disr. = union disruption; childb. = childbearing; misc. = miscellaneous issues.
observe. Table 3 lists the study periods for which exposures and events are observed in
each country, i.e., to which the synthetic cohort estimates apply.
Table 3:
Study period/synthetic cohorts for life tables
Country Data source Study period
Austria GGS / HH 2003–2009
Belgium GGS / HH 2003–2010
Bulgaria GGS / CLiCR 1999–2004
Czech R. Newly released GGS 2000–2005
Estonia GGS / CLiCR 1999–2005
France GGS / HH 2000–2005
Georgia GGS / CLiCR 2001–2006
Germany NEPS 2003*/2005–2011
Hungary GGS / CLiCR 1999–2005
Italy GGS / HH 1998–2003
Lithuania GGS / CLiCR 2001–2006
Netherlands FFS for GGS / HH 1998–2003
Norway GGS / HH 2002–2008
Poland GGS / CLiCR 2005–2011
Romania GGS / CLiCR 2000–2005
Russia GGS / CLiCR 1999–2004
Spain SFS for GGS / HH 2001–2006
Sweden Newly released GGS 2007–2013
USA NSFG for GGS / HH 2001–2008
Notes:* For tables on union formation the German study covers 9 years prior to survey.
States because minority-race groups were oversampled and have family patterns that
are very different from the majority.
3. Methods
Life-table estimates (Hoem 2001; 2011) are based on age- or duration-specific annual
transitions over the period observed (Table 3). Adult life courses are observed for the
study of family formation from age 15 to event occurrence or age 50 (age 40 for some
surveys) if an event of interest does not occur. When the event is contingent on an
earlier event (e.g., separation or marriage within a cohabiting union), the window of
observation is up to 15 years. Unions cease to be observed when a partner is known to
have died. Children’s life courses are observed from birth to age 15 if the event of
interest does not occur. The event of leaving a parental union includes parental
separation, moving away from both parents, and the death of the father. Observations
are otherwise censored when the child is known to have died or lived separately from
the mother prior to age 15; such occurrences are quite rare. All durations are based on
exact months.
Some events are competing, i.e., if one occurs the other cannot. Unions may be
formed by cohabitation or marriage. Cohabitation may end by marriage or separation.
In such cases we use single-decrement life tables, censoring at the occurrence of the
competing event, and also double-decrement life tables where the same population is
included in the risk set for each event. This means that the sum of the probabilities for
the competing events is the same as the probability for either event having occurred
(Hoem 2011).
Like all statistical estimates, our life-table measures are exposed to the influence of
stochastic variation (cf. Chiang 1984), net of any other uncertainty that may stem from
a particular sampling scheme. This variation can be addressed by viewing the life-table
estimates as the outcome of a number of Poisson distributed events (Brillinger 1986).
We limit the role of stochastic uncertainty by censoring all life-table estimates at a
situation when no more than 15 individuals remain under risk at a given transition.
4. Illustrative results
selected indicators for men and women, couples, and children. These summary
indicators are not necessarily presented in the order of the appendix tables; we chose to
keep all appendix tables in the same order as Andersson and Philipov (2002) to
facilitate comparisons across time and across outcomes.
Table 4 describes the transition to adulthood across countries. This table is sorted
with countries ordered in a similar way as in Andersson and Philipov (2002) and as in
all our appendix tables. Countries in western Europe constitute one block, those of
central and eastern Europe a second one. Cell entries in Table 4 are the median ages at
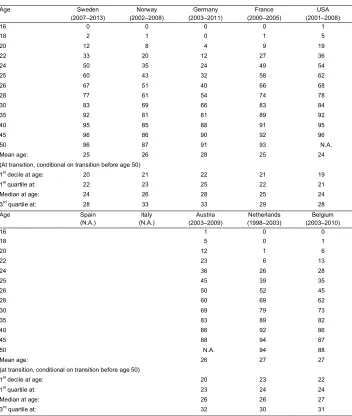
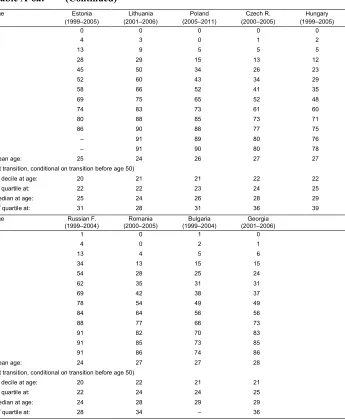
leaving the parental home (Appendix Tables A-1a/b), first union formation (Appendix
Tables A-6a/b), first marriage (Appendix Tables A-7a/b), and first birth (Appendix
Tables A-8a/b): These are the ages when at least 50% of men and women have
experienced the event of interest.
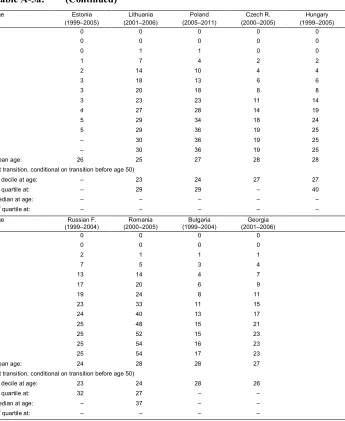
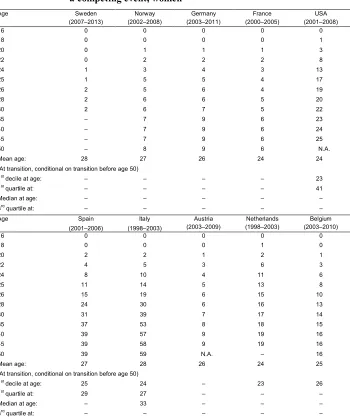
4Note that estimates for first marriage are independent
of any cohabitation. Appendix Tables A-2a/b, A-3a/b, A-4a/b, and A-5a/b provide
estimates for first cohabitation and first marriage based on single-decrements
(censoring for the other event) or double-decrements (competing risk) designs. As
noted by ‘N.A.,’ the Spanish and Italian surveys did not include men, and questions on
leaving home were not asked in the US or Hungarian surveys.
Table 4:
Median ages, transitions to adulthood
Men Women
Home-leaving Union Marriage Parent Home-leaving Union Marriage Parent
Sweden 21 24 37 32 20 23 35 30
Norway 20 26 39 33 20 24 38 30
Germany 21 28 35 36 20 26 32 32
France 21 25 35 32 20 23 33 29
USA N.A. 24 30 31 N.A. 22 27 28
Spain N.A. N.A. N.A. N.A. 26 27 31 32
Italy N.A. N.A. N.A. N.A. 28 30 31 33
Austria 24 26 35 34 21 24 33 30
Netherlands 24 26 32 33 21 23 29 30
Belgium 25 27 37 32 24 24 32 28
Estonia 25 25 -- 31 21 22 36 27
Lithuania 21 24 29 29 21 23 27 27
Poland 25 26 29 30 23 24 27 27
Czech Republic 24 28 37 36 23 25 29 28
Hungary N.A. 29 35 34 N.A. 25 32 30
Russian F. 21 24 27 28 20 21 24 24
Romania 26 28 30 31 23 24 25 26
Bulgaria 24 29 42 31 22 25 30 26
Georgia 29 29 40 30 24 25 37 26
Notes: N.A. = Not available; events refer to first-order events; median age = age at when 50% of all men or women have experienced the transition.
An overview of union stability is shown in Table 5. Estimates are based on a
synthetic cohort of unions, observed at varying durations in the six years prior to
interview. In this table, we do not distinguish between male and female respondents; all
unions reported by men or women are included. (For Spain and Italy, where men were
not interviewed, estimates are based on women’s reports.) The table has been sorted so
that countries appear in order of increasing levels of overall union instability; Georgia
has the most stable, the United States the least stable coresidential unions. (For unsorted
tables, see the Appendix.)
marry in Bulgaria, Czech Republic, Germany, the Netherlands, Poland, Romania, and
the Russian Federation.
Table 5:
Partnership dynamics
Cohabiters Separated within ten years (%)
Married in ten years (%)* All unions Cohabiting** Married** Ratio C/M
Georgia 47 7 7 6 1.17
Spain 45 12 17 8 2.13
Romania 58 13 20 8 2.50
Bulgaria 56 14 15 10 1.50
Italy 49 19 41 10 4.10
Poland 63 24 34 11 3.09
Netherlands 57 27 30 11 2.73
Lithuania 47 28 38 14 2.71
Czech R. 50 31 36 19 1.89
Belgium 43 34 39 – –
Estonia 36 34 35 33 1.06
Hungary 39 34 46 13 3.54
Germany 51 38 40 17 2.35
Russian F. 51 40 48 24 2.00
Norway 34 41 44 13 3.38
Sweden 33 46 47 20 2.35
Austria 42 46 48 16 3.00
France 39 49 51 20 2.55
USA 47 56 62 32 1.94
Notes:* Competing risk: separation, ** Status at start of union, no censoring for marriage of cohabiters.
greater for unions beginning with cohabitation than for those beginning with marriage.
The complete life-table estimates also provide information on the stability of childless
couples (Appendix Table A-18) and parental unions (Appendix Table A-28).
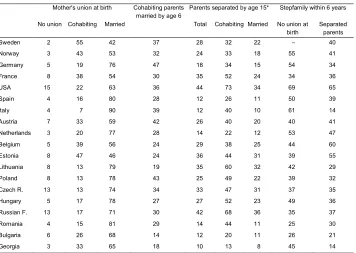
Table 6 shows key parameters for the family experiences of children, based on
mothers’ birth and union histories. The countries are again sorted in the same order as
in the appendix tables. The first three columns present the distribution of births in
marriage, cohabitation, or to lone mothers (Appendix Table A-30). Lone motherhood is
rare in all countries, but notably higher in the United States (15%) and in the Russian
Federation and Czech Republic (13%). Births to cohabiting women comprise a third or
more of all births in Sweden, Norway, France, Austria, Belgium, and Estonia. Marital
births are overwhelmingly in the majority in Germany, the Netherlands, and the
southern and majority of eastern European countries.
Table 6:
Children’s family experiences
Mother's union at birth Cohabiting parents married by age 6Parents separated by age 15* Stepfamily within 6 years
No union Cohabiting Married Total Cohabiting Married No union at birth
Separated parents
Sweden 2 55 42 37 28 32 22 – 40
Norway 3 43 53 32 24 33 18 55 41
Germany 5 19 76 47 18 34 15 54 34
France 8 38 54 30 35 52 24 34 36
USA 15 22 63 36 44 73 34 69 65
Spain 4 16 80 28 12 26 11 50 39
Italy 4 7 90 39 12 40 10 61 14
Austria 7 33 59 42 26 40 20 40 41
Netherlands 3 20 77 28 14 22 12 53 47
Belgium 5 39 56 24 29 38 25 44 60
Estonia 8 47 46 24 36 44 31 39 55
Lithuania 8 13 79 19 35 60 32 42 29
Poland 8 13 78 43 25 49 22 39 32
Czech R. 13 13 74 34 33 47 31 37 35
Hungary 5 17 78 27 27 52 23 49 36
Russian F. 13 17 71 30 42 68 36 35 37
Romania 4 15 81 29 14 44 11 25 30
Bulgaria 6 26 68 14 12 20 11 26 21
Georgia 3 33 65 18 10 13 8 45 14
In the fourth column is the estimated percentage of children born to cohabiting
parents whose parents marry by the child’s sixth birthday (Appendix Table A-40).
These estimates are based on the synthetic cohorts of children observed during the six
years prior to the survey, where parental separation is a competing risk. In no country
does marriage occur within six years for more than 50% of children. Marriage is most
common among cohabiting parents in Germany, Austria, and Poland, and quite unusual
in Lithuania, Bulgaria, and Georgia (where many cohabiting unions are de facto
marriages).
Columns 5–7 show the percentage of children whose parents separate by their 15
thbirthday. Column 5 is based on all children born in a union, whether a cohabitation or
marriage (Appendix Table A-33). Column 6 presents parallel estimates for children
born to cohabiting parents. The child remains in the cohabiting risk pool even if the
parents marry at some point during the 15 years of observation (Appendix Table A-34).
Column 7 presents estimates of parental separation for children born in marriage
(Appendix Table A-35).
The most stable parental couples are found in southern Europe, the Netherlands,
Romania, Bulgaria, and Georgia. Children are most likely to experience parental
separation in the United States (44%) and the Russian Federation (42%). In France,
Estonia, Lithuania, and the Czech Republic, the chances of parental separation are more
than one-third. In every country, the chances of parental separation are greater for
children born in cohabitation than for children in marriage. The differentials range from
about 50% higher to more than four times as high.
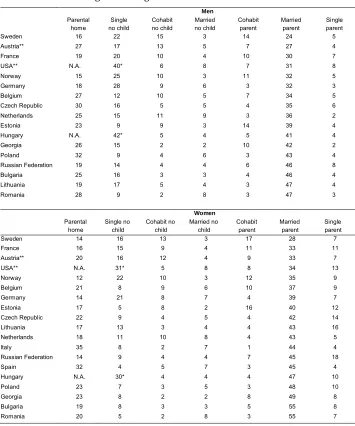
family states during the six-year periods we cover. These summaries are simple
statistics weighted for age; they are not based on any type of increment-decrement
life-table analysis. Table 7 presents the percentage distribution of years between 15 and 50
that adults spend in the parental home, as single without children (including years
before any union formation and after the end of any childless union), cohabiting
without children, married without children, cohabiting parent, married parent, and
single parent (including years before any union formation and years after separation
from a child’s other parent). Because Hungary and the United States did not collect
information on home-leaving, years that would otherwise be counted as in the parental
home are included in the time single without children. In this version of the table, we
have sorted the countries according to the fraction of adults in the ‘married parent’
state, with the lowest levels observed for Sweden and the highest for Romania.
In every country, men and women spend on average as much or more time as a
married parent than in any other family status. The range is from 24% to 47% for men
and 28% to 55% for women. In both cases, Swedish adults spend least time and
Romanian adults most time as married parents. Up to 14% of men’s years and 17% of
women’s years are spent in cohabiting parenthood (Sweden, Estonia), but in most
countries the proportions are under 10%.
The second largest block of time between 15 and 50 is spent in the parental home.
Swedish and Norwegian men spend the least amount of time in the parental home
(about 15%), Polish and Czech men about twice as much. Norwegian women also
spend the least time in the parental home (12%) while nest-leaving of Spanish and
Italian women occur very late; about one-third of their time between age 15 and 50 is
spent in the parental home. If we had data for Spanish and Italian men, the same would
probably be true for them.
Table 7:
Percentage of time ages 15–50
Men Parental home Single no child Cohabit no child Married no child Cohabit parent Married parent Single parentSweden 16 22 15 3 14 24 5
Austria** 27 17 13 5 7 27 4
France 19 20 10 4 10 30 7
USA** N.A. 40* 6 8 7 31 8
Norway 15 25 10 3 11 32 5
Germany 18 28 9 6 3 32 3
Belgium 27 12 10 5 7 34 5
Czech Republic 30 16 5 5 4 35 6
Netherlands 25 15 11 9 3 36 2
Estonia 23 9 9 3 14 39 4
Hungary N.A. 42* 5 4 5 41 4
Georgia 26 15 2 2 10 42 2
Poland 32 9 4 6 3 43 4
Russian Federation 19 14 4 4 6 46 8
Bulgaria 25 16 3 3 4 46 4
Lithuania 19 17 5 4 3 47 4
Romania 28 9 2 8 3 47 3
Women Parental home Single no child Cohabit no child Married no child Cohabit parent Married parent Single parent
Sweden 14 16 13 3 17 28 7
France 16 15 9 4 11 33 11
Austria** 20 16 12 4 9 33 7
USA** N.A. 31* 5 8 8 34 13
Norway 12 22 10 3 12 35 9
Belgium 21 8 9 6 10 37 9
Germany 14 21 8 7 4 39 7
Estonia 17 5 8 2 16 40 12
Czech Republic 22 9 4 5 4 42 14
Lithuania 17 13 3 4 4 43 16
Netherlands 18 11 10 8 4 43 5
Italy 35 8 2 7 1 44 4
Russian Federation 14 9 4 4 7 45 18
Spain 32 4 5 7 3 45 4
Hungary N.A. 30* 4 4 4 47 10
Poland 23 7 3 5 3 48 10
Georgia 23 8 2 2 8 49 8
Table 8 traces the amount of time that children spend in different family
arrangements. This version of Appendix Table A-45 is sorted by the fraction of
childhood time assigned to a family with two married parents. In every country, most
time is spent living with the child’s two parents, from a low of 66% in the United States
to a high of 94% in Italy. In countries where cohabitation is a common context for
parenthood (with Sweden and Estonia in the lead), a substantial proportion of the time
is spent with cohabiting rather than married parents. The remaining window is more
commonly filled by living with a lone mother than by living in a stepfamily. Around a
fifth of childhood time in the United States, Russia, Lithuania, and the Czech Republic
is with a lone mother, including lone mothers at birth and lone mothers after union
dissolution.
Table 8:
Percentage of time from birth to age 15
Lone mother Cohab parents Married parents Separated mother Mother and stepfather
Estonia 5 22 53 11 9
Sweden 1 30 54 10 5
USA 6 8 58 13 11
France 4 18 62 11 4
Norway 3 18 65 9 5
Russian Federation 7 7 66 14 6
Belgium 5 14 67 8 6
Austria 3 13 70 9 5
Czech Republic 7 5 73 11 4
Lithuania 5 5 74 13 3
Georgia 2 16 76 5 0
Hungary 2 6 79 9 3
Bulgaria 3 11 79 4 1
Poland 4 5 80 8 2
Germany 3 6 80 6 3
Netherlands 2 6 85 5 3
Romania 2 6 85 4 2
Spain 2 5 87 3 1
Italy 1 2 92 4 1
5.
Discussion
most other contexts. The role of nonmarital cohabitation is very strong in Sweden. The
United States once again stands out as a country with much more unstable families than
anywhere in Europe. As compared to the summary by Andersson and Philipov (2002),
many more countries in eastern Europe are represented in the Generations and Gender
Programme. For postcommunist countries covered in both studies, we note a possible
shift in patterns toward later family formation and more family instability. Russia is a
particularly interesting addition to this line of research: It is characterized by very early
family formation and high levels of family instability.
Nonresponse is an increasing problem with sample surveys. In some cases
respondent reports on family-life events may be inaccurate (Kreyenfeld and Bastin
2016). With this background we feel reassured by the fact that the vast amount of data
we have processed produces patterns that appear so stable and systematic when
compared to other sources of related information. During our work with this data we
have relied on comparisons with the previous study by Andersson and Philipov and
available statistics from many of the countries considered. In some cases, it is possible
to validate survey data by comparisons to similar information from population registers.
For Norway and Sweden, we were able to compare some life-table estimates from the
survey data to estimates from population registers. Because cohabitation is not a
registered event, comparisons were possible only for events related to childbearing,
marriage, and divorce. We found few discrepancies, except for divorce, where the
survey-based estimates were lower than those from registers (Dommermuth et al. 2015
and authors’ own calculations based on Swedish register data). This holds only for the
few years prior to the survey, on which we base our synthetic cohorts. An inspection of
linked register data for the Swedish survey respondents shows that this is due not to the
nonreporting of events but rather to the sample selection, i.e., those who recently
divorced are less likely to participate in the survey.
6. The database
Our database is presented in Appendix Tables A-1 to A-45, with contents as follows:
Tables A-1 to A-16: Single-sex tables of family formation of men and women
Experience of nest-leaving
A-1: Leaving the parental home
Experience of union formation
A-2: First union, as a cohabitation (censoring at marriage)
A-3: First union, as a marriage (censoring at cohabitation)
A-4: First union, as a cohabitation (competing-risks model)
A-5: First union, as a marriage (competing-risks model)
A-6: First union, as a marriage or a cohabitation (4+5)
A-7: First marriage
Experience of becoming a parent
A-8: First child
Experience of the combination of being a parent and being in different union
statuses
A-9: Parent and in a union
A-10: Parent and married
Experience of specific contexts of family-formation/childbearing events
A-12: Marriage during a first union
A-13: First child during a first union
A-14: First child during any union
A-15: First child during any marriage
A-16: First child when out of union
Tables A-17 to A-28: Pooled tables of union transformation and union disruption
Childless couples: Experience of childbearing or separation
A-17: First child of a childless couple
A-18: Separated before a birth, childless couple
Consensual unions: Experience of marriage formation or separation
A-19: Married before dissolution
A-20: Separated before marriage
A-21: Married (competing-risks model)
A-22: Separated (competing-risks model)
A-23: No longer in a consensual union (21+22)
Couples’ experience of union disruption
A-27: Separation for all marriages
A-28: Separation of parents in union (duration since union/parenthood)
Summary measure
A-29: Percentage of time spent in different family types (men, women)
Tables A-30 to A-45: Children’s experience of family dynamics
Family type at birth
A-30: Percentage of births by family type
Experience of family disruption
A-31: Ever out of union (all children)
A-32: Ever out of marriage (all children)
A-33: Out of union (children born in union)
A-34: Out of union (children born in consensual union)
A-35: Out of union (children born in marriage)
Experience of family formation
A-36: In union (children born to lone mother)
A-37: In marriage (children born to lone mother)
A-38: In marriage (children born to cohabiting mother)
A-39: In marriage (children born to non-married mother)
A-41: Out of union
A-42: No longer in consensual-union family (40+41)
Experience of family reformation
A-43: Again in union (after parental separation)
A-44: In marriage (after parental separation)
Summary measure
A-45: Percentage of time spent in different family types
7. Acknowledgements
This study uses data from the Generations and Gender Programme (GGP). The GGP is
a Social Science Research Infrastructure run by institutes with traditions in academic
and policy-related research on population and family change and on survey
methodology (www.ggp-i.org). The Harmonized Histories data file was created by the
Nonmarital Childbearing Network (
www.nonmarital.org
; see Perelli-Harris,
Kreyenfeld, and Kubisch 2010). It harmonizes childbearing and marital histories from
14 countries in the GGP with data from Spain (Spanish Fertility Survey), United
Kingdom (British Household Panel Study), and United States (National Survey for
Family Growth). We acknowledge everyone who helped collect, clean, and harmonize
the Harmonized Histories data, especially Karolin Kubisch at the Max Planck Institute
for Demographic Research (MPIDR). Support for production of Changing Life Course
Regimes (CLiCR) data files was provided by the Stockholm Centre on Health of
Societies in Transition (SCOHOST) at Södertörn University. The study also uses data
from the National Educational Panel Study: Starting Cohort 6 – Adults
(doi:10.5157/NEPS:SC6:1.0.0). The NEPS data collection is part of the Framework
Programme for the Promotion of Empirical Educational Research, funded by the
German Federal Ministry of Education and Research.
References
Andersson, G. (2002a). Children’s experience of family disruption and family
formation: Evidence from 16 FFS countries.
Demographic Research
7(7): 343–
364.
doi:10.4054/DemRes.2002.7.7
.
Andersson, G. (2002b). Dissolution of unions in Europe: A comparative overview.
Zeitschrift für Bevölkerungswissenschaft
27: 493–504.
Andersson, G. and Philipov, D. (2002). Life-table representations of family dynamics in
Sweden, Hungary, and 14 other FFS countries: A project of descriptions of
demographic behavior.
Demographic Research
7(4): 67–144.
doi:10.4054/DemRes.2002.7.4
.
Badurashvili, I., Cheishvili, R., Kapanadze, E., Tsiklauri, S., and Sirbiladze, M. (2008).
Gender relations in modern Georgian society. Tbilisi: United Nations Population
Fund and Georgian Centre of Population Research.
Blossfeld, H.-P., Roßbach, H.-G., and von Maurice, J. (2011).
Education as a lifelong
process: The German National Educational Panel Study (NEPS).
Wiesbaden:
Springer VS.
Brillinger, D. (1986). The natural variability of vital rates and associated statistics.
Biometrics
42(4): 693–734.
doi:10.2307/2530689
.
Chiang, C.L. (1984).
The life table and its applications
. Malabar: Krieger.
Dommermuth, L., Hart, R.K., Lappegård, T., Rønsen, M., and Wiik, K.A. (2015).
Kunnskapsstatus om fruktbarhet og samliv i Norge [Knowledge overview on
fertility and conjugal life in Norway]. Oslo: Statistics Norway (Statistics Norway
reports 2015/31).
Duntava, A. and Billingsley, S. (2013). Changing life course regimes (CLiCR) data:
Harmonization manual. Stockholm: Stockholm University, Demography unit
(Stockholm Research Reports in Demography 2013: 17).
Fokkema, T., Kveder, A., Heikel, N., Emery, T., and Liefbroer, A. (2016). Generations
and Gender Programme Wave 1 data collection: An overview and assessment of
sampling and fieldwork methods, weighting procedures, and cross-sectional
representativeness.
Demographic Research
34(18): 499–524.
doi:10.4054/Dem
Res.2016.34.18
.
Hoem, J.M. (2001). Life table. In: Smelser, N.J. and Baltes, P.B. (eds.).
International
encyclopedia for the social and behavioral sciences
. Oxford: Pergamon Press.
doi:10.1016/B0-08-043076-7/02101-X
.
Hoem, J.M. (2011). The life table. In: Lovric, M. (ed.).
International encyclopedia of
statistical science
. Heidelberg: Springer.
doi:10.1007/978-3-642-04898-2_335
.
Hoem, J.M. and Kostova, D. (2008). Early traces of the second demographic transition
in Bulgaria: A joint analysis of marital and nonmarital union formation.
Population Studies
62(3): 1–13.
doi:10.1080/00324720802313256
.
Jalovaara, M. and Andersson, G. (2017). Disparities in children’s family experiences by
mother’s socioeconomic status: The case of Finland. Stockholm: Stockholm
University, Demography unit (Stockholm Research Reports in Demography
2017: 22).
Kostova, D. (2008). Union formation in times of social and economic change: Evidence
from the Bulgarian and Russian GGS [Doctoral dissertation]. Rostock:
University of Rostock.
Kreyenfeld, M. and Bastin, S. (2016). Reliability of union histories in social science
surveys: Blurred memory, deliberate misreporting, or true tales?
Advances in
Life Course Research
27: 30–42.
doi.org/10.1016/j.alcr.2015.11.001
Kreyenfeld, M., Hornung, A., and Kubisch, K. (2013). The German Generations and
Gender Survey: Some critical reflections on the validity of fertility histories.
Comparative Population Studies
38(1): 3–28.
Perelli-Harris, B., Kreyenfeld, M., and Kubisch, K. (2010). Harmonised histories
manual for the preparation of comparative fertility and union histories. Rostock:
Max Planck Institute for Demographic Research (MPIDR working paper WP
2010–011).
Vergauwen, J., Wood, J., de Wachter, D., and Neels, K. (2015). Quality of demographic
data in GGS wave 1.
Demographic Research
32(24): 723–774.
doi:10.4054/
Appendix
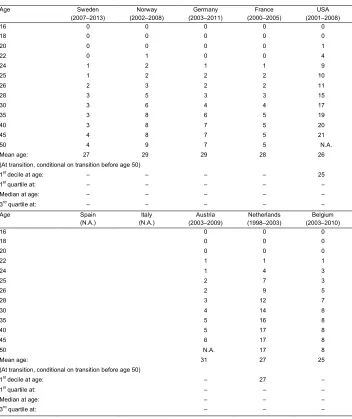
Table A-1a:
Cumulative percent ever leaving the parental home, men
Age Sweden Norway Germany France USA
(2007–2013) (2002–2008) (2000–2005) (2000–2005) (N.A.*)
16 3 3 4 2
18 10 22 15 12
20 44 59 42 43
22 77 83 73 66
24 92 91 88 83
25 95 94 92 89
26 – 95 95 92
28 – 97 – 96
30 – – – 98
35 – – – –
40 – – – –
45 – – – –
50 – – – –
Mean age: 20 20 20 21
(At transition, conditional on transition before age 50)
1st decile at age: 18 17 18 18
1st quartile at: 20 19 19 19
Median at age: 21 20 21 21
3rd quartile at: 22 22 23 23
Age Spain Italy Austria Netherlands Belgium
(N.A.*) (N.A.*) (2003–2009) (1998–2003) (2003–2010)
16 3 1 0
18 9 6 1
20 23 23 7
22 41 37 24
24 56 56 45
25 61 67 54
26 67 76 64
28 74 88 76
30 81 94 82
35 90 97 91
40 92 – 93
45 – – –
50 – – –
Mean age: 24 23 25
(At transition, conditional on transition before age 50)
1st decile at age: 19 19 21
1st quartile at: 21 21 23
Median at age: 24 24 25
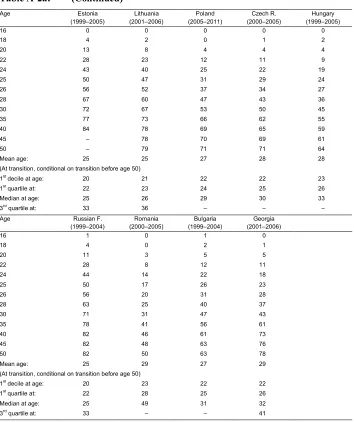
Table A-1a: (Continued)
Age Estonia Lithuania Poland Czech R. Hungary
(1999–2005) (2001–2006) (2005–2011) (2000–2005) (N.A.)
16 4 1 1 0
18 14 8 4 4
20 31 43 19 18
22 41 63 33 34
24 48 78 48 52
25 52 84 54 60
26 55 87 61 69
28 58 91 71 78
30 61 94 78 86
35 65 96 86 94
40 – 97 89 95
45 – 97 91 97
50 – – 93 98
Mean age: 21 22 25 25
(At transition, conditional on transition before age 50)
1st decile at age: 17 19 20 19
1st quartile at: 20 20 21 21
Median at age: 25 21 25 24
3rd quartile at: – 24 29 28
Age Russian F. Romania Bulgaria Georgia
(1999–2004) (2000–2005) (1999–2004) (2001–2006)
16 8 4 6 2
18 29 6 9 8
20 46 16 32 19
22 63 25 41 28
24 75 37 50 35
25 80 42 53 38
26 82 51 59 41
28 88 59 65 47
30 92 67 69 52
35 95 75 77 66
40 97 82 82 76
45 98 86 85 82
50 – 91 89 87
Mean age: 22 27 25 28
(At transition, conditional on transition before age 50)
1st decile at age: 17 19 19 19
1st quartile at: 18 22 20 22
Median at age: 21 26 24 29
Table A-1b:
Cumulative percent ever leaving the parental home, women
Age Sweden Norway Germany France USA
(2007–2013) (2002–2008) (2000–2005) (2000–2005) (N.A.)
16 4 5 5 2
18 15 27 25 14
20 54 73 59 53
22 85 92 83 77
24 96 – 93 91
25 – – 95 94
26 – – 97 96
28 – – – 98
30 – – – –
35 – – – –
40 – – – –
45 – – – –
50 – – – –
Mean age: 20 19 20 20
(At transition, conditional on transition before age 50)
1st decile at age: 17 17 17 18
1st quartile at: 19 18 18 19
Median at age: 20 20 20 20
3rd quartile at: 22 21 21 22
Age Spain Italy Austria Netherlands Belgium
(2001–2006) (1998–2003) (2003–2009) (1998–2003) (2003–2010)
16 1 1 2 1 0
18 4 3 14 8 6
20 14 11 39 36 19
22 24 18 59 66 39
24 35 28 75 84 62
25 42 35 79 90 73
26 51 42 83 95 81
28 67 55 89 98 –
30 80 65 93 – –
35 91 80 96 – –
40 93 84 – – –
45 94 89 – – –
50 94 90 – – –
Mean age: 25 27 22 21 22
(At transition, conditional on transition before age 50)
1st decile at age: 20 20 18 19 19
1st quartile at: 23 24 19 20 21
Median at age: 26 28 21 21 24
Table A-1b: (Continued)
Age Estonia Lithuania Poland Czech R. Hungary
(1999–2005) (2001–2006) (2005–2011) (2000–2005) (N.A.)
16 4 2 1 1
18 12 10 6 5
20 48 48 30 22
22 58 67 47 44
24 66 79 64 67
25 70 83 71 75
26 74 86 75 81
28 75 89 83 88
30 76 90 88 92
35 78 94 93 96
40 79 96 95 97
45 79 97 96 –
50 – – 97 –
Mean age: 21 22 23
1st decile at age: 18 18 19 19
1st quartile at: 19 19 20 21
Median at age: 21 21 23 23
3rd quartile at: 28 24 26 25
Age Russian F. Romania Bulgaria Georgia
(1999–2004) (2000–2005) (1999–2004) (2001–2006)
16 7 3 9 6
18 36 12 17 22
20 58 32 38 36
22 72 47 52 45
24 83 63 61 50
25 86 70 65 53
26 89 74 68 59
28 92 82 75 65
30 94 84 77 69
35 96 90 80 77
40 97 91 83 80
45 98 94 87 84
50 98 95 91 88
Mean age 20 23 24 25
(At transition, conditional on transition before age 50)
1st decile at age: 17 18 17 17
1st quartile at: 18 20 19 19
Median at age: 20 23 22 24
Table A-2a:
Cumulative percent ever starting a first union as a cohabitation,
single-decrement life-table method with censoring at direct
marriage, men
Age Sweden Norway Germany France USA
(2007–2013) (2002–2008) (2003–2011) (2000–2005) (2001–2008)
16 0 0 0 0 1
18 2 1 0 1 5
20 12 7 4 9 18
22 33 20 12 27 32
24 49 34 23 48 47
25 59 42 30 57 54
26 65 48 38 65 60
28 75 57 52 72 69
30 82 66 64 80 76
35 91 77 79 87 85
40 94 81 85 89 89
45 95 83 87 91 91
50 96 84 89 91 N.A.
Mean age: 25 26 28 25 25
(At transition, conditional on transition before age 50)
1st decile at age: 20 21 22 21 19
1st quartile at: 22 23 25 22 21
Median at age: 25 27 28 25 25
3rd quartile at: 28 24 34 29 30
Age Spain Italy Austria Netherlands Belgium
(N.A.) (N.A.) (2003–2009) (1998–2003) (2003–2010)
16 1 0 0
18 5 0 1
20 12 1 6
22 22 5 12
24 35 23 26
25 43 33 32
26 49 46 41
28 59 61 56
30 67 72 68
35 81 84 80
40 84 88 83
45 85 90 85
50 N.A. 90 87
Mean age: 26 27 27
(At transition, conditional on transition before age 50)
1st decile at age: 20 23 22
1st quartile at: 23 25 24
Median at age: 27 27 28
Table A-2a: (Continued)
Age Estonia Lithuania Poland Czech R. Hungary
(1999–2005) (2001–2006) (2005–2011) (2000–2005) (1999–2005)
16 0 0 0 0 0
18 4 2 0 1 2
20 13 8 4 4 4
22 28 23 12 11 9
24 43 40 25 22 19
25 50 47 31 29 24
26 56 52 37 34 27
28 67 60 47 43 36
30 72 67 53 50 45
35 77 73 66 62 55
40 84 78 69 65 59
45 – 78 70 69 61
50 – 79 71 71 64
Mean age: 25 25 27 28 28
(At transition, conditional on transition before age 50)
1st decile at age: 20 21 22 22 23
1st quartile at: 22 23 24 25 26
Median at age: 25 26 29 30 33
3rd quartile at: 33 36 – – –
Age Russian F. Romania Bulgaria Georgia
(1999–2004) (2000–2005) (1999–2004) (2001–2006)
16 1 0 1 0
18 4 0 2 1
20 11 3 5 5
22 28 8 12 11
24 44 14 22 18
25 50 17 26 23
26 56 20 31 28
28 63 25 40 37
30 71 31 47 43
35 78 41 56 61
40 82 46 61 73
45 82 48 63 76
50 82 50 63 78
Mean age: 25 29 27 29
(At transition, conditional on transition before age 50)
1st decile at age: 20 23 22 22
1st quartile at: 22 28 25 26
Median at age: 25 49 31 32
Table A-2b:
Cumulative percent ever starting a first union as a cohabitation,
single-decrement life-table method with censoring at direct
marriage, women
Age Sweden Norway Germany France USA
(2007–2013) (2002–2008) (2003–2011) (2000–2005) (2001–2008)
16 2 1 0 1 3
18 6 6 1 6 10
20 24 21 8 21 30
22 47 40 19 43 43
24 64 53 38 63 55
25 70 59 45 67 62
26 74 65 52 72 67
28 82 74 64 78 74
30 89 80 73 83 80
35 93 86 84 87 84
40 – 89 87 88 86
45 – 90 88 89 87
50 – 91 89 89 N.A.
Mean age: 23 24 26 23 23
(At transition, conditional on transition before age 50)
1st decile at age: 19 19 21 19 18
1st quartile at: 21 21 23 21 20
Median at age: 23 24 26 23 24
3rd quartile at: 27 29 31 27 29
Age Spain Italy Austria Netherlands Belgium
(2001–2006) (1998–2003) (2003–2009) (1998–2003) (2003–2010)
16 1 0 1 0 1
18 3 1 8 2 5
20 10 2 20 13 10
22 16 4 32 30 27
24 25 7 48 53 49
25 30 10 53 63 58
26 35 11 60 69 70
28 46 15 70 81 77
30 54 19 76 85 81
35 67 29 83 91 87
40 70 34 87 93 91
45 72 39 88 94 91
50 73 39 N.A. – 92
Mean age: 27 31 24 24 25
(At transition, conditional on transition before age 50)
1st decile at age: 20 25 19 20 20
1st quartile at: 24 33 21 22 22
Median at age: 29 – 25 24 25
Table A-2b: (Continued)
Age Estonia Lithuania Poland Czech R. Hungary
(1999–2005) (2001–2006) (2005–2011) (2000–2005) (1999–2005)
16 3 1 1 0 1
18 13 5 3 4 7
20 36 15 12 13 16
22 51 29 22 25 25
24 61 44 37 41 36
25 66 49 43 49 41
26 71 54 49 55 46
28 78 60 60 60 58
30 81 62 65 65 63
35 83 64 72 70 67
40 85 67 73 71 70
45 85 67 73 74 73
50 85 67 73 75 75
Mean age: 22 23 24 25 25
(At transition, conditional on transition before age 50)
1st decile at age: 18 20 20 20 19
1st quartile at: 19 22 23 22 22
Median at age: 22 26 27 26 27
3rd quartile at: 27 – – 49 50
Age Russian F. Romania Bulgaria Georgia
(1999–2004) (2000–2005) (1999–2004) (2001–2006)
16 4 2 4 3
18 13 7 9 9
20 29 12 18 19
22 47 19 30 28
24 58 31 41 36
25 65 36 46 38
26 68 41 50 43
28 73 44 58 48
30 76 51 64 53
35 81 60 67 60
40 85 62 69 63
45 85 64 71 64
50 86 66 71 66
Mean age: 23 26 24 25
(At transition, conditional on transition before age 50)
1st decile at age: 18 19 19 19
1st quartile at: 20 23 21 22
Median at age: 23 30 26 29
Table A-3a:
Cumulative percent ever starting a first union as a marriage,
single-decrement life-table method with censoring at entry into
cohabitation, men
Age Sweden Norway Germany France USA
(2007–2013) (2002–2008) (2003–2011) (2000–2005) (2001–2008)
16 0 0 0 0 0
18 0 0 0 0 0
20 0 0 0 0 1
22 0 1 0 0 5
24 2 2 1 2 13
25 2 3 2 3 17
26 4 5 3 4 19
28 6 8 4 7 28
30 7 11 7 13 35
35 11 16 13 16 50
40 14 19 18 16 53
45 17 20 20 16 60
50 17 24 20 19 N.A.
Mean age: 33 33 32 31 30
(At transition, conditional on transition before age 50)
1st decile at age: 35 29 33 30 24
1st quartile at: – – – – 28
Median at age: – – – 35
3rd quartile at: – – – – –
Age Spain Italy Austria Netherlands Belgium
(N.A.) ( N.A.) (2003–2009) (1998–2003) (2003–2010)
16 0 0 0
18 0 0 0
20 0 0 0
22 1 2 1
24 1 4 3
25 2 8 4
26 3 12 6
28 4 20 12
30 7 25 14
35 11 33 14
40 14 38 14
45 21 38 14
50 N.A. 44 14
Mean age: 35 32 26
(At transition, conditional on transition before age 50)
1st decile at age: 33 26 28
1st quartile at: – 30 –
Median at age: – – –
Table A-3a: (Continued)
Age Estonia Lithuania Poland Czech R. Hungary
(1999–2005) (2001–2006) (2005–2011) (2000–2005) (1999–2005)
16 0 0 0 0 0
18 0 0 0 0 0
20 0 1 1 0 0
22 1 8 4 2 3
24 3 18 11 5 5
25 4 25 16 8 7
26 4 29 24 10 10
28 5 37 33 15 19
30 7 48 43 21 27
35 13 55 56 29 36
40 13 55 61 33 39
45 – 57 63 33 39
50 – 57 64 33 39
Mean age: 29 27 29 29 29
(At transition, conditional on transition before age 50)
1st decile at age: 33 23 24 26 26
1st quartile at: – 25 27 33 30
Median at age: – 31 32 – –
3rd quartile at: – – – – –
Age Russian F. Romania Bulgaria Georgia
(1999–2004) (2000–2005) (1999–2004) (2001–2006)
16 0 0 0 0
18 0 0 0 0
20 2 1 1 1
22 9 5 3 4
24 18 16 5 7
25 25 22 8 11
26 30 28 10 13
28 39 39 14 19
30 43 48 18 22
35 47 61 22 30
40 49 68 22 37
45 49 72 26 38
50 49 73 28 38
Mean age: 25 29 31 29
(At transition, conditional on transition before age 50)
1st decile at age: 23 23 26 25
1st quartile at: 25 26 43 32
Median at age: – 31 – –
Table A-3b:
Cumulative percent ever starting a first union as a marriage,
single-decrement life-table method with censoring at entry into
cohabitation, women
Age Sweden Norway Germany France USA
(2007–2013) (2002–2008) (2003–2011) (2000–2005) (2001–2008)
16 0 0 0 0 0
18 0 0 0 0 1
20 0 1 1 1 4
22 1 3 2 2 11
24 2 5 5 6 22
25 3 8 6 8 30
26 4 9 8 8 35
28 5 11 9 12 41
30 5 14 12 13 49
35 10 17 19 16 54
40 10 19 21 16 63
45 16 21 22 16 65
50 16 28 24 16 N.A.
Mean age: 34 34 30 26 27
(At transition, conditional on transition before age 50)
1st decile at age: 34 27 29 27 22
1st quartile at: – 50 – – 25
Median at age: – – – – 31
3rd quartile at: – – – – –
Age Spain Italy Austria Netherlands Belgium
(2001–2006) (1998–2003) (2003–2009) (1998–2003) (2003–2010)
16 0 0 0 0 0
18 0 0 0 1 0
20 2 2 1 2 1
22 5 5 3 7 4
24 10 10 6 17 9
25 13 15 7 21 14
26 19 20 9 27 19
28 34 33 10 31 30
30 49 44 14 37 35
35 65 62 21 45 41
40 69 68 23 55 45
45 70 70 25 60 45
50 70 71 N.A. – 45
Mean age: 28 29 29 30 27
(At transition, conditional on transition before age 50)
1st decile at age: 24 24 28 23 25
1st quartile at: 27 27 41 26 28
Median at age: 31 31 – 37 –
Table A-3b: (Continued)
Age Estonia Lithuania Poland Czech R. Hungary
(1999–2005) (2001–2006) (2005–2011) (2000–2005) (1999–2005)
16 0 0 0 0 0
18 0 1 0 0 0
20 3 5 4 3 2
22 4 14 11 8 6
24 7 26 25 14 14
25 9 31 33 20 20
26 11 36 38 22 24
28 13 44 50 28 33
30 15 47 57 32 39
35 18 53 66 38 43
40 18 56 69 38 50
45 18 57 70 41 50
50 18 57 70 41 50
Mean age: 25 26 26 27 27
(At transition, conditional on transition before age 50)
1st decile at age: 26 22 22 23 24
1st quartile at: – 24 24 27 27
Median at age: – 31 28 – 39
3rd quartile at: – – – – –
Age Russian F. Romania Bulgaria Georgia
(1999–2004) (2000–2005) (1999–2004) (2001–2006)
16 0 1 0 0
18 2 2 1 3
20 12 11 3 8
22 28 20 6 13
24 40 36 11 17
25 45 46 13 20
26 47 49 15 22
28 51 60 20 26
30 52 64 22 30
35 56 71 26 33
40 57 72 28 36
45 57 72 28 38
50 58 72 28 38
Mean age: 24 24 26 26
(At transition, conditional on transition before age 50)
1st decile at age: 20 20 24 21
1st quartile at: 22 23 33 28
Median at age: 28 27 – –
Table A-4a:
Cumulative percent ever starting a first union as a cohabitation,
competing-risks life-table method with direct marriage as a
competing event, men
Age Sweden Norway Germany France USA
(2007–2013) (2002–2008) (2003–2011) (2000–2005) (2001–2008)
16 0 0 0 0 1
18 2 1 0 1 5
20 12 7 4 9 18
22 33 20 12 27 32
24 49 34 23 48 46
25 59 41 30 57 51
26 65 48 37 64 56
28 74 56 51 71 63
30 80 63 62 78 68
35 89 73 76 85 73
40 91 77 81 86 75
45 92 78 83 87 76
50 93 79 84 88 N.A.
Mean age: 25 26 28 25 24
(At transition, conditional on transition before age 50)
1st decile at age: 20 21 22 21 19
1st quartile at: 22 23 25 22 21
Median at age: 25 27 28 25 25
3rd quartile at: 29 37 35 29 40
Age Spain Italy Austria Netherlands Belgium
(N.A.) (N.A.) (2003–2009) (1998–2003) (2003–2010)
16 1 0 0
18 5 0 1
20 12 1 6
22 22 5 12
24 35 22 25
25 43 32 32
26 48 43 40
28 58 56 54
30 66 65 64
35 78 73 74
40 81 76 77
45 81 77 79
50 N.A. 77 80
Mean age: 25 27 27
(At transition, conditional on transition before age 50)
1st decile at age: 20 23 22
1st quartile at: 23 25 24
Median at age: 27 27 28
Table A-4a: (Continued)
Age Estonia Lithuania Poland Czech R. Hungary
(1999–2005) (2001–2006) (2005–2011) (2000–2005) (1999–2005)
16 0 0 0 0 0
18 4 2 0 1 2
20 13 8 4 4 4
22 27 22 12 11 9
24 43 37 24 21 18
25 49 43 29 28 23
26 55 46 34 33 26
28 65 51 41 41 34
30 70 56 45 47 41
35 75 59 51 56 47
40 80 61 52 58 50
45 – 61 53 60 51
50 – 61 53 61 53
Mean age: 25 24 26 27 27
(At transition, conditional on transition before age 50)
1st decile at age: 20 21 22 22 23
1st quartile at: 22 23 25 25 26
Median at age: 26 28 34 32 38
3rd quartile at: 35 – – – –
Age Russian F. Romania Bulgaria Georgia
(1999–2004) (2000–2005) (1999–2004) (2001–2006)
16 1 0 1 0
18 4 0 2 1
20 11 3 5 5
22 27 8 12 11
24 41 13 21 18
25 46 16 25 22
26 50 18 30 26
28 55 21 38 34
30 60 25 44 39
35 63 29 51 52
40 65 31 55 60
45 66 31 56 62
50 66 32 56 63
Mean age: 24 26 26 28
(At transition, conditional on transition before age 50)
1st decile at age: 20 23 22 22
1st quartile at: 22 30 25 26
Median at age: 26 – 34 34
Table A-4b:
Cumulative percent ever starting a first union as a cohabitation,
competing-risks life-table method with direct marriage as a
competing event, women
Age Sweden Norway Germany France USA
(2007–2013) (2002–2008) (2003–2011) (2000–2005) (2001–2008)
16 2 1 0 1 3
18 6 6 1 6 10
20 24 21 8 21 30
22 47 39 19 43 42
24 64 52 37 62 52
25 69 58 44 66 57
26 74 64 50 70 60
28 81 71 61 75 65
30 87 77 69 80 68
35 91 82 78 84 70
40 – 84 81 84 71
45 – 85 82 85 71
50 – 86 83 85 N.A.
Mean age: 23 24 26 23 22
(At transition, conditional on transition before age 50)
1st decile at age: 19 19 21 19 18
1st quartile at: 21 21 23 21 20
Median at age: 23 24 26 23 24
3rd quartile at: 27 30 33 28 –
Age Spain Italy Austria Netherlands Belgium
(2001–2006) (1998–2003) (2003–2009) (1998–2003) (2003–2010)
16 1 0 1 0 1
18 3 1 8 2 5
20 10 2 20 12 10
22 16 4 32 29 26
24 24 7 47 50 48
25 28 9 52 58 55
26 33 11 58 62 65
28 41 13 68 70 71
30 46 15 73 74 73
35 51 20 78 77 77
40 52 22 81 78 79
45 53 23 82 78 80
50 53 23 N.A. – 80
Mean age: 25 28 24 23 24
(At transition, conditional on transition before age 50)
1st decile at age: 20 26 19 20 20
1st quartile at: 25 – 21 22 22
Median at age: 33 – 25 24 25
Table A-4b: (Continued)
Age Estonia Lithuania Poland Czech R. Hungary
(1999–2005) (2001–2006) (2005–2011) (2000–2005) (1999–2005)
16 3 1 1 0 1
18 13 5 3 4 7
20 35 14 12 13 16
22 51 27 21 24 25
24 60 40 34 38 35
25 64 43 38 45 38
26 69 46 42 50 43
28 75 50 48 54 51
30 77 51 50 57 54
35 79 52 53 60 57
40 81 54 53 61 58
45 81 54 53 62 60
50 81 54 53 63 61
Mean age: 22 23 23 24 24
(At transition, conditional on transition before age 50)
1st decile at age: 18 20 20 20 19
1st quartile at: 19 22 23 23 22
Median at age: 22 28 30 26 28
3rd quartile at: 28 – – – –
Age Russian F. Romania Bulgaria Georgia
(1999–2004) (2000–2005) (1999–2004) (2001–2006)
16 4 2 4 3
18 13 7 9 9
20 28 12 18 18
22 43 18 29 27
24 50 27 39 33
25 54 29 43 35
26 56 32 47 39
28 58 33 54 43
30 59 36 58 46
35 62 39 60 51
40 63 40 62 53
45 64 40 64 54
50 64 41 64 55
Mean age: 22 23 23 24
(At transition, conditional on transition before age 50)
1st decile at age: 18 19 19 19
1st quartile at: 20 24 21 22
Median at age: 24 – 27 34
Table A-5a:
Cumulative percent ever starting a first union as a marriage,
competing-risks life-table method with entry into cohabitation as
a competing event, men
Age Sweden Norway Germany France USA
(2007–2013) (2002–2008) (2003–2011) (2000–2005) (2001–2008)
16 0 0 0 0 0
18 0 0 0 0 0
20 0 0 0 0 1
22 0 1 0 0 4
24 1 2 1 1 9
25 1 2 2 2 10
26 2 3 2 2 11
28 3 5 3 3 15
30 3 6 4 4 17
35 3 8 6 5 19
40 3 8 7 5 20
45 4 8 7 5 21
50 4 9 7 5 N.A.
Mean age: 27 29 29 28 26
(At transition, conditional on transition before age 50)
1st decile at age: – – – – 25
1st quartile at: – – – – –
Median at age: – – – – –
3rd quartile at: – – – – –
Age Spain Italy Austria Netherlands Belgium
(N.A.) (N.A.) (2003–2009) (1998–2003) (2003–2010)
16 0 0 0
18 0 0 0
20 0 0 0
22 1 1 1
24 1 4 3
25 2 7 3
26 2 9 5
28 3 12 7
30 4 14 8
35 5 16 8
40 5 17 8
45 6 17 8
50 N.A. 17 8
Mean age: 31 27 25
(At transition, conditional on transition before age 50)
1st decile at age: – 27 –
1st quartile at: – – –
Median at age: – – –
Table A-5a: (Continued)
Age Estonia Lithuania Poland Czech R. Hungary
(1999–2005) (2001–2006) (2005–2011) (2000–2005) (1999–2005)
16 0 0 0 0 0
18 0 0 0 0 0
20 0 1 1 0 0
22 1 7 4 2 2
24 2 14 10 4 4
25 3 18 13 6 6
26 3 20 18 8 8
28 3 23 23 11 14
30 4 27 28 14 19
35 5 29 34 18 24
40 5 29 36 19 25
45 – 30 36 19 25
50 – 30 36 19 25
Mean age: 26 25 27 28 28
(At transition, conditional on transition before age 50)
1st decile at age: – 23 24 27 27
1st quartile at: – 29 29 – 40
Median at age: – – – – –
3rd quartile at: – – – – –
Age Russian F. Romania Bulgaria Georgia
(1999–2004) (2000–2005) (1999–2004) (2001–2006)
16 0 0 0 0
18 0 0 0 0
20 2 1 1 1
22 7 5 3 4
24 13 14 4 7
25 17 20 6 9
26 19 24 8 11
28 23 33 11 15
30 24 40 13 17
35 25 48 15 21
40 25 52 15 23
45 25 54 16 23
50 25 54 17 23
Mean age: 24 28 28 27
(At transition, conditional on transition before age 50)
1st decile at age: 23 24 28 26
1st quartile at: 32 27 – –
Median at age: – 37 – –
Table A-5b:
Cumulative percent ever starting a first union as a marriage,
competing-risks life-table method with entry into cohabitation as
a competing event, women
Age Sweden Norway Germany France USA
(2007–2013) (2002–2008) (2003–2011) (2000–2005) (2001–2008)
16 0 0 0 0 0
18 0 0 0 0 1
20 0 1 1 1 3
22 0 2 2 2 8
24 1 3 4 3 13
25 1 5 5 4 17
26 2 5 6 4 19
28 2 6 6 5 20
30 2 6 7 5 22
35 – 7 9 6 23
40 – 7 9 6 24
45 – 7 9 6 25
50 – 8 9 6 N.A.
Mean age: 28 27 26 24 24
(At transition, conditional on transition before age 50)
1st decile at age: – – – – 23
1st quartile at: – – – – 41
Median at age: – – – – –
3rd quartile at: – – – – –
Age Spain Italy Austria Netherlands Belgium
(2001–2006) (1998–2003) (2003–2009) (1998–2003) (2003–2010)
16 0 0 0 0 0
18 0 0 0 1 0
20 2 2 1 2 1
22 4 5 3 6 3
24 8 10 4 11 6
25 11 14 5 13 8
26 15 19 6 15 10
28 24 30 6 16 13
30 31 39 7 17 14
35 37 53 8 18 15
40 39 57 9 19 16
45 39 58 9 19 16
50 39 59 N.A. – 16
Mean age: 27 28 26 24 25
(At transition, conditional on transition before age 50)
1st decile at age: 25 24 – 23 26
1st quartile at: 29 27 – – –
Median at age: – 33 – – –