* Corresponding author.
E-mail: [email protected] (A. K.Sahoo) © 2014 Growing Science Ltd. All rights reserved. doi: 10.5267/j.ijiec.2014.4.002
International Journal of Industrial Engineering Computations 5 (2014) 407–416
Contents lists available at GrowingScience
International Journal of Industrial Engineering Computations
homepage: www.GrowingScience.com/ijiec
A response surface methodology and desirability approach for predictive modeling and optimization of cutting temperature in machining hardened steel
Ashok Kumar Sahoo* and Purna Chandra Mishra
School of Mechanical Engineering, KIIT University, Bhubaneswar-24, Odisha, India
C H R O N I C L E A B S T R A C T
Article history:
Received September 2 2013 Received in Revised Format Mach 27 2014
Accepted March 29 2014 Available online April 4 2014
This paper presents an experimental investigation on cutting temperature during hard turning of EN 24 steel (50 HRC) using TiN coated carbide insert under dry environment. The prediction model is developed using response surface methodology and optimization of process parameter is performed by desirability approach. A stiff rise in cutting temperature is noticed when feed and cutting speed are elevated. The effect of depth of cut on cutting temperature is not that much significant compared with cutting speed and feed as observed from main effects plot. The response surface second order model presented high correlation coefficient (R2 = 0.992) explaining 99.2 % of the variability in the cutting temperature which indicates the goodness of fit for the model to the actual data and high statistical significance of the model. The experimental and predicted values are very close to each other. The calculated error for cutting temperature lies between 1.88-3.19 % during confirmation trial. Therefore, the developed second order model correlates the relationship of the cutting temperature with the process parameters with good degree of approximation. The optimal combination for process parameter is depth of cut at 0.2mm, feed of 0.1597 mm/rev and cutting speed of 70m/min. Based on these combination, the value of cutting temperature is 302.950C whose desirability is one.
© 2014 Growing Science Ltd. All rights reserved
Keywords: Cutting temperature Hard turning Coated carbide
Response surface methodology Desirability approach
1. Introduction
During metal machining, heat is generated at three regions such as primary shear zone, secondary deformation zone at the chip-tool interface and at the worn out flanks. The possible detrimental effects of high cutting temperature on cutting tool are rapid tool wear, which reduces the tool life. This causes the plastic deformation of the cutting edges of the tool material, thermal flaking and fracturing of the cutting edges due to thermal shocks and accelerates the built-up-edge formation. This also causes dimensional inaccuracy, surface damage by oxidation, rapid corrosion etc. induction of tensile residual stresses and microcracks at the surface. Hence, reduction of cutting temperature is utmost important task in metal machining.
408
more energy per metal removal than cutting. Therefore, cutting is more energy efficient than grinding. The advantages of hard turning than grinding are reduction of manufacturing cycles, manufacturing costs, decrease of set up time, reduction of number of necessary machine tools, achievement of comparable surface finish, elimination of part distortion caused by heat treatment, elimination of environmentally harmful coolant, low capital investment cost, low energy consumption. Due to this, hard turning has been considered as preferred application than grinding in majority of applications. However, the limitations of hard turning are the uncertaintiesrelated to the surface integrity and part accuracy, tool wear pattern and tool life predictions and economic feasibility. Therefore, research in field of hard turning will be worthy enough to take the advantages. This may produce economical machining and alternative to costly grinding process.
2. Review of literature and objectives
In order to achieve the objectives of this research, a literature review was conducted. Huang et al. (2007) suggested that abrasion, adhesion and diffusion primarily govern the CBN tool wear in hard turning. Models have been proposed to predict the flank and crater-wear propagation and evaluate the relative importance of each wear mechanism. Performance of CBN tools while machining 100Cr6 was studied in detail by Yallese et al. (2009). The authors recommend a cutting speed range of 90-220m/min in which the tool-work combination yields a good result in terms of wear, roughness and temperature at chip-tool interface. The authors also have detected significance of radial force and feed rate in this paper.
Tamizharasan et al. (2006) proposed that as an alternative to grinding, the hard turning produced better surface finish, lower flank wear rate and high material removal on the selected crank pin material by low content CBN tool. Thamizhmanii and Hasan (2008) concluded that the surface roughness was low by CBN at high cutting speed but the flank wear was high during machining stainless steel (45-55 HRC). The surface roughness was high for PCBN tool than CBN tool and flank wear recorded was low for PCBN tool than CBN tool. The CBN tool was unable to withstand heat at cutting zone and hence more flank wear occurred than PCBN tool. More crater wear formed on PCBN tools whereas CBN tool produced less crater wear. The formation of crater wear on the rake face was due to rough surface of saw tooth chips.
Thamizhmanii et al. (2008) analyzed the surface roughness produced by turning process on hard martensitic stainless steel (45-55 HRC) by CBN cutting tool. Low surface roughness was produced at cutting speed of 225 m/min with feed rate of 0.125 mm/rev and 0.50 mm depth of cut. It was always advisable to turn the hard martensitic stainless steel at medium level cutting speed (175 m/min), high feed rate and high depth of cut. At this parameter, the intensity of heat was not so high to affect the flank wear. XuePing Zhang et al. (2006) investigated the surface integrity of hardened bearing steel (62-63 HRC) using CBN insert. Super-finish hard turning process could generate a superior surface integrity in terms of surface finish, residual stresses, and thermal damage layer when the hard turning parameter combination was appropriately selected. Feed rate was the most important impact on the surface finish. Tugrul Ozel et al. (2005) found that, workpiece hardness, cutting edge geometry, feed rate and cutting speed were statistically significant on surface roughness in turning hardened AISI H13 hot work tool steel (55HRC) using CBN inserts. Especially honed edge geometry and lower workpiece surface hardness resulted better surface roughness, lower tangential and radial forces. Ozel and Karpat (2005) observed that low CBN content insert with honed edge geometry performed better in terms of surface roughness and tool wear in finish hard turning of AISI H13 steel. Mahfoudi et al. (2008) found that high speed machining (300 and 400 m/min) of a 50 HRC hardened steel (AISI 4140/ 42CrMo4) with a PCBN tool could be acceptable for industrial application providing very good surface roughness with significant tool life.
many industrial applications was observed. Coelho et al. (2007) observed that TiAlN-nanocoated PCBN tool performed better in terms of tool wear and surface roughness than TiAlN and AlCrN in machining AISI 4340 steel. This was because of hot hardness and the availability of an oxidizing layer. The tool wear was found to be low for TiAlN-nanocoating followed by TiAlN, AlCrN and uncoated PCBN. Forces behaved the same trend. Ra values were between 0.7 and 1.2 µm with no large differences amongst the tools.
Park (2002) observed that PCBN insert performed better in cutting force and surface roughness than ceramic tool in turning hardened SKD 11 steel (58-60 HRC). The radial force was the largest force component regardless the type of tool used. The PCBN tools transferred the generated heat more effectively than the ceramic tools due to their higher thermal conductivity. Sahin and Motorcu (2008) found that the surface roughness produced by CBN cutting tools were lower than those of mixed ceramic insert during turning AISI 1050 steel (484HV). Higher significance on the surface finish value was feed rate for all cutting tool materials.
Sahin (2009) indicated that the CBN cutting tool showed the best performance than that of ceramic based cutting tool during turning AISI 52100 steel (659HV). Cutting speed exerted the greatest effect on the tool wear, followed by the hardness of cutting tool, lastly the feed rate. Jacobson (2002) examined the surface integrity of M50 steels (61 HRC) using ceramic and CBN insert. It was found that both effective rake angle and tool nose radius affected the residual stress generated. Higher negative rake angle and smaller nose radius create a more compressive residual stress profile. Depth of cut did not affect the amount of residual stress generated in hard turning. The hot pressed ceramic produced a better surface than the whisker ceramic.
Yallese et al. (2005) investigated the effect of process parameters on ceramic and CBN tool wear in the hard turning of X200Cr12 steel (60 HRC). Cutting speed up to 180 m/min was found to be limiting factor for both cutting tool materials. Under limiting wear criteria, surface roughness was higher for ceramic tool than CBN tool. The optimal cutting speed was found to be 120 m/min using CBN tool and 60 m/min for ceramic insert.
Tugrul Ozel et al. (2007) found that neural network model was suitable to predict tool wear and surface roughness patterns for a range of cutting conditions in finish hard turning of AISI D2 steels (60 HRC) using ceramic wiper (multi-radii) design inserts. Lalwani et al. (2008) studied the effect of cutting parameters on cutting forces and surface roughness in finish hard turning using coated ceramic tool applying RSM and sequential approach using face centered CCD. A linear model fitted well to the variation of cutting forces and a non-linear quadratic model found suitable for the variation of surface roughness with significant contribution of feed rate. Depth of cut was significant to the feed force. For the thrust force and cutting force, feed rate and depth of cut contributed more.
Horng et al. (2008) developed RSM model using CCD in the hard turning using uncoated Al2O3/TiC
mixed ceramics tool for flank wear and surface roughness. Flank wear was influenced principally by the cutting speed and the interaction effect of feed rate with nose radius of tool. The cutting speed and the tool corner radius affected surface roughness significantly. Singh and Rao (2007) developed mathematical model for surface roughness using RSM. Feed was the dominant factor determining the surface finish followed by nose radius and cutting velocity in finish hard turning of the bearing steel AISI 52100 using mixed ceramic inserts. Though, the effect of the effective rake angle on the surface finish was less, the interaction effects of nose radius and effective rake angle were considerably significant.
410
conditions on the surface finish during hard turning of bearing steel with mixed ceramic insert by developing first and second-order mathematical models by RSM. The model was found to correlate very well with the experimental results. Sahoo and Sahoo (2012) studied some machinability studies on flank wear, surface roughness, chip morphology and cutting forces in finish hard turning of AISI 4340 steel using uncoated and multilayer TiN and ZrCN coated carbide inserts at higher cutting speed range. Sahoo and Sahoo (2011) developed the mathematical model and parametric optimization for surface roughness in turning D2 steel using TiN coated carbide insert using Taguchi and RSM. RSM model can be effectively utilized to predict the surface roughness in turning D2 steel. Sahoo et al. (2013) developed flank wear model in turning hardened EN 24 steel with PVD TiN coated mixed ceramic insert under dry environment. Machining time has been found to be the most significant parameter on flank wear followed by cutting speed and feed as observed from main effect plot and ANOVA study.
Grinding is observed to be slow and costly process. The machining performance of PCBN and ceramic tool materials has been extensively studied. However their cost is very high. Multilayer coated carbide insert is the proposed alternative due to its economic feasibility. However their application to turn hardened steel is very limited. It seems essential to investigate the performance of these inserts so as to investigate usability of such tools in order to attain higher productivity. Therefore the objective of the present work is to have a systematic study on cutting temperature in hard turning as it is the most important indices of machinability study. The mathematical model has been developed to predict the cutting temperature using response surface methodology. The parametric optimization is highly essential for successful implementation of such tools in hard turning which has been presented in this paper using desirability approach.
3. Experimental details
For the experimental investigations, test samples EN24 (medium carbon low alloy high strength) steel in the form of round bar was used. Such steel is a difficult-to-machine material because of its high hardness, low specific heat and tendency to get strain hardened. The dimension of workpiece is of diameter 45 mm and 100mm length and heat treated to 50 HRC. Axles and axle components, arbors, extrusion liners, magneto drive coupling, shaft and wheels, pinions and pinion shafts are the application range of EN24 alloy steel. The machine tool used was a high rigid conventional lathe (Model: HMT, NH22) which has spindle speed of 2040 rpm (maximum) and power of 11 KW. Commercially available coated carbide inserts (TiN/TiCN/Al2O3/TiN) of ISO designation CNMG 120408 (80
0
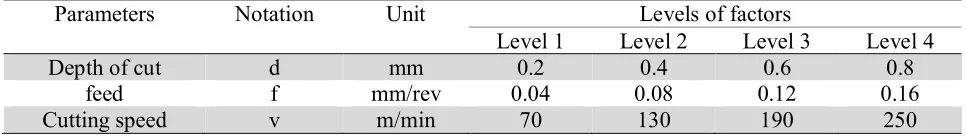
diamond shaped insert) have been used in the experiment. Inserts are mounted on PCLNR2525 M12 tool holder. The outer rust layers of heat treated workpieces were removed by machining to obtain the desired diameter. The cutting parameters and their levels are shown in Table 1.
The experiment has been designed as per Taguchi L16 orthogonal array. All 16 experimental runs have
been conducted with new cutting edge each under dry cutting environment. Each experiment is repeated twice and average value was reported. The response i.e. cutting temperature (T) is measured by Fluke Ti32 IR camera respectively. The machining length was fixed as 60 mm for each run.
Table 1
Process parameters and their levels
Parameters Notation Unit Levels of factors
Level 1 Level 2 Level 3 Level 4
Depth of cut d mm 0.2 0.4 0.6 0.8
feed f mm/rev 0.04 0.08 0.12 0.16
4. Results and discussions
The cutting temperature values at different experimental conditions have been presented in Table 2. The results pertaining to effects of process parameters on cutting temperature (T in 0C), prediction model development by response surface methodology and parametric optimization using desirability approach are discussed.
Table 2
Experimental results
Run No Process parameters Cutting Temperature
d f v T (0C)
1 0.2 0.04 70 325
2 0.2 0.08 130 390
3 0.2 0.12 190 461
4 0.2 0.16 250 541
5 0.4 0.04 130 390
6 0.4 0.08 70 381
7 0.4 0.12 250 478
8 0.4 0.16 190 396
9 0.6 0.04 190 402
10 0.6 0.08 250 428
11 0.6 0.12 70 442
12 0.6 0.16 130 395
13 0.8 0.04 250 391
14 0.8 0.08 190 443
15 0.8 0.12 130 462
16 0.8 0.16 70 481
4.1 Effects of process parameters on cutting temperature
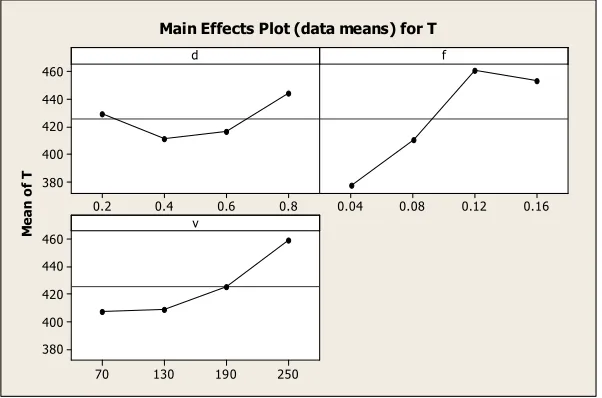
From the experimental results, the variations of cutting temperature value at different cutting conditions have been displayed in Fig.1 as main effects plot. The cutting temperature value increases with increasing cutting speed, feed and depth of cut. A stiff rise in cutting temperature is noticed when feed and cutting speed are elevated. The effect of depth of cut on cutting temperature is not that much significant compared to cutting speed and feed as observed from main effect plot.
M
e
a
n
o
f
T
0.8 0.6 0.4 0.2 460
440
420
400
380
0.16 0.12 0.08 0.04
250 190 130 70 460
440
420
400
380
d f
v
412
4.2 Prediction model using response surface methodology
RSM (Response surface methodology) is a combination of mathematical and statistical techniques which is useful for the modeling and analysis of the problem. RSM determines the suitable approximation for the true functional relationship between the response and the set of independent variables (Montgomery, 1997). RSM is commonly approximated by polynomial functions where models are obtained by conducting small number of experiments using design of experiment. The response function representing the cutting temperature and independent input variables can be expressed as
T = f (d, f, v) (1)
where T is the desired response and f is the response function. RSM is a model building technique
based on statistical design of experiments and least square error fitting. The second order polynomial
regression equation (quadratic model) has been used to represent the response surface for factors.
T = ko + k1 d + k2 f + k3 v + k4 d2 + k5 f2 + k6 v2 + k7 df + k8 fv + k9 dv, (2)
where ko is the free term of the regression equation, the coefficients k1, k2 and k3 are linear terms, k4, k5
and k6 are the quadratic terms and k7, k8 and k9 are the interaction terms respectively. The value of the
coefficients is calculated by the regression method. When the data are analyzed for cutting temperature, the following response function second order equations are obtained in uncoded units as.
T = 185.93 +334.51 d + 1053.98 f +0.88 v + 284.38 d2 – 6406.25 f2 + 0.00 v2 – 590.91
df – 3.19 dv + 2.24 fv
R2 = 99.2 %, R2 (adj) = 98 %
(3)
The response surface second order model presented high correlation coefficient (R2 = 0.992) explaining 99.2 % of the variability in the cutting temperature. Higher R2 (coefficient of correlation) indicates the goodness of fit for the model to the actual data and high statistical significance of the model. R2 adjusted statistical analysis has been included in the model because greater R2 value may not indicate the accuracy of model. The R2 and adjusted R2 values are very close and does not differ so much. The R2 adjusted values for cutting temperature is 98 % which indicates 98 % of variability is explained by the model after considering the significant factors. It concludes that unnecessary terms are not included in the model. It indicates good correlations between the experimental and predicted values of cutting temperature. To justify the fitness of mathematical model, ANOVA (analysis of variance) and F-ratio have been studied for a confidence level of 95 %. Table 3 represents the ANOVA of second order model. It is found to be significant as its p-value is less than 0.05 and calculated F-ratio is more than standard tabulated value.
Table 3
ANOVA for cutting temperature model
Source DF Seq SS Adj SS Adj MS F P Remarks
Regression 9 40181.5 40181.5 4464.61 84.71 0.000 Significant
Linear 3 22064 2459.4 819.81 15.55 0.003
Square 3 4775.3 4775.3 1591.75 30.2 0.001
Interaction 3 13342.2 13342.2 4447.41 84.38 0.000
Residual Error 6 316.2 316.2 52.7
Total 15 40497.7
Anderson-Darling tests (Fig. 3). Since P value is greater than 0.05 (at 95 % confidence level), it signifies that the data follow a normal distribution and the model developed by Eq. (3) is suitable and quite adequate.
Residual P e r c e n t 10 5 0 -5 -10 99 95 90 80 70 60 50 40 30 20 10 5 1
Normal Probability Plot of the Residuals (response is T)
T P e rc e n t 550 500 450 400 350 300 99 95 90 80 70 60 50 40 30 20 10 5 1 Mean 0.285 425.4 StDev 51.96 N 16
A D 0.421 P-Value
Probability Plot of T Normal: 95% CI
Fig. 2. Normal probability plot of the residuals Fig. 3. Anderson Darling test for normality for cutting temperature
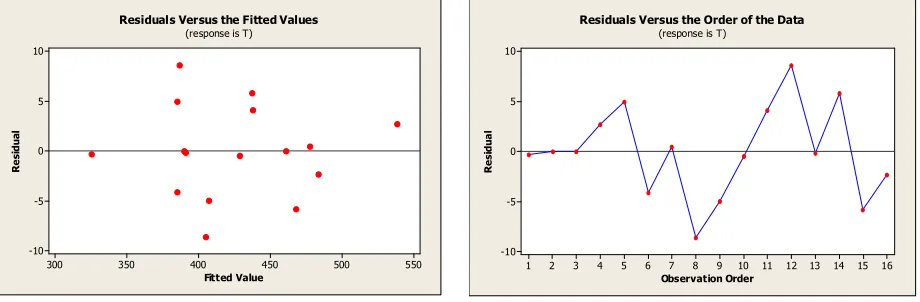
The graphs of residuals vs. fitted values for all cutting temperature areshown in Fig. 4. No unusual structure is apparent. As its standardized residual is within the range of -3 to 3, the model proposed is significant. The graph of residual vs. order of data (Fig. 5) shows the residual for the run order of experiment. This implies that the residuals are random in nature and don’t exhibit any pattern with run order. Also fig of residual vs. order of data revealed that there is no noticeable pattern or unusual structure present in the data.
Fitted Value R e s id u a l 550 500 450 400 350 300 10 5 0 -5 -10
Residuals Versus the Fitted Values (response is T)
Observation Order R e s id u a l 16 15 14 13 12 11 10 9 8 7 6 5 4 3 2 1 10 5 0 -5 -10
Residuals Versus the Order of the Data (response is T)
Fig. 4. Residuals vs. fitted values Fig. 5. Residuals vs. order of the data
414
Table 4
Experimental vs. predicted values for T
Run No Experimental values Predicted values
T T
1 325 325.273
2 390 390
3 461 461
4 541 538.273
5 390 385.023
6 381 385.159
7 478 477.523
8 396 404.659
9 402 406.977
10 428 428.477
11 442 437.841
12 395 386.341
13 391 391.136
14 443 437.136
15 462 467.864
16 481 483.318
Table 5
Comparison of results obtained from experiment with model
Test Process parameters Experiment Model (Eq.3) Error (%)
d f v T T T
1c 0.1 0.05 50 313 303 3.19
2c 0.3 0.1 200 372 365 1.88
4.3 Parametric optimization using desirability approach
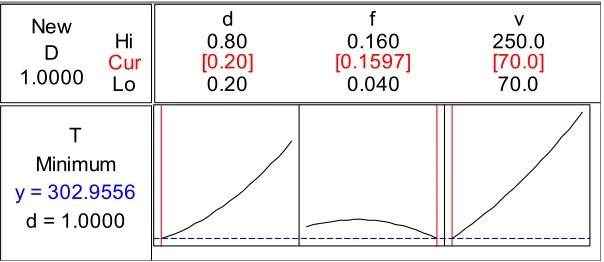
The desirability-based optimization of the RSM was also carried out for the optimization of cutting temperature, which is a unique and powerful optimization procedure. In the desirability function approach, the measured properties of each predicted response are transformed into a dimensionless desirability value d. The scale of the desirability function ranges between d = 0, which suggests that the response is completely unacceptable, and d = 1, which suggests that the response is exactly of the target value. The value of d increases as the desirability of the corresponding response increases (Montgomery, 1997). The optimization analysis was carried out using the MINITAB-14 software.The optimization is carried out for a combination of goals. The goal used for the cutting temperature is ‘minimize’. Different best solutions were obtained using the desirability-based approach. The solution with the highest desirability is preferred. The optimization solution is shown in Fig. 6.
Fig. 6. Optimization of cutting temperature by desirability approach Hi
Lo 1.0000
D New
Cur
d = 1.0000 Minimum
T
y = 302.9556
70.0 250.0
0.040 0.160
0.20 0.80
f v
d
It gives the desirability value for both factors and responses individually. The optimal combination for process parameter is depth of cut at 0.2mm, feed of 0.1597 mm/rev and cutting speed of 70m/min. Based on these combination, the value of cutting temperature is 302.950C whose desirability is one.
5. Conclusions
Based on the above analysis, following conclusions may be drawn:
1. The cutting temperature value increases with increase of cutting speed, feed and depth of cut. A stiff rise in cutting temperature is noticed when feed and cutting speed are elevated. The effect of depth of cut on cutting temperature is not that much significant.
2. The response surface second order model presented high correlation coefficient (R2 = 0.992) explaining 99.2 % of the variability in the cutting temperature. Higher R2 indicates the goodness of fit for the model to the actual data and high statistical significance of the model.
3. ANOVA of second order model found to be significant as its p-value is less than 0.05.
4. Normal probability plot of models shows that the residuals fall on a straight line justifying that the errors are distributed normally and the terms mentioned in the model are significant.
5. The experimental and predicted values are very close to each other. The calculated error for cutting temperature lies between 1.88-3.19 % during confirmation trial. Thus, the developed mathematical models can be effectively utilized for prediction of cutting temperature in hard turning.
6. The optimal combination for process parameter is depth of cut at 0.2mm, feed of 0.1597 mm/rev and cutting speed of 70 m/min. Based on these combination, the value of cutting temperature is 302.950C whose desirability is one.
Acknowledgement
The author gratefully acknowledges School of Mechanical Engineering, KIIT University, Bhubaneswar-24, Odisha, India for providing the facilities to carry out the research work.
References
Basak, S., Dixit, U.-S., & Davim, J. P. (2007). Application of radial basis function neural networks in optimization of hard turning of AISI D2 cold-worked tool steel with a ceramic tool. Proc. I
Mechanical Engineering, Part B: Journal of Engineering Manufacture, 221, 987-998.
Coelho, R.T., Ng, E-G., & Elbestawi, M. A. (2007). Tool wear when turning hardened AISI 4340 with coated PCBN tools using finishing cutting conditions. International Journal of Machine Tools &
Manufacture, 47, 263-272.
Derakhshan, E.D., & Akbari, A. A. (2009). Experimental investigation on the effect of workpiece hardness and cutting speed on surface roughness in hard turning With CBN Tools. Proceedings of
the World Congress on Engineering, Vol II WCE 2009, July 1 - 3, London, U.K.
Huang, Y., Chou, Y.K., & Liang, S.Y. (2007). CBN tool wear in hard turning: a survey on research progresses. The International Journal of Advanced Manufacturing Technology, 35 (5-6), 443-453. Horng, J-T., Liu, N-M., & Chiang, K-T. (2008). Investigating the machinability evaluation of Hadfield
steel in the hard turning with Al2O3/TiC mixed ceramic tool based on the response surface
methodology. Journal of Materials Processing Technology, 208 (1-3), 532-541.
Jacobson, M. (2002). Surface integrity of hard-turned M50 steel. Proc. I Mechanical Engineering,
Part B: Journal of Engineering Manufacture, 216, 47-54.
416
Mahfoudi, F., Gautier, L., Alain, M., Abdelhadi, M., & Lakhdar, B. (2008). High speed turning for hard material with PCBN inserts: tool wear analysis. International Journal of Machining and
Machinability of Materials, 3 (1/2), 62-79.
Montgomery, D. C. (1997). Design and Analysis of Experiments, 4th ed. Wiley, New York.
Özel, T., Hsu, T. K., & Zeren, E. (2005). Effects of cutting edge geometry, workpiece hardness, feed rate and cutting speed on surface roughness and forces in finish turning of hardened AISI H13
steel. The International Journal of Advanced Manufacturing Technology, 25(3-4), 262-269.
Özel, T., & Karpat, Y. (2005). Predictive modeling of surface roughness and tool wear in hard turning using regression and neural networks. International Journal of Machine Tools & Manufacture, 45, 467-479.
Özel, T., Karpat, Y., Figueira, L., & Davim, J. P. (2007). Modelling of surface finish and tool flank
wear in turning of AISI D2 steel with ceramic wiper inserts. Journal of materials processing
technology, 189(1), 192-198.
Park, Y-W. (2002). Tool material dependence of hard turning on the surface quality. International
Journal of the Korean Society of Precision Engineering, 3 (1), 76-82.
Sahin, Y., & Motorcu, A.R. (2008). Surface roughness model in machining hardened steel with cubic boron nitride cutting tool. International Journal of Refractory Metals & Hard Materials, 26, 84-90. Sahin, Y. (2009). Comparison of tool life between ceramic and cubic boron nitride (CBN) cutting tools
when machining hardened steels. Journal of Materials Processing Technology, 209, 3478-3489. Sahoo, A.K., & Sahoo, B. (2012). Experimental investigations on machinability aspects in finish hard
turning of AISI 4340 steel using uncoated and multilayer coated carbide inserts. Measurement, 45, 2153-2165.
Sahoo, A.K., & Sahoo, B. (2011). Surface roughness model and parametric optimization in finish turning using coated carbide insert: Response surface methodology and Taguchi approach.
International Journal of Industrial Engineering Computations, 2, 819-830.
Sahoo, A.K., Orra, K., & Routra, B.C. (2013). Application of response surface methodology on investigating flank wear in machining hardened steel using PVD TiN coated mixed ceramic insert.
International Journal of Industrial Engineering Computations, 4, 469-478.
Singh, D., & Rao, P.V. (2007). A surface roughness prediction model for hard turning process. The
International Journal of Advanced Manufacturing Technology, 32, 1115-1124.
Singh, D., & Rao, P.V. (2007). Optimization of tool geometry and cutting parameters for hard turning.
Materials and Manufacturing Processes, 22, 15-21.
Tamizharasan, T., Selvaraj, T., & Noorul Haq, A. (2006). Analysis of tool wear and surface finish in hard turning. The International Journal of Advanced Manufacturing Technology, 28, 671-679. Thamizhmanii, S., & Hasan, S. (2008). Measurement of surface roughness and flank wear on hard
martensitic stainless steel by CBN and PCBN cutting tools. Journal of Achievements in Materials
and Manufacturing Engineering, 31 (2), 415-421.
Thamizhmanii, S., Bin Omar, B., Saparudin, S., & Hasan, S. (2008). Surface roughness analyses on hard martensitic stainless steel by turning. Journal of Achievements in Materials and Manufacturing
Engineering, 26 (2), 139-142.
XuePing Zhang, C., Liu, R., & Yao, Z. (2006). Experimental study and evaluation methodology on hard surface integrity. The International Journal of Advanced Manufacturing Technology, 34 (1-2), 141-148.
Yallese, M.A., Chaoui, K., Zeghib, N., Boulanouar, L., & Rigal, J-F. (2009). Hard machining of hardened bearing steel using cubic boron nitride tool. Journal of Materials Processing Technology, 209, 1092-1104.
Yallese, M.A., Rigal, J-F., Chaoui, K. & Boulanouar, L. (2005). The effects of cutting conditions on mixed ceramic and cubic boron nitride tool wear and on surface roughness during machining of X200Cr12 steel (60 HRC). Proc. I Mechanical Engineering, Part B: Journal of Engineering