VOLUME 36, ARTICLE 12, PAGES 371
−
390
PUBLISHED 24 JANUARY 2017
http://www.demographic-research.org/Volumes/Vol36/12/ DOI: 10.4054/DemRes.2017.36.12
Reflection
A reflection on the changing dynamics of union
formation and dissolution
Neil G. Bennett
This publication is part of the Special Collection on “Separation, Divorce, Repartnering, and Remarriage around the World,” organized by Guest Editors Andrew Cherlin and Benoît Laplante.
©2017 Neil G. Bennett.
This open-access work is published under the terms of the Creative Commons Attribution NonCommercial License 2.0 Germany, which permits use, reproduction & distribution in any medium for non-commercial purposes, provided the original author(s) and source are given credit.
1 Introduction 372
2 Union dissolution 374
3 The nature of marital dissolution 376
4 The economic consequences of divorce 377
5 Repartnering and remarriage 379
6 The dynamics of same-sex unions 381
7 Conclusions 386
8 Acknowledgments 387
A reflection on the changing dynamics of union formation and
dissolution
Neil G. Bennett1
Abstract
BACKGROUND
This paper reflects upon the remarkable demographic transformation that has taken place among unions around the world. I establish the study of unions in a historical context with respect to its place in demographic studies in general.
OBJECTIVE
I assess the similarities and differences across nations among patterns, trends, and differentials in the determinants and consequences of both marital and nonmarital unions. I focus on data from the United States and a number of other nations, mostly from Europe. Among the vast changes that have transpired over the course of the past several decades I pay special attention to demographic aspects of same-sex unions, as viewed through recently available data, and compare them to the dynamics of opposite-sex unions.
METHODS
I draw upon research conducted by others to examine several global trends and differentials in union formation and dissolution. Further, I explore what constitutes ‘dissolution’ in the United States, and for whom. In addition, I discuss the impact of divorce on the economic well-being of spouses in the United States, with particular emphasis on the relative severity of the consequences for women versus men, as well as the factors underlying this differential.
CONCLUSIONS
Given the notably broader diversity of unions in the world today, the work of demographers has become substantially more complex than was the case years ago. That complexity notwithstanding, it is especially gratifying that we are rapidly accumulating data with which we can assess the dynamics of all unions, and not merely those of the marital or opposite-sex variety.
1
1. Introduction
Over the past several decades we have witnessed a wholesale transformation in global demography. An important part of this transformation is the evolving patterns of union formation and dissolution that form the basis for much of this reflection. However, changes in global demography also include dramatic shifts in the level of each of the major components of population growth: fertility, mortality, and migration.
A smattering of statistics paints a vivid picture. According to the United Nations Population Division (2015), in the early 1970s nearly one hundred countries had total fertility rates of 6.0 or greater and only 20 or so countries had fertility rates below replacement level (here defined as 2.10 or less). By 2010‒2015, however, only a handful of countries – seven in all – had a TFR greater than 6.0, led by Niger with 7.6, while some 82 nations had below replacement fertility, with Singapore, for example, as low as 1.2.
During this same time frame, mortality levels also changed substantially. Life expectancy in the early 1970s in low-income countries averaged 43.7 years and in high-income nations, 70.4 years. Africa, for example, averaged 46.4 years, Asia, 56.4 years, and Europe, 70.6 years. Today (2010‒2015), however, the corresponding figures are 60.3 years and 78.8 years in low-income and high-income countries, respectively, and 59.5 years, 71.6 years, and 77.0 years in Africa, Asia, and Europe, respectively (United Nations Population Division 2015).
Years ago, there was relatively little emphasis on migration, as this aspect of demographic growth was dwarfed by fertility in the context of the ‘demographic accounting equation.’ As I have noted above, however, fertility rates have dropped precipitously among so many nations that fears of a global population explosion have abated. Demographers’ focus on migration has sharpened as its relative contribution to population change has risen.
Our changing world – not only in reference to the demographic statistics mentioned above but also, importantly, to the shifting over time of what is deemed socially acceptable – has in turn forced demographers to expand their field of vision in order to comprehensively examine the demographic processes they purport to understand.
level of 7.7% that held for 1965 (US Department of Health, Education, and Welfare 1974; Hamilton, Martin, Osterman 2016).
In a similar fashion, in understanding the dynamics of unions it has become increasingly untenable to focus exclusively on those that are formal. Indeed, the dramatic changes in union formation and dissolution around the world were the motivation behind the IUSSP conference from which the articles in this Special Collection originated. Long ago, it was safe to assume that the vast majority of long-term, formal relationships were marital and that all marital unions were of opposite-sex individuals. Today, limiting our view to only marriages of that variety would result in a severely skewed understanding of relationships. With the rapid rise of cohabitation – whether premarital, intermarital, postmarital, or, most broadly expressed, nonmarital – and same-sex unions, not to mention the now commonplace practice of divorce and remarriage, the landscape of relationships in the United States and elsewhere around the world is not as smooth as it once was. We are not in Kansas anymore, and the stereotypical family life once associated with that American heartland no longer applies.
The demography of the world has undergone profound change. In some cases what was once simple is now more complex, while in others what was once complex is now simpler. In many countries, data quality has improved – in vital registration systems, for example – to the point where the data can, in fact, be taken at face value and handled straightforwardly, obviating the need for indirect demographic estimation. Simplicity in such circumstances is thus associated with greater accuracy in conjunction with less effort required from the researcher.
In other ways, however, a demographer’s life has become more complicated. The life course of mid-20th-century America used to be commonly characterized as an unwavering linearity of courtship, followed by marriage, and then childbearing. However, with departures from that pattern often hidden from view, as Coontz (1992:36) notes, a romanticized view of the so-called ‘traditional’ family of the mid-20th-century is misplaced. Marriage occurring in perfect step with a couple’s coresidence is very much no longer the case today among vast numbers of Americans and others around the world. Adding even greater complexity to the life course is the fact that childbearing today occurs at any point during the reproductive age span, regardless of marital status. Thus the firm sequence of life events once so ingrained in our culture has now been relegated to the dustbin of history.
with a review of the rapid rise of same-sex marriages in the United States and other countries around the world, and a focus on how the marriage patterns and differentials of same-sex marriages compare with those of opposite-sex marriages.
2. Union dissolution
Over the past few decades there has been a widespread trend towards higher levels of divorce. In Figure 1a we see trends by marriage cohort in Singapore (Ministry of Social and Family Development 2015). Cumulative dissolution rates rose in Singapore until the marriage cohorts of the early 2000s. For example, the proportion of couples who divorced within ten years of marriage increased by 85% between the marriage cohort of 1987 and that of 2003, from 8.7% to 16.1%. For marriages contracted in the later years of the 2000s, dissolution rates appear to have leveled off.
Figure 1a: Duration-specific probability of divorce in Singapore, by marriage cohort, 1987‒2008
Figure 1b: Duration-specific probability of divorce in the United States, by marriage cohort for women, 1960‒1964 through 1995‒1999
Source: Kreider and Ellis 2011
This trend has been seen in many countries around the world. Lampard (2013) documents the rise of dissolution over marriage cohorts in England and Wales. Raymo and his colleagues (2013) describe the notable rise in divorce in Japan. In the United States, as shown in Figure 1b, we see that dissolution rates have increased over marriage cohorts, but in the most recent cohorts it appears that these rates have peaked and then declined somewhat (Kreider and Ellis 2011), likely fueled in part by a rising age at marriage (Kennedy and Ruggles 2014). Of course, this figure masks the differences that exist in marital stability across subgroups. For example, Kreider and Ellis (2011) find in 2009 data from the US Census Bureau’s Survey of Income and Program Participation that while 22% of Asians and 34% of Hispanics will ultimately divorce, 41% of non-Hispanic whites and 49% of non-Hispanic African Americans will do so.
3. The nature of marital dissolution
Whether marital dissolution in recent years has plateaued or declined somewhat, or even has continued to increase, what remains indisputable is that dissolution among marriages today is much more frequent than it was decades ago. That said, what constitutes ‘dissolution’ is often ambiguous. In many marriages, dissolution in the form of a legal divorce may take place many years after the initial separation of the couple. In some cases the couple may indeed be fixed in a permanent state of limbo, neither functionally married nor legally divorced, and thus less able in many ways to get on with their lives, including being able to perhaps once again achieve a state of emotional fulfillment through a rewarding romantic relationship. Important, too, is the fact that the legal termination of marriage can result in the freedom to set a more permanent course towards financial stability.
The extent to which a marital separation is followed by divorce varies considerably among subgroups. In the United States there has long been a substantial racial divide in the time to divorce conditional upon marital separation. In their analysis of data from the National Longitudinal Survey of Youth (NLSY), Roeper and Bennett (2015b) find that although the modal duration of separation prior to divorce is quite similar for African Americans and whites, at approximately six months, the overall duration distributions are dramatically different. The distribution among whites is far more peaked at that modal value than it is among African Americans. In addition, far greater proportions of the latter group exist at longer durations than is the case among whites.
Put differently, within two years of separation only one-third or so (32%) of whites have yet to divorce, but well over two-thirds of African Americans (72%) have not divorced. By ten years post-separation, all but 5% of whites have legally divorced. In stark contrast, among African Americans nearly five times as many, 23%, have not yet divorced.
It is not clear why this race differential exists. Roeper and Bennett (2015b) show that large differentials also exist with respect to a variety of socioeconomic factors. For example, among women in the top quartile of wealth, only 5% have not divorced within ten years of their initial separation. In comparison, nearly four times as many, 19%, have yet to divorce among women in the bottom quartile of wealth. Similarly, separated women who have not graduated high school are more than twice as likely to remain in that state as women who have graduated college (14% versus 6%).
differential is remarkably robust to the inclusion of these factors – including education, income, and wealth, among others – in a multivariate context.
To illustrate the extent to which race and socioeconomic status jointly influence the likelihood of divorce conditional upon marital separation, Roeper and Bennett (2015b) create an illustrative simulation based on their multivariate modeling of the NLSY data. At the extremes, they find that nearly three-quarters, or 72%, of white college graduates in the top quartile of income and wealth are estimated to divorce within two years of separation. All but 3% are estimated to divorce within ten years of separation. However, among African American women who did not graduate high school and who are in the lowest quartiles of income and wealth, only 23% have divorced within two years. Not even half (49%) have divorced within ten years post-separation.
Given the persistent race effect found in multivariate modeling, it appears that much work remains to be done in the effort to understand what is the driving force that gives rise to the very different marital dissolution experiences of African American and white women.
4. The economic consequences of divorce
There are several ways in which divorce, once it finally occurs, affects the well-being, for better or for worse, of the couple and those around them, whether psychologically, socially, or financially. With respect to the economic impact, we have long known that women suffer more in this regard (see, e.g., Duncan and Hoffman 1985; McManus and DiPrete 2001; Peterson 1996; and Smock, Manning, and Gupta 1999), but why? And might we expect this to change?
Most recently, in seeking to understand these issues more deeply, Roeper and Bennett (2015a) have analyzed US data from the Panel Study for Income Dynamics, 1970 through 2009. It is useful to conceive of economic well-being in terms of one’s income relative to one’s needs. This conception is predicated on the notion that one’s economic well-being depends not only upon the amount of income that a household earns but the number of people that income has to support. Thus one possible measure of interest is:
= , (1)
which in the United States is determined by the US Census Bureau for any year of interest.
What Roeper and Bennett focus on is whether and by how much this measure of economic well-being changes from just prior to divorce (e.g., two years before) to just after divorce (e.g., two years after), and, in particular, whether and by how much this change differs between women and men. This change in economic well-being, as formulated in equation (1), can be decomposed into the change in household income that has taken place between the two points in time and the corresponding change in needs, as represented by the poverty threshold associated with each spouse’s household before and after the divorce.
By examining this decomposition in a multivariate framework the correlates of change can be determined in each component of economic well-being – household income and the proxy for household needs, the poverty threshold – for women versus men.
That women earn less than men and thus stand to lose more upon divorce in terms of income is well established. But the decomposition makes clear that it behooves us to examine the role of changing needs over time if we are to fully understand differences in the changes in economic well-being of women and men as they transition to divorce.
The courts play a significant role here, as, in child custody decisions, they award any children a couple may have to the mother much more often than to the father. Consequently, with the larger household that a wife may head post-divorce, compared to the household her husband may head, a wife’s needs will increase relative to her husband’s needs. This is reflected in a higher poverty threshold for the wife’s new household, compared to the new poverty threshold for the husband – absent remarriage and its associated changes in household composition due to the merging of families.
In their analysis of data from the Panel Study of Income Dynamics, Roeper and Bennett (2015a) confirm the fact that women fare considerably worse than men with respect to economic well-being two years post-divorce. Interestingly, a majority of that decline in well-being relative to men is the result of greater needs among women relative to men in those post-divorce years. The remainder of the relative decline in economic well-being is due to the impact of income loss.
that component of economic well-being is rendered moot: the only factor driving differential changes in overall economic well-being relates to differences in the spouses’ incomes. As women continue to increase their participation in the labor force and also to increase their working hours, the relative influence of child custody decisions on economic well-being will assume greater importance.
Other literature has established that women also suffer disproportionately upon the dissolution of cohabiting unions. In an analysis of US data from the National Longitudinal Survey of Youth, Avellar and Smock (2005) find that African American and Hispanic women, in particular, experience deterioration in their economic position relative to that of their male partners. In their examination of data from Statistics Canada’s Longitudinal Administrative Databank, Le Bourdais and colleagues (2016) also find that dissolution, for both formal and informal unions, results in a greater negative economic impact among women than among men. Subsequent to dissolution, married women appear to fare more poorly than cohabiting women. However, Le Bourdais and colleagues (2016) find some evidence that would support the eventual convergence of the dissolution experiences of cohabitors and married couples. This seems likely to happen as childbearing and labor force participation patterns in the two types of unions become more similar over time.
5. Repartnering and remarriage
Remarriage, or repartnering in general, is today a fairly common occurrence in many countries, suggesting that however high divorce rates might be they do not constitute a sweeping rejection of the institution of marriage but instead a rejection of individuals. That said, there is much variation in the likelihood of repartnering across a range of individual characteristics. For example, McNamee and Raley (2011) find that in the United States there are sizable race differentials in the propensity to repartner or to remarry, with non-Hispanic whites substantially more likely to do so than those in other racial/ethnic categories. They also found that the likelihood of repartnering is negatively associated with age at separation or divorce. Pasteels and Mortelmans (forthcoming), analyzing data on unions in the Belgian Data Warehouse “Labor Market and Social Protection,” also find a significant negative association in Belgium between age at break-up, whether in marriage or cohabitation, and the likelihood of subsequent repartnering.
women who dissolved their union at age 25 to 29, those who did so at below the age of 25 were about 35% more likely to repartner. Those who dissolved their union at age 35 or older were 42% less likely to repartner.
One can speculate as to why this age gradient exists, but some insight can be drawn from the ‘big data’ found on online dating sites. One such site is OkCupid, and its founder, Christian Rudder, has described the results of many analyses of data from that site that examined what people actually do online, rather than what they say they do (Rudder 2014). In other words, the tens of millions of preferences expressed by OkCupid members as they seek an appropriate date are unfiltered for political correctness.
Figure 2a displays the mean age of the men whom a given-aged woman finds most attractive. For example, the graph suggests that, on average, a 30-year-old woman finds herself most attracted to a man who is also 30 years old. Data points falling along the 45-degree line would imply that women prefer men of the same age as themselves. To a large extent, this is indeed so among women under age 40 as there is little deviation of the data from the 45-degree line, but women beyond age 40 tend to prefer somewhat younger men.
Figure 2a: Attraction between the sexes
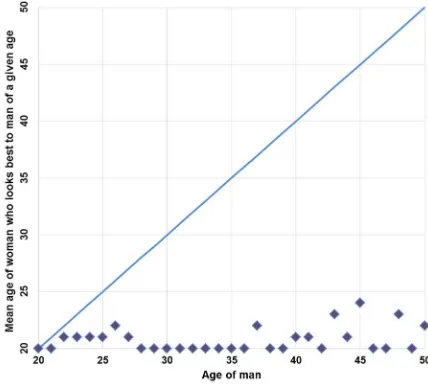
Figure 2b: Attraction between the sexes
Source: Rudder 2014
Upon examining Figure 2b, however, we find strikingly different behavior among men. In a nutshell, men, regardless of their age, whether 20 or 50, prefer women around 21 years of age. To many, this may not rise to the level of an ‘alert the media’ moment, as I am sure that most of us have accumulated much anecdotal evidence in support of this claim, but it is rather astonishing to find this behavior so explicitly and dramatically manifested in the data. With this finding in hand, it comes as no surprise that a woman’s likelihood of repartnering diminishes significantly with age. Without making a judgment about the social acceptability of these attitudes, the sex-specific perception of attractiveness is surely one of many factors that influence the likelihood of repartnering.
6. The dynamics of same-sex unions
of union. Most noteworthy is the lead taken by Scandinavian countries over the past decade in collecting detailed union histories among same-sex as well as opposite-sex couples. With this data, and now data from additional sources as well, we can compare various kinds of union – opposite-sex, female same-sex, and male same-sex – and ascertain the similarities and differences in their dynamics.
Our position today with respect to the availability of data on same-sex unions and the relative dearth of analysis on the subject is roughly equivalent to where we were some 30 years ago in regard to the availability and analysis of data on cohabitation. At that time, too, Scandinavian countries were at the fore of collecting data about these couples, with few other nations doing so.
There are, of course, crucial differences between the circumstances surrounding the availability of data on these different kinds of relationship, 30 years apart. Let us acknowledge what is obvious: cohabitation is the product of personal preference, the incidence of which is clearly influenced by the degree of social stigma associated with these relationships in whichever locale they are taking place. By contrast, involvement in a same-sex union is dictated, first and foremost, not by preference but by one’s sexual orientation. Layered on top of that innate desire to be in a same-sex union are the legal constraints imposed upon such couples by the state.
It is with nothing short of amazement that I have viewed the astonishing rapidity with which legal acceptance of same-sex marriages in the United States has come about in just the past few years, crowned by the 2015 Supreme Court decision, Obergefell v. Hodges, which legalized same-sex marriages across the land. Indeed, the swift rise of acceptance is a worldwide phenomenon, although universal acceptance unquestionably lies in the distant future. Whereas as of April 2016 22 countries on six continents had legally recognized same-sex couples, precisely zero countries provided such recognition just 15 years prior (Freedom to Marry 2016).
In a study of marriages in Sweden between 1993 and 1999, Andersson and colleagues (2006) find that same-sex couples are somewhat more educated than their opposite-sex counterparts. For example, while at least one spouse has a secondary education among 44% of opposite-sex couples, the corresponding figures for same-sex couples are 57% and 56% among females and males, respectively. The same study finds that the age difference in opposite-sex couples tends to be substantially less than in same-sex couples. Half of opposite-sex couples differed in age by fewer than three years, as opposed to 38% and 24% among same-sex female and male couples, respectively. At the other extreme, fully one-third (34%) of same-sex male couples differed by at least ten years of age. Fifteen percent of same-sex female couples differed in age to that extent, and only 9% of opposite-sex couples.
For example, in Norway Wiik, Seierstad, and Noack (2014) find that, among unions begun between 1993 and 2010, both female and male same-sex unions are significantly less stable than opposite-sex unions, with relative risks of 2.28 and 1.38, respectively. Among unions in the United States, however, both Rosenfeld (2014) and Ketcham and Bennett (2016) find that while female same-sex marriages are significantly less stable than opposite-sex marriages, the stability of male same-sex marriages is statistically no different from that of their opposite-sex counterparts.
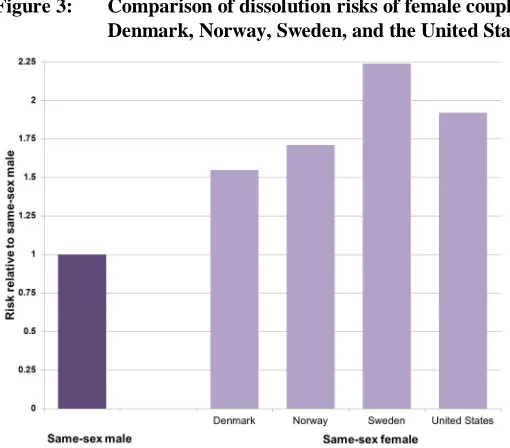
A greater instability of female same-sex unions relative to male same-sex unions has been found consistently across a number of countries. In Figure 3 we see that in Denmark, Norway, Sweden, and the United States, female same-sex unions appear to be substantially less stable than male same-sex unions, with relative risk ratios of 1.5, 1.7, 2.2, and 2.1, respectively (Andersson and Noack 2010; Andersson et al. 2006; Rosenfeld 2014; and Wiik, Seierstad, and Noack 2014).
Figure 3: Comparison of dissolution risks of female couples and male couples ‒ Denmark, Norway, Sweden, and the United States
Sources: Andersson and Noack 2010 (Denmark 1989–2002); Wiik, Seierstad, and Noack 2014 (Norway 1993–2010); Andersson et al. 2006 (Sweden 1995–2002); and Rosenfeld 2014 (United States 2009)
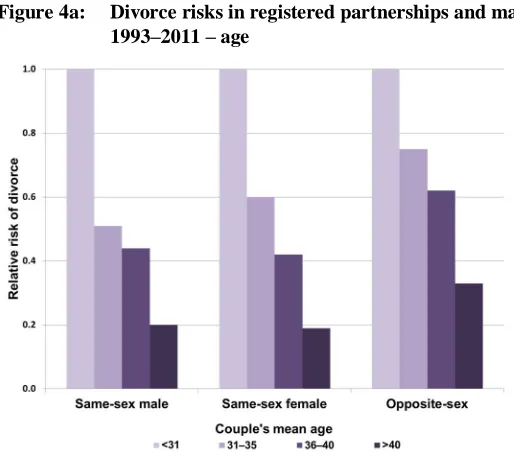
Seierstad, and Noack (2014), comparing opposite-sex couples with female and male same-sex couples. For all three types of relationship there is a clear age gradient in the risk of dissolution. Among opposite-sex couples the risk associated with an age at union of over 40 years is just one-third (.33) that of those who formed their unions before the age of 31 years. The corresponding risk ratios are .19 and .20 among female and male same-sex couples, respectively.
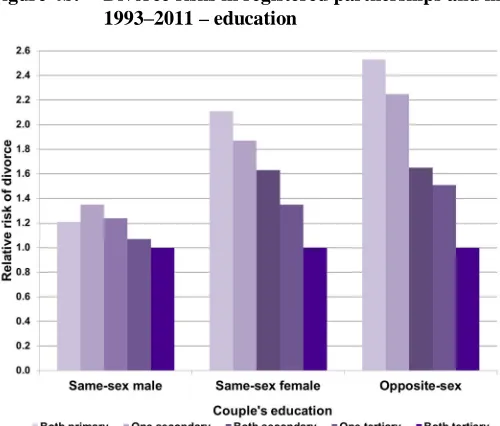
Figure 4b illustrates the education gradient in the risk of dissolution for couples in Norway (Wiik, Seierstad, and Noack 2014). In opposite-sex unions begun between 1993 and 2010, the risk of dissolution among couples whose partners both had only a primary education was 2.53 times that of couples whose partners both had a tertiary education. The gradient among female same-sex couples was similarly strong, where the risk ratio was 2.11 for the less-educated couples. Among male same-sex couples the gradient was in the same direction but somewhat weaker, with the least-educated couples having a risk 1.21 times that of the best-educated couples.
In Sweden also, both the age and education gradients in all types of relationship are very strong, and in the same direction as in Norway (Andersson et al. 2006).
Figure 4a: Divorce risks in registered partnerships and marriages, Norway 1993‒2011 ‒ age
Figure 4b: Divorce risks in registered partnerships and marriages, Norway 1993‒2011 – education
Source: Wiik, Seierstad, and Noack 2014
Above, we have seen substantial similarity in the dynamics of same-sex and opposite-sex unions, specifically with respect to the relationship between union dissolution on the one hand and education and age at union of the partners on the other. It is worth mentioning one additional way in which these two types of union resemble each other. In the How Couples Meet and Stay Together surveys, 3,009 couples in the United States were randomly selected in 2009, with an oversampling of same-sex couples (Rosenfeld 2014). They were followed in several waves thereafter. One question determined whether an individual had the approval of his or her parents for the union in which he or she was involved. The results are illustrated in Figure 5.
‘non-issue’ among parents, it appears that traditional views concerning the importance of legal unions are of considerably greater concern.
Figure 5: Parental Approval of opposite-sex vs. same-sex relationships, United States, 2009‒1012
Source:Rosenfeld 2014
7. Conclusions
For many, the bygone era of the mid-20th century evokes images of a stereotypical nuclear family, stable and secure, spouses committed to each other for a lifetime, and childbearing occurring exclusively within marriage. Marriage was an absorbing state, with the exception of departure by death. Demographers know that, however well that stereotype might have depicted the family structure of that time, it bears little resemblance to relationships and family life in today’s far more diverse world. That stereotype seems as quaint now as US elementary school ‘duck and cover’ drills from that time, in which pupils would practice ducking under their desks to protect themselves from nuclear annihilation.
higher-order marriages. In 1967 14% of currently married women in the United States were in their second or higher-order marriage (US Bureau of the Census 1971). A little over 40 years later, in 2008 to 2012, 23% of currently married women were in marriages beyond their first (Lewis and Kreider 2015).
Further, the expanding inclusiveness of who is eligible for legal marriage in the United States has been both strikingly recent and remarkably fast. Merely a decade ago, in 2007, 43 states banned same-sex marriage, either by statute or constitutional amendment. Only one state, Massachusetts, had legalized same-sex marriages. State approval grew rapidly after that year, culminating with the 2015 Supreme Court ruling that legalized same-sex marriages for all.
In the wake of such profound change, demographers have broadened their analyses to accommodate all that is now implied by union formation and dissolution.
Today, as in no time before, in many nations around the world, individuals are able to act on their desires in ways they feel do not infringe upon others’ well-being. Depending on your political persuasion or moral compass, you might say that wider reproductive choice, or the increasing options in family arrangements, or the ability to opt out of a marriage and perhaps start a new one, or indeed to freely choose a partner consistent with your sexual orientation, is a good or bad thing.
Further, though, from a scholar’s perspective, the new chronology of life events and the expansion of possibilities with respect to the kind of union in which individuals participate may wreak havoc with a demographer’s desire to understand the determinants or consequences of demographic processes. But although the remarkable transformation of family life in the past few decades has made the lives of demographic research scholars much more complex, I believe it has also made our work much richer.
8. Acknowledgments
References
Andersson, G. and Noack, T. (2010). Legal advances and demographic developments of same-sex unions in Scandinavia. Stockholm: Stockholm University Linnaeus Center on Social Policy and Family Dynamics in Europe (Working Paper 2010:2).
Andersson, G., Noack, T., Seierstad, A., and Weedon-Fekjær, H. (2006). The demographics of same-sex marriages in Norway and Sweden. Demography
43(1): 79‒98.doi:10.1353/dem.2006.0001.
Avellar, S. and Smock, P. (2005). The economic consequences of the dissolution of cohabiting unions.Journal of Marriage and Family 67(2): 315‒327.
doi:10.1111/j.0022-2445.2005.00118.x.
Coontz, S. (1992).The way we never were: American families and the nostalgia trap. New York: Basic Books.
Duncan, G.J. and Hoffman, S.D. (1985). A reconsideration of the economic consequences of marital dissolution. Demography 22(4): 485‒497.doi:10.2307/ 2061584.
Freedom to Marry (2016). The freedom to marry internationally [electronic resource].
freedomtomarry.org/pages/the-freedom-to-marry-internationally
Galezewska, P., Perelli-Harris, B., and Berrington, A. (forthcoming). Cross-national differences in repartnering behaviour in Europe: The role of individual demographic characteristics.Demographic Research.
Hamilton, B.E., Martin, J.A., and Osterman, M.J.K. (2016). Births: Preliminary data for 2015. Hyattsville: National Center for Health Statistics (National Vital Statistics Reports 65[3]).
Kennedy, S. and Ruggles, S. (2014). Breaking up is hard to count: The rise of divorce in the United States, 1980–2010. Demography 51(2): 587‒598.doi:10.1007/s13 524-013-0270-9.
Ketcham, E. and Bennett, N.G. (2016). Comparative couple stability: Same-sex and opposite-sex unions in the United States. Presented at the meetings of the Population Association of America, Washington, D.C., March 31‒April 2, 2016.
Lampard, R. (2013). Age at marriage and the risk of divorce in England and Wales.
Demographic Research 29(7): 167‒202.doi:10.4054/DemRes.2013.29.7
Le Bourdais, C., Jeon, S.-H., Clark, S., and Lapierre-Adamcyk, E. (2016). Impact of conjugal separation on women’s income in Canada: Does the type of union matter? Demographic Research 35(50): 1489−1522. doi:10.4054/DemRes. 2016.35.50.
Lewis, J.M. and Kreider, R.M. (2015). Remarriage in the United States. Washington, D.C.: US Census Bureau (American Community Survey Reports ACS-30).
Manning, W.D., Brown, S.L., and Stykes, J.B. (2016). Same-sex and different-sex cohabiting couple relationship stability.Demography 53(4): 937−953.doi:10.10 07/s13524-016-0490-x.
McManus, P.A. and DiPrete, T.A. (2001). Losers and winners: The financial consequences of separation and divorce for men.American Sociological Review
66(2): 246−268. doi:10.2307/2657417.
McNamee, C.B. and Raley, R.K. (2011). A note on race, ethnicity, and nativity differentials in remarriage in the United States. Demographic Research 24(13): 293−312.doi:10.4054/DemRes.2011.24.13.
Ministry of Social and Family Development, Republic of Singapore (2015). Dissolutions of marriages among marriage cohorts, 1987‒2012. Singapore: Ministry of Social and Family Development, Republic of Singapore (Statistics Series Paper No. 1/2015).
Pasteels, I. and Mortelmans, D. (forthcoming). The socioeconomic determinants of repartnering after dissolving a marriage or cohabitation.Demographic Research.
Peterson, R.R. (1996). A re-evaluation of the economic consequences of divorce.
American Sociological Review 61(3): 528‒536. doi:10.2307/2096363.
Raymo, J.M., Fukuda, S., and Iwasawa, M. (2013). Educational differences in divorce in Japan. Demographic Research 28(6): 177‒206. doi:10.4054/DemRes.2013. 28.6.
Roeper, T. and Bennett, N.G. (2015a).The evolving economic consequences of divorce. Presented at the meetings of the Population Association of America, San Diego, April 30–May 2, 2015.
Rosenfeld, M. (2014). Couple longevity in the era of same-sex marriage in the United States. Journal of Marriage and Family 76(5): 905‒918. doi:10.1111/jomf. 12141.
Rudder, C. (2014). Dataclysm: Who we are (when we think no one’s looking). New York: Crown.
Smock, P.J., Manning, W.D., and Gupta, S. (1999). The effect of marriage and divorce on women’s economic well-being. American Sociological Review 64(6): 794‒
812. doi:10.2307/2657403.
United Nations Population Division (2015). World population prospects: The 2015
revision, Volume I: Comprehensive Tables. New York: United Nations.
https://esa.un.org/unpd/wpp/publications/Files/WPP2015_Volume-I_ Comprehensive-Tables.pdf
US Bureau of the Census (1971). Current Population Reports, Series P-20, No. 223, Social and economic variations in marriage, divorce, and remarriage: 1967 [electronic resource]. Washington, D.C.: US Government Printing Office.
https://www.census.gov/hhes/socdemo/marriage/data/cps/p20-223/tables.html
US Department of Health, Education, and Welfare, Public Health Service (1974). Trends in illegitimacy, United States 1940–1965 [electronic resource]. Rockville: National Center for Health Statistics (DHEW Publication No. [HRA] 75-1013).https://www.cdc.gov/nchs/data/series/sr_21/sr21_015.pdf